
2 minute read
THE AUSTIN (P


THE AUSTIN
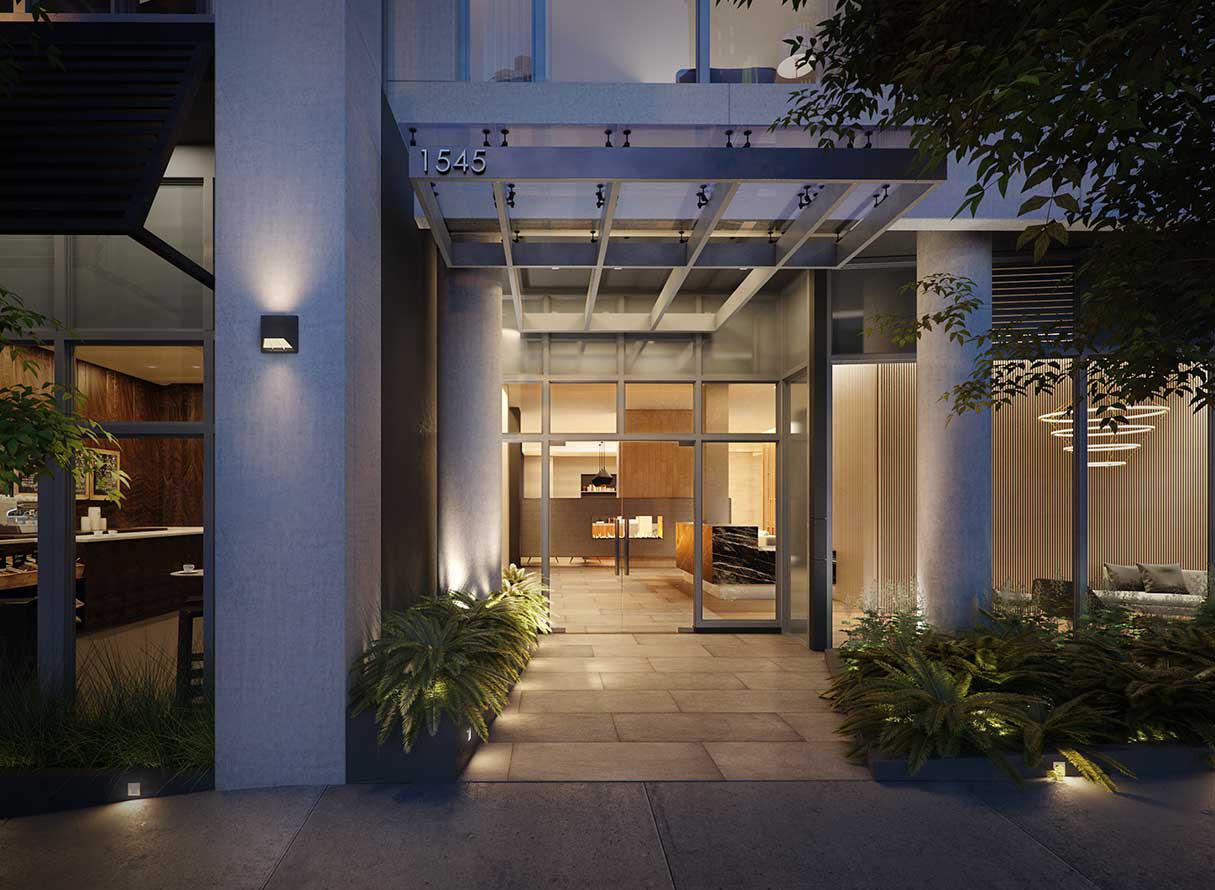
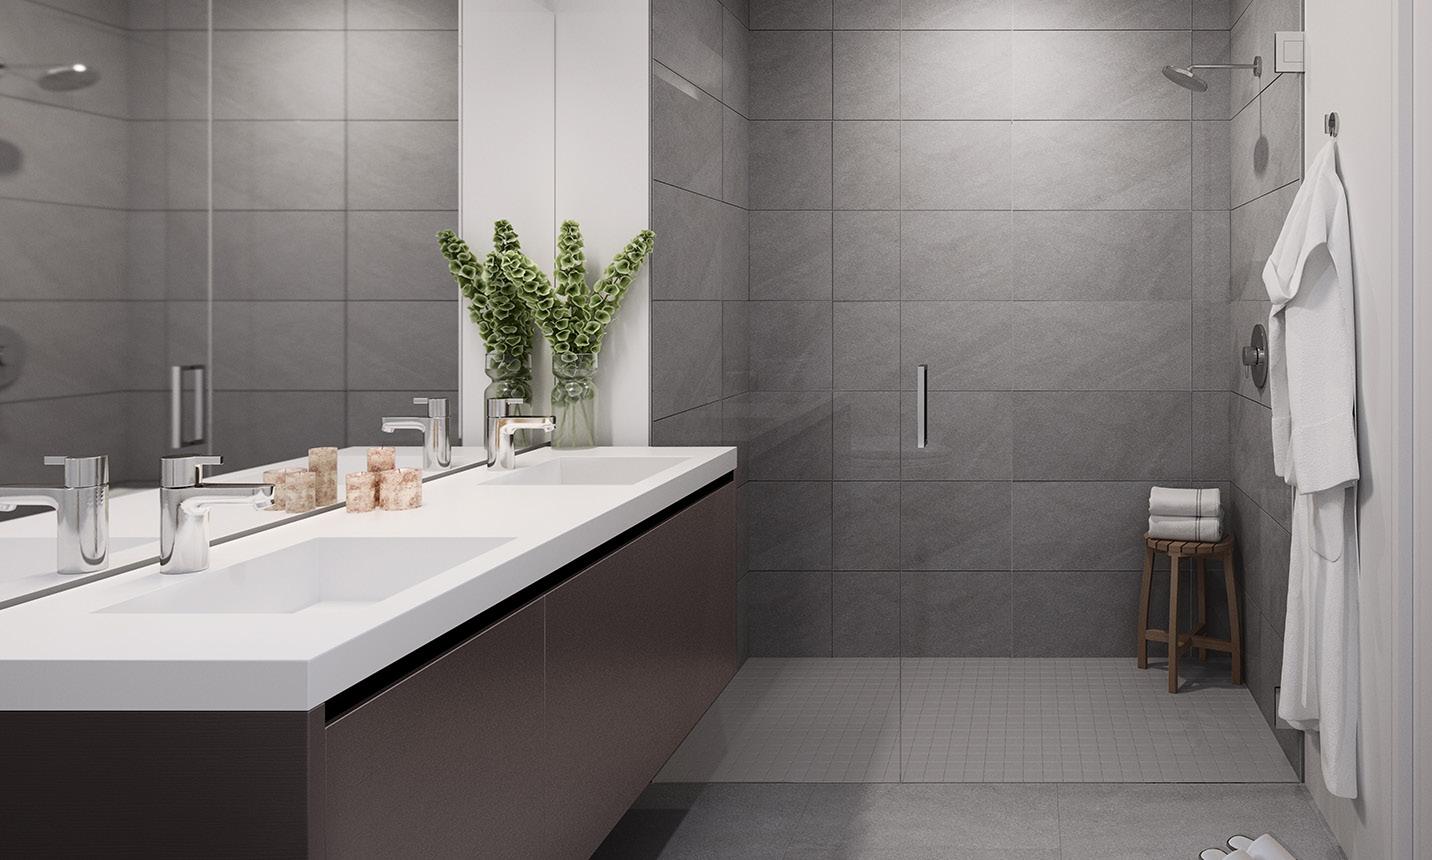
1545 Pine Street at Van Ness | Polk Gulch Average $/SqFt (closings): $1,445 Date on market: February 2017 Project specs: 100 units, 12-stories, 12 BMRs Developer: Pacific Eagle Architect: Arquitectonica/ BDE Interiors: Edmonds+Lee Features & Finishes: Miele gas ovens and cook-tops, Bosch dishwashers, Hansgrohe fixtures, Quartz counter tops and backsplash, Sozo Studio cabinetry, Duravit toilets and bathtubs, Porcelain tiled bathroom floors and showers, Nest Thermostats, Wide-plank oak floors, Floor-to-ceiling windows Amenities: Lobby with fireplace, Lobby-level bike parking, Courtyard, Doorman, Roof terrace with fire pit, Pet washing station, Coworking area Website: TheAustinSF.com


THE AUSTIN CLOSINGS CONTINUED ON FOLLOWING PAGE

CLOSINGS - THE AUSTIN
Unit Bed/Bath SQ. FT. Parking HOA $ $ $/SQ. FT. Date
302 307 407 402 502 507 207 504 605 404 604 609 412 401 210 610 0/1 0/1 0/1 0/1 0/1 0/1 0/1 0/1 0/1 0/1 1/1 1/1 0/1 1/1 1/1 1/1
703
1/1 1006 1/1 802 1/1 211 1/1 902 1/1
903
1/1 1003 1/1 1206 1/1 422 441 $602 442 $602 432 0 $638,500 $1,513 Q4 2017 0 $642,350 $1,457 Q2 2018 0 $645,000 $1,459 Q2 2018 0 $646,000 $1,495 Q4 2017
432 432 $598 442 $600 630 $668 637 $769 630 $668 630 603 $659 637 598 $651 537 $726 640 $767 700 626 $762 742 $795
0 $681,000 $1,576 Q4 2017 0 $690,000 $1,597 Q2 2018 0 $710,500 $1,607 Q4 2017 0 $729,500 $1,158 Q4 2017 0 $770,000 $1,209 Q2 2020 0 $777,000 $1,233 Q4 2017 0 $799,000 $1,268 Q2 2018 0 $799,500 $1,326 Q3 2018 0 $817,600 $1,284 Q4 2017 0 $844,590 $1,412 Q1 2018 1 $880,000 $1,639 Q4 2017 1 $899,500 $1,405 Q2 2018 1 $972,500 $1,389 Q4 2017 1 $1,005,000 $1,605 Q4 2017 1 $1,005,000 $1,354 Q1 2018 699 $804 1 $1,010,000 $1,445 Q3 2019 742 ~$801 1 $1,030,000 $1,388 Q2 2018 737 $801 1 $1,039,000 $1,410 Q4 2017 626 $797 626 $762 1 $1,040,000 $1,661 Q1 2018 1 $1,045,000 $1,669 Q4 2018
312 1/1 581 $801 1 $1,051,500 $1,810 Q4 2017
803 406 1/1
738 $803 1 $1,013,000 $1,373 Q3 2018 1/1 992 1 $1,090,000 $1,099 Q2 2018
1103 1/1 737 $907 1 $1,099,000 $1,491 Q1 2020
506 608 1/1 991 1/1 806 $826 1 $1,115,500 $1,126 Q2 2018 1 $1,155,000 $1,433 Q3 2018
1203 1/1 581 $801 1 $1,178,500 $2,028 Q4 2017
509 603 1/1 806 $826
1 $1,285,000 $1,594 Q3 2018 2/2 1,131 942 1 $1,390,000 $1,229 Q2 2019
705 409 805 804 1207 309 2/2 1,158 2/2 1,400 2/2 1,157 $950
1 $1,480,000 $1,278 Q2 2018 1 $1,485,000 $1,061 Q2 2018 1 $1,525,000 $1,318 Q2 2018 2/2 1,140 $939 1 $1,540,000 $1,351 Q4 2017 2/2 1,132 ~$939 1 $1,551,000 $1,370 Q2 2018 2/2 1,165 1 $1,580,000 $1,356 Q4 2017
1005 1105 209 2/2 1,158 $950
1 $1,600,000 $1,382 Q4 2019 2/2 1,158 $1,061 1 $1,675,000 $1,446 Q1 2020 2/2 1,398 $1,015 1 $1,730,000 $1,237 Q4 2017
1104 704 1101 2/2 1,140 2/2 1,157 2/2 1,140 1 $1,736,500 $1,523 Q4 2017 1 $1,850,000 $1,599 Q4 2017 1 $1,941,500 $1,703 Q4 2017


