9 minute read
Export Facilitators Project update


Export Facilitators Projectupdate
BY MANUS STOCKDALE EXPORT DEVELOPMENT PROJECT LEAD, VEGETABLESWA
Advertisement
As we approach the end of 2020 we’re all hoping that the new year will see the world returning to some form of ‘normal’.
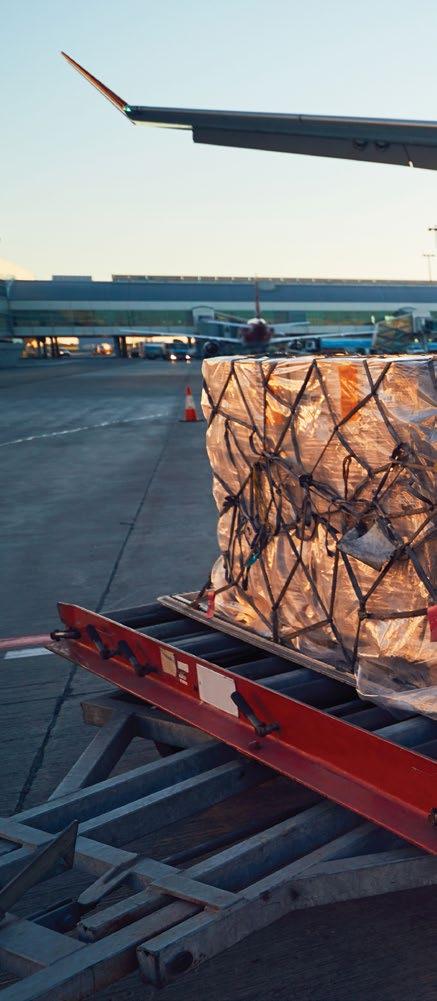
Impact of COVID-19 on WA vegetable exports
The export trade has been heavily disrupted by COVID-19 with the biggest impacts coming from freight and logistics, particularly in the air freight section. The Australian Government’s International Freight Assistance Mechanism has provided some relief, but exporters should be adjusting to the ongoing impact of the pandemic well into next year. The International Air Transport Association is reporting that air travel is unlikely to return to pre-COVID conditions until 2024, so it is important that Australian businesses review their operating models. In a recent Austrade communication with exporters International Freight Co-ordinator General, Michael Byrne, suggested businesses should consider the following: 1. Aggregate and consolidate — While it may seem counterintuitive under
normal conditions, with COVID-19 still impacting flights, businesses need to work together with other exporters and freight forwarders to consolidate loads. By doing so, businesses may be able to access lower rates for loading, packing, warehousing and transport. 3 WITH COVID-19 still impacting flights, 2. Deal in facts — Build an understanding of the realities of the situation. For example, you can’t businesses need to work together with other exporters and freight forwarders to consolidate loads. land very large planes in Hobart (due to restrictions around the capacity of the tarmac, loading equipment etc), so chartering a large plane to Hobart to move Tasmanian produce internationally is not likely. Consider new options for how you could get your goods where they need to go. IFAM is always open to hearing your ideas but be realistic about what For example, are there insufficiencies in your supply chain? Can you re-negotiate third-party contracts? Change your packaging? Export by sea rather than air? Use this breathing space to plan for your longterm financial profitability. can be achieved. IFAM is working across all 3. Plan — Businesses must levels of government to do extensive planning now more than ever. With flight numbers down approximately 80 per cent from last year Air travel is unlikely to return to pre-COVID conditions until 2024. provide information on support options to help businesses modify supply chains and explore other freight solutions. For more and freight capacity filling information on business up weeks in advance, it is support options from the no longer feasible to book freight on the same day you’re Australian Government, visit business.gov.au. intending to ship. Businesses need to be forward planning their freight movements and business operations. Vegetable export trade update January to September 2020 4. Adjust and evolve — Use this time to adjust, look at the structure of your business, your product and your supply chains. Australia’s vegetable exports have seen a moderate decline over the period from January to September 2020 (see Table 1).
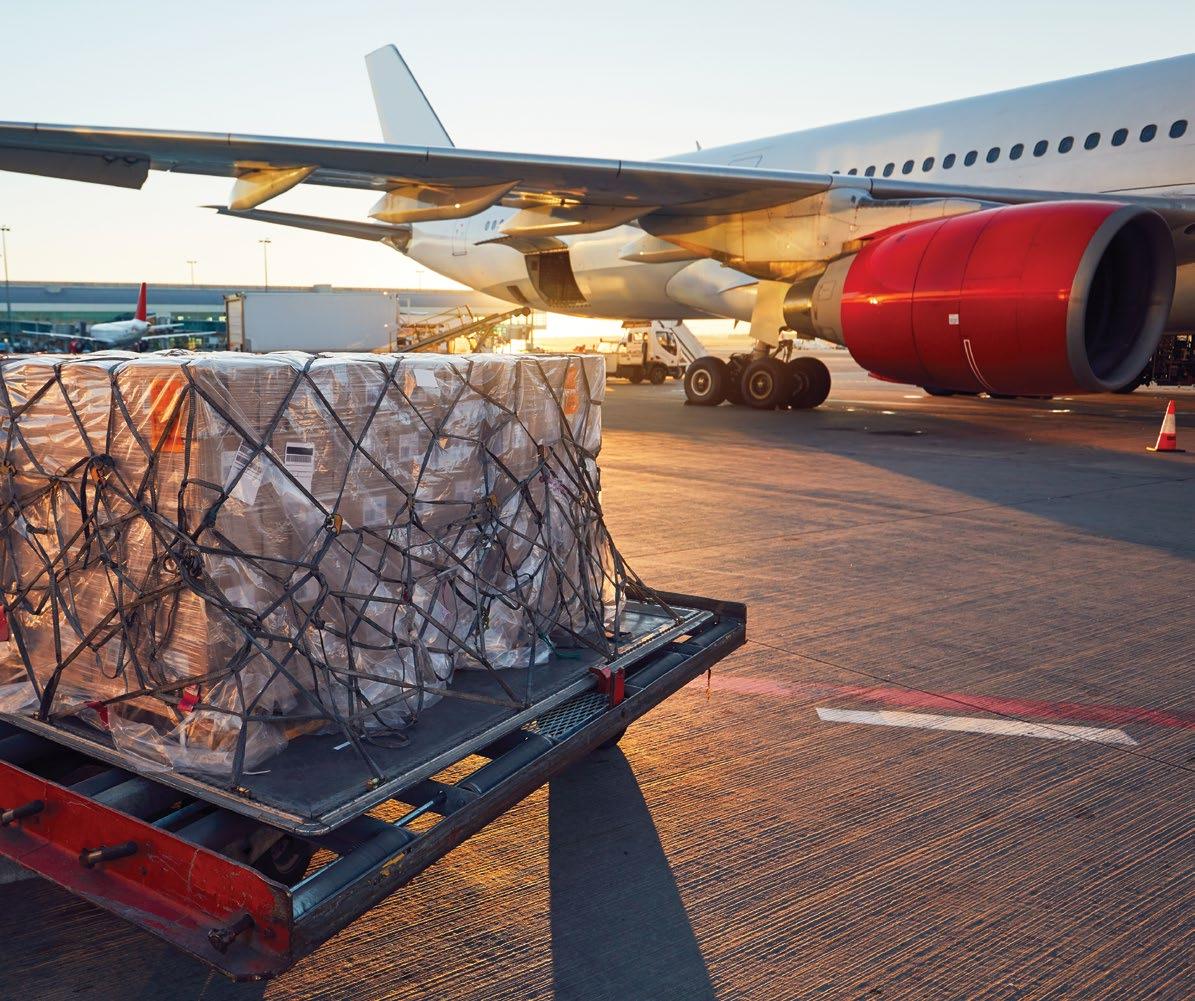
TABLE 1. CHANGE IN VEGETABLE EXPORTS BY DESTINATION MARKET JANUARY TO SEPTEMBER 2019–20
Trade partner World Singapore United Arab Emirates Malaysia Hong Kong Saudi Arabia Qatar Thailand Japan Korea, South Taiwan New Zealand 2019
Source: Global Trade Atlas
AUD
212,146,514
36,572,223 24,293,426 19,662,164 14,304,049 15,616,373 8,979,469 13,571,924 8,625,982 11,093,020 7,422,200 9,945,232 Volume (t)
193,432
21,524 33,122 19,003 7,973 16,211 9,574 13,202 5,354 17,204 7,184 2,500 2020
Value (AUD)
198,799,711
38,988,760 24,989,845 20,451,334 14,347,687 13,183,646 9,505,615 9,441,539 8,972,737 8,782,722 6,887,836 6,648,072 Volume (t)
175,036
22,053 26,623 18,838 7,802 14,621 9,494 9,999 2,733 13,340 8,037 1,445 ▲ 19–20
Value (AUD)
-6.3%
6.6% 2.9% 4.0% 0.3% -15.6% 5.9% -30.4% 4.0% -20.8% -7.2% -33.2% Volume (t)
-9.5%
2.5% -19.6% -0.9% -2.1% -9.8% -0.8% -24.3% -49.0% -22.5% 11.9% -42.2%
Based on data from the Global Trade Atlas, there was a 6.3 per cent decrease in total vegetable export value, down from $212.1 million to $198.8 million. Vegetable export volumes also declined by 9.5 per cent, from 193,432 tonnes to 175,036 tonnes over the same period. The top four markets for fresh vegetable exports — Singapore, The United Arab Emirates (UAE), Malaysia and Hong Kong — have all seen an increase in trade value during 2020. Demand in Singapore remained strong for Australian fresh vegetables and is the only trading partner that recorded a positive increase in both export value and volume in this period. Export value increased by 6.6 per cent from January to September 2020, from $36.6 million to $38.9 million; export volume improved by 2.5 per cent from 21,524 tonnes to 22,053 tonnes. The UAE saw growth of 2.9 per cent in value but a significant decline in volume of 19.6 per cent. Malaysia recorded a 4.0 per cent rise in export value and a slight dip of 0.9 per cent in tonnage. Thailand and South Korea have seen a decline in trade with an average drop of 27.3 per cent in both value and volume for Thailand and an average drop of 21.6 per cent in South Korea.
WA fresh vegetable exports by crop
Over the first three quarters of 2020, sea freighted vegetables have performed better than exports of more perishable crops (see Table 2).
TABLE 2. WESTERN AUSTRALIAN VEGETABLE EXPORTS BY CROP JANUARY TO SEPTEMBER 2019–20
2019
Product Value (AUD) Volume (t) Value (AUD)
Carrots Potatoes Onions Celery Brassicas Pumpkins Lettuce Other vegetables 60,946,991 9,146,871 9,029,624 2,554,869 1,926,243 960,325 840,370 1,487,888 71,468 6,227 10,570 1,978 1,103 727 348 608 62,168,684 8,493,435 5,873,912 3,023,773 1,883,218 892,459 714,730 895,549
* Vegetable Export Trade Update Jan-Sep 2020 reproduced with permission from AUSVEG. Data from Global Trade Atlas
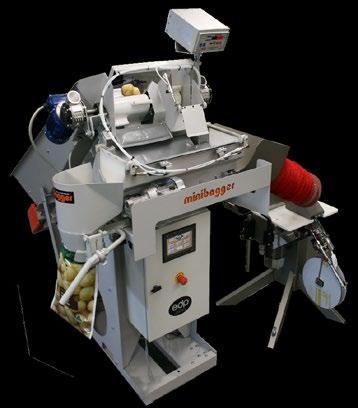
Source: Global Trade Atlas Volumes of carrots remained relatively stable with carrot export value increasing by 2 per cent from $60.9 million for the same period in 2019 to $62.2 million. The volume and value of onion exports from WA fell significantly compared to 2019 however this is most likely related to global supply and therefore prices returning to more normal levels rather than an impact of COVID-19 in 2020. minibagger RB prepack bagger 2020 There was a worldwide shortage of onions in 2019 which drove up onion exports from WA and pushed prices significantly higher compared to those in 2018. The volume of brassica crops exported from WA was down by more than 30 per cent, which is likely to have been caused by a combination of increased domestic demand, particularly from eastern Australia, and reduced air freight exports of these products. Volume (t) 70,938 6,924 7,180 2,306 763 829 290 366 ▲ 19–20
Value (AUD) 2% -7% -35% 18% -2% -7% -15% -40%
-1% 11% -32% 17% -31% 14% -17% -40%
MORE INFORMATION
For more information on any of the activities in the article or to discuss export opportunities please contact Manus Stockdale on 0448 897 652 or email
manus.stockdale@vegetableswa.com.au
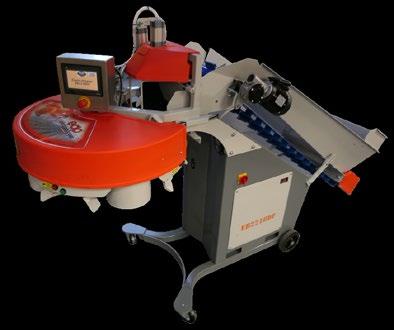
Sold over 2500 units World wide
a range of stocked edp manufactured machines.
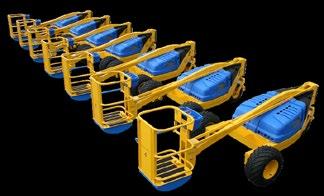
Powerwate Powerladder Series 4
Volume (t)
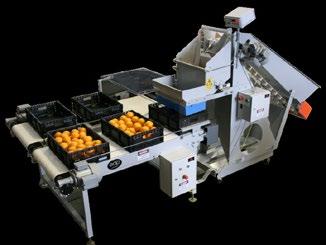
minibagger RPC auto filler
www.edp.com.au email: sales@edp.com.au
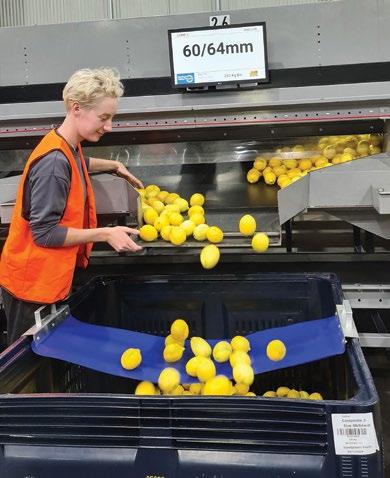
STATE OF THE art packing facility Northern Valley Packers continues to innovate and refine its process in collaboration with BON, further enhancing its productivity and competitive position. When Northern Valley Packers was established in 2017, the facility was built with a commitment to innovation and excellence. This included some of the most advanced sorting software and automation equipment. Three years on, Northern Valley Packers continue to seek ways to refine their operation, maximising their efficiency and competitive offering to West Australian growers. Working closely with electrical, water and automation solutions specialists, BON, Northern Valley Packers recently implemented a centralised information distribution system streamlining the updating of sizing and grading information displayed at each packing station. Prior to the implementation of a central distribution portal, each packing station was updated with size and grading information manually. This involved the floor Operations Manager manually writing on an individual white board at each of the 26 packing stations. Depending on the packing schedule, each station could require multiple updates throughout the course of a day. Northern Valley Packers, Operations Manager, Michael Kay, said the manual updating of information at every drop point was a time-consuming task and allowed room for errors. “Anything that improves efficiency and productivity helps Northern Valley Packers provide a competitive service for all its clients and enables us to compete strongly in the markets we supply our citrus to,” Michael said. With a clear understanding of the pain point the manual process was creating, BON Technical Director, Ben Bonomi, set about designing a concept that would allow for a centralised automated updating system. “We have been fortunate to have a long-term relationship with Northern Valley Packers and the Kay family. This
has evolved from many years of providing ongoing support,” said Ben. “I could see how the manual updating of the white boards was arduous and thought this could be improved.” “The first step in our process was to determine exactly what information needed to be conveyed at the packing station. The data on each screen was individualised to fill a specific order, allowing each packing station to work to a different packing order at any given time.” Working with BON’s software development partners, BON was able to create a user-friendly program that could easily capture and distribute the information from the pack line control box to a screen at a pack station. This included a picture of the required carton/crate, making it easier for the packers to identify what carton or crate they needed to be packing into.
Whilst working through the software development, BON set about installing the screens and associated control cabling at each packing station. The installation was coordinated around Northern Valley
Packers schedule as the line could not be halted to allow for installation works to take place. “Our team worked weekends and evening shifts to ensure we did not disrupt the packing schedule,” said Ben.
Since completing the project,
Michael has reported a significant improvement in productivity as a result of the new screens and software. “With regular product changes throughout the day, the ability to change the information at each screen on every drop point, and from the control station, has been a huge time saving and increased productivity,” said Michael. “Information on the screens included fruit variety, class, size (in either count or millimetres) and required package type. Accuracy in all these factors was really important for data integrity further along the packing process,” he said. “Working collaboratively with BON during the setup stage made commissioning and introducing the new process trouble free.”


