

Market Intelligence FEBRUARY 2023 ATLANTA Velocity Real Estate 20 23
Who would have predicted that a worldwide health pandemic would lead to a white-hot real estate market in the US? Probably no one, but it happened As we welcome 2023, we can say the white-hot market has passed
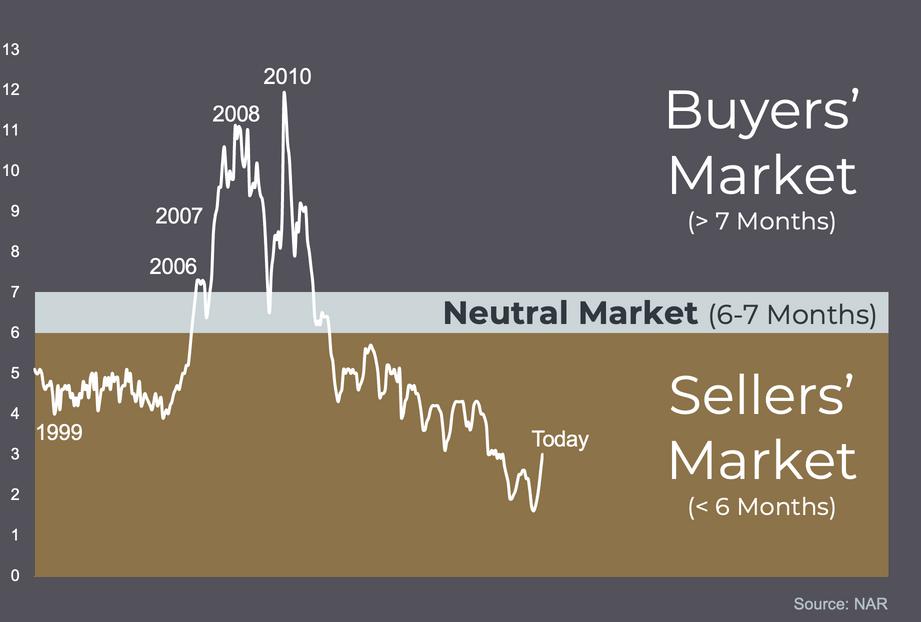
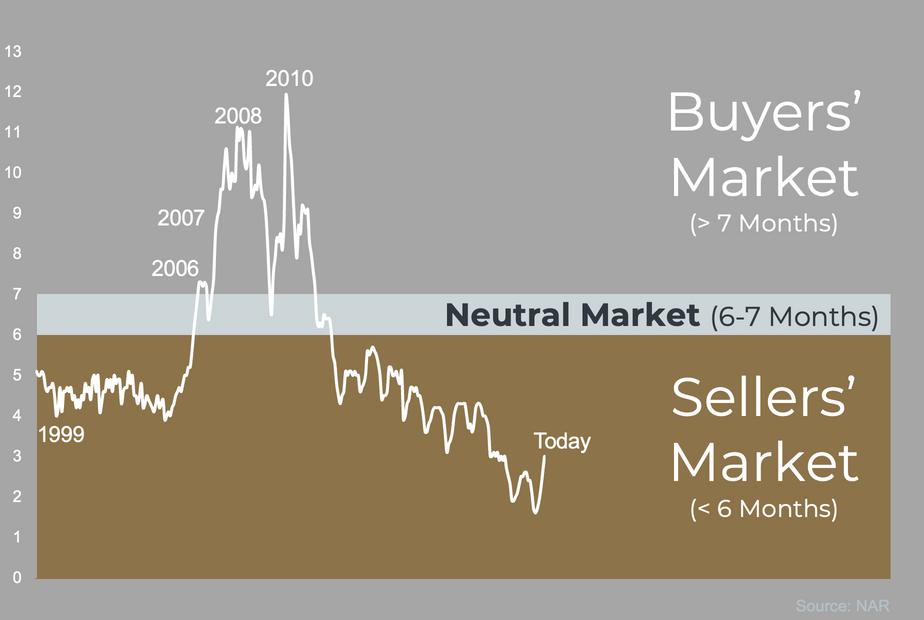
The buzzword for 2022 was INFLATION! It caused the pendulum to swing in the other direction as we saw the Fed manipulate rates to control it The Fed's response to increasing interest rates slowed down buyer demand. However, per the months of supply metric, we are still not in a buyer's market yet for the following reasons:
1) stabilizing new norms on interest rates
2) reduced inventory across most submarkets
3) historically low foreclosure numbers, and
4) a good job market
With these factors in play, we are in a market that has put price increases in check and allows buyers to ask for reasonable concessions
In short, whether you are buying a primary residence, a second home, or an investment property, you will be working in a SHIFTING MARKET This means that information will be critical to your decision-making We are sharing the stats on the market from the last quarter of 2022 in the areas we work most frequently
Use these numbers to guide your thoughts if a real estate purchase is in your future over the next six months. We would like to be the trusted advisor who assists you in the sale or purchase of real estate in Atlanta

We look forward to putting our years of experience and ability to read the numbers to work for you!
Itanza Sewell Managing Broker
Itanza Sewell
Office: 678-278-9798
Velocity Real Estate LLC VELOCITY-RE.COM

YEAR END MARKET INTELLIGENCE REPORT
VELOCITY REAL ESTATE
Discover your place to call home.
ALPHARETTACANTONCASCADE HEIGHTSCUMMINGDUNWOODYHOLLY SPRINGSMILTONNORTH BUCKHEADROSWELLSANDY SPRINGSWOODSTOCKRIVERDALE UNION CITY FAYETTEVILLE PEACHTREE CITY VELOCITY REAL ESTATE Table
Contents MARKET ACTIVITY Sources: FMLS (First Multiple Listing Services) and Realtors Property Resource® LLC. Most recent twelve months through February 2023. Data deemed reliable but not guaranteed
of
Inventory and Months' Supply
The indicator of inventory levels (months' supply) is a measure of housing availability The higher inventory levels (Buyers' Market), the more homes there are on the market for sale, while lower inventory levels (Sellers' Market) mean you might have trouble finding what your heart desires.
VELOCITY REAL ESTATE
MARKET ACTIVITY
Market Snapshot
Average Sales Price $758,428(Detached)

1.2

Average Sales Price $485,151(Attached)
1.5
DETACHED HOMES - SOLD LAST SIX MONTHS (SELLERS' MARKET)
CATEGORY $0$188,999 $189,000$379,999 $380,000$574,999 $575,000 + AVG TOTALS ACTIVE LISTINGS 0 1 18 114 133 MONTHS OF SUPPLY - ,2 0.6 1.6 1.2 AVG DAYS ON MARKET - 25 30 31 31 AVG SALES PRICE - $339,641 $483,209 $926,146 $758,428 SIX MONTHS CLOSINGS 0 27 146 307 480 ANNUAL CLOSINGS 0 52 382 926 1360
MARKET INTELLIGENCE REPORT Market Intelligence | Page 6
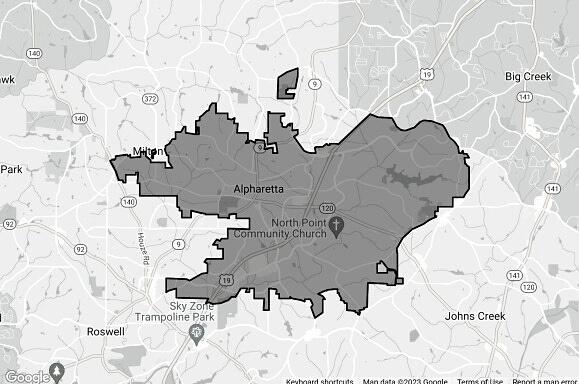
ALPHARETTA
MONTHS
DETACHED
OF SUPPLY
OF SUPPLY ATTACHED
MONTHS
ATTACHED HOMES - SOLD LAST SIX MONTHS (SELLERS' MARKET)
EACH DATA POINT BELOW IS ONE MONTH OF ACTIVITY (ALL PROPERTY TYPES)
INTELLIGENCE REPORT CATEGORY $0$188,999 $189,000$379,999 $380,000$574,999 $575,000 + AVG TOTALS ACTIVE LISTINGS 0 4 24 46 74 MONTHS OF SUPPLY - 0.2 1.2 4 1.5 AVG DAYS ON MARKET 5 24 30 36 29 AVG. SALES PRICE $185,000 $309,207 $462,321 $825,631 $485,151 SIX MONTHS CLOSINGS 1 88 114 54 257 ANNUAL CLOSINGS 1 214 251 138 604 Market Intelligence | Page 7
ALPHARETTA MARKET
To List Price Ratio Cumulative DOM Price Per Sq Ft
New Listings Pending Sales 147
Sale
98.9% 52 $262
123
Market Snapshot
Average Sales Price $523,051(Detached)
1.8
Average Sales Price $349,087(Attached)
3.0
DETACHED HOMES - SOLD LAST SIX MONTHS (SELLERS' MARKET)
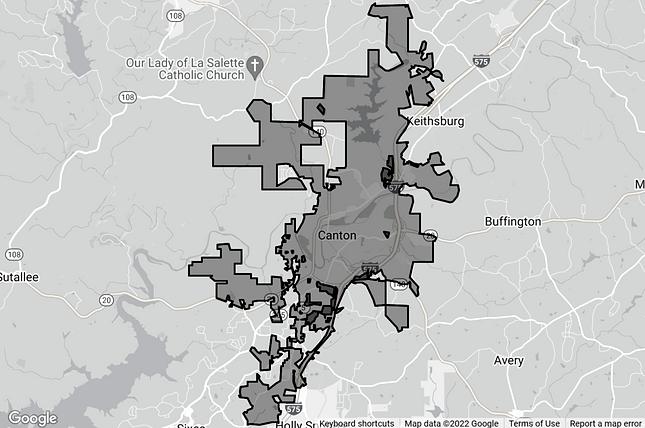
CATEGORY $0$228,999 $229,000$328,999 $329,000$452,999 $453,000 + AVG TOTALS ACTIVE LISTINGS 5 10 40 202 257 MONTHS OF SUPPLY 2.6 1 0.9 2.4 1.8 AVG. DAYS ON MARKET 44 57 37 37 39 AVG. SALES PRICE $181,962 $284,791 $394,010 $652,246 $523,051 SIX MONTHS CLOSINGS 13 59 241 382 695 ANNUAL CLOSINGS 27 126 604 1014 1771
MARKET INTELLIGENCE REPORT Market Intelligence | Page 6
CANTON
MONTHS
DETACHED MONTHS OF SUPPLY
OF SUPPLY ATTACHED
ATTACHED HOMES - SOLD LAST SIX MONTHS (SELLERS' MARKET)
EACH DATA POINT BELOW IS ONE MONTH OF ACTIVITY (ALL PROPERTY TYPES)
MARKET INTELLIGENCE REPORT CATEGORY $0$228,999 $229,000$328,999 $329,000$452,999 $453,000 + AVG TOTALS ACTIVE LISTINGS 0 2 8 17 27 MONTHS OF SUPPLY - 0.4 2.8 7 3.0 AVG. DAYS ON MARKET - 21 26 26 23 AVG. SALES PRICE - $291,223 $379,542 $540,514 $349,087 SIX MONTHS CLOSINGS 0 30 13 7 50 ANNUAL CLOSINGS 0 61 33 17 111 Market Intelligence | Page 7
CANTON
Sale To List Price Ratio Cumulative DOM Price Per Sq Ft
98.7% 60 $191 New Listings Pending Sales 147 125
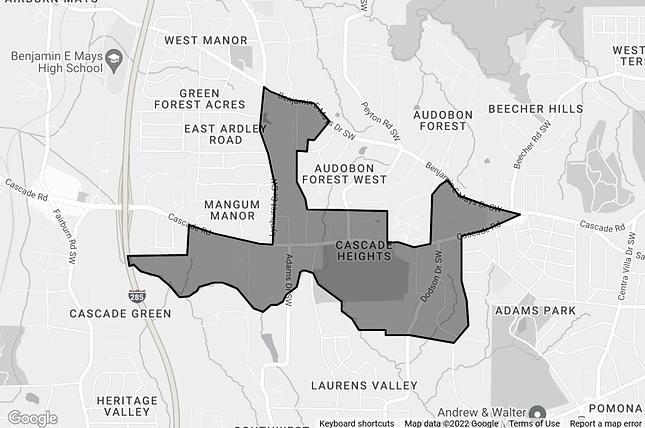
CASCADE HEIGHTS
Average Sales Price $400,000(Detached)
Average Sales Price $0 (Attached) 0
DETACHED HOMES - SOLD LAST SIX MONTHS (SELLERS' MARKET)
CATEGORY $0$98,999 $99,000$209,999 $210,000$288,999 $289,000 + AVG TOTALS ACTIVE LISTINGS 0 0 0 2 2 MONTHS OF SUPPLY 0 0 0 1.6 1.6 AVG. DAYS ON MARKET - - - 98 98 AVG. SALES PRICE - - - $400,000 $400,000 SIX MONTHS CLOSINGS 0 0 0 1 1 ANNUAL CLOSINGS 0 0 0 6 6
MARKET INTELLIGENCE REPORT Market Intelligence | Page 6
MONTHS
Market Snapshot DETACHED MONTHS OF SUPPLY
OF SUPPLY ATTACHED
1.6
CASCADE HEIGHTS
ATTACHED HOMES - SOLD LAST SIX MONTHS (SELLERS' MARKET)
EACH DATA POINT BELOW IS ONE MONTH OF ACTIVITY (ALL PROPERTY TYPES) Sale
MARKET INTELLIGENCE REPORT CATEGORY $0$98,999 $99,000$209,999 $210,000$288,999 $289,000 + AVG TOTALS ACTIVE LISTINGS 0 0 0 0 0 MONTHS OF SUPPLY - - - -AVG DAYS ON MARKET - - - -AVG SALES PRICE - - - -SIX MONTHS CLOSINGS 0 0 0 0 0 ANNUAL CLOSINGS 0 1 0 0 1 Market Intelligence | Page 7
To List Price Ratio Cumulative DOM Price Per Sq Ft -% - $New Listings Pending Sales 1 0
Market Snapshot
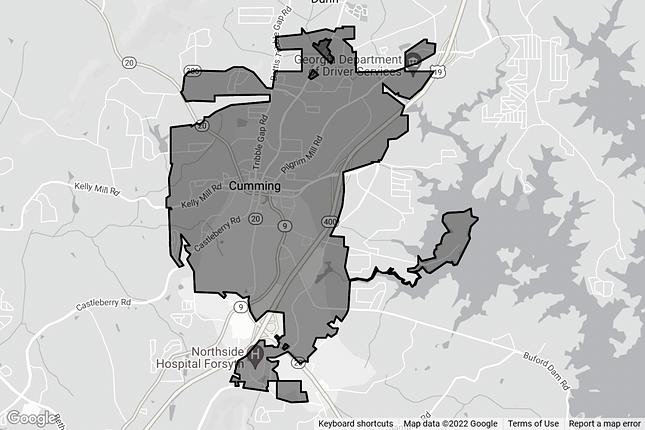
Average Sales Price $573,061(Detached)
1.2
1.8
DETACHED HOMES - SOLD LAST SIX MONTHS (SELLERS' MARKET)
CATEGORY $0$245,999 $246,000$353,999 $354,000$478,999 $479,000 + AVG TOTALS ACTIVE LISTINGS 4 18 30 203 255 MONTHS OF SUPPLY 17 12 07 14 12 AVG DAYS ON MARKET 47 29 31 32 31 AVG SALES PRICE $167,327 $306,427 $417,250 $683,414 $573,061 SIX MONTHS CLOSINGS 11 90 226 577 904 ANNUAL CLOSINGS 30 182 538 1805 2555
MARKET INTELLIGENCE REPORT Market Intelligence | Page 6
CUMMING
Average Sales Price $389,626(Attached)
MONTHS OF SUPPLY ATTACHED DETACHED MONTHS OF SUPPLY
CUMMING
ATTACHED HOMES - SOLD LAST SIX MONTHS (SELLERS' MARKET)
EACH DATA POINT BELOW IS ONE MONTH OF ACTIVITY (ALL PROPERTY TYPES)
MARKET INTELLIGENCE REPORT CATEGORY $0$245,999 $246,000$353,999 $354,000$478,999 $479,000 + AVG TOTALS ACTIVE LISTINGS 0 0 14 24 38 MONTHS OF SUPPLY - - 1.6 4.4 1.8 AVG DAYS ON MARKET - 26 31 21 27 AVG SALES PRICE - $310,785 $399,842.00 $533,079 $389,626 SIX MONTHS CLOSINGS 0 43 51 20 114 ANNUAL CLOSINGS 2 80 124 69 275 Market Intelligence | Page 7
Sale To List Price Ratio Cumulative DOM Price Per Sq Ft 98.1% 54 $198 New Listings Pending Sales 192 170
Market Snapshot
DETACHED HOMES - SOLD LAST SIX MONTHS (SELLERS' MARKET)
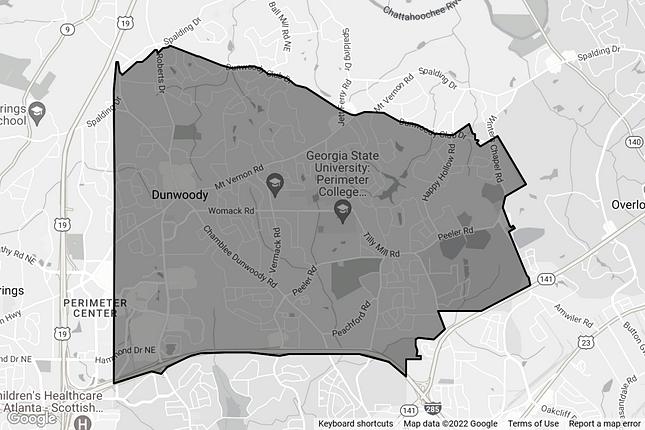
CATEGORY $0$311,999 $312,000$468,999 $469,000$574,999 $575,000 + AVG TOTALS ACTIVE LISTINGS 0 3 2 15 20 MONTHS OF SUPPLY - 21 03 08 08 AVG DAYS ON MARKET 3 22 32 23 25 AVG SALES PRICE $308,500 $403,336 $521,554 $735,725 $634,400 SIX MONTHS CLOSINGS 1 10 35 65 111 ANNUAL CLOSINGS 2 19 82 213 316
MARKET INTELLIGENCE REPORT Market Intelligence | Page 6 Average Sales Price $404,276(Attached) 0.7 MONTHS OF SUPPLY ATTACHED DETACHED MONTHS OF SUPPLY
Average
$634,400(Detached)
DUNWOODY
0.8
Sales Price
DUNWOODY
ATTACHED HOMES - SOLD LAST SIX MONTHS (SELLERS' MARKET)
EACH DATA POINT BELOW IS ONE MONTH OF ACTIVITY (ALL PROPERTY TYPES)
INTELLIGENCE REPORT CATEGORY $0$311,999 $312,000$468,999 $469,000$574,999 $575,000 + AVG TOTALS ACTIVE LISTINGS 3 1 1 2 7 MONTHS OF SUPPLY 1 0.2 0.6 0.9 0.7 AVG DAYS ON MARKET 22 29 28 25 26 AVG SALES PRICE $261,250 $378,322 $535,200 $659,083 $404,276 SIX MONTHS CLOSINGS 12 18 5 6 41 ANNUAL CLOSINGS 35 52 21 16 124 Market Intelligence | Page 7
MARKET
Sale To List Price Ratio Cumulative DOM Price Per Sq Ft 99.8%
New Listings Pending Sales 23
38 $230
35
HOLLY SPRINGS
Market Snapshot
Average Sales Price $498,873(Detached)
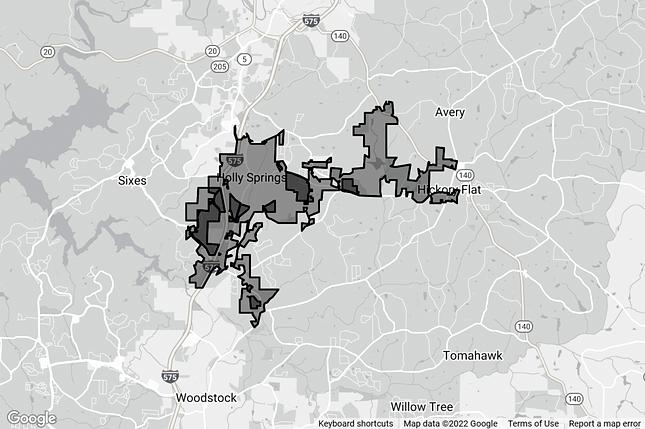
2.4
DETACHED MONTHS OF SUPPLY
Average Sales Price $363,000(Attached)
MONTHS OF SUPPLY ATTACHED
DETACHED HOMES - SOLD LAST SIX MONTHS (SELLERS' MARKET)
CATEGORY $0$311,999 $312,000$354,999 $355,000$413,999 $414,000 - + AVG TOTALS ACTIVE LISTINGS 0 0 0 6 6 MONTHS OF SUPPLY - - - 24 24 AVG. DAYS ON MARKET - 11 11 46 37 AVG SALES PRICE - $334,675 $400,078 $539,071 $498,873 SIX MONTHS CLOSINGS 0 1 2 9 12 ANNUAL CLOSINGS 0 1 4 32 37
MARKET INTELLIGENCE REPORT Market Intelligence | Page 6
HOLLY SPRINGS
ATTACHED HOMES - SOLD LAST SIX MONTHS (SELLERS' MARKET)
EACH DATA POINT BELOW IS ONE MONTH OF ACTIVITY (ALL PROPERTY TYPES)
Sale To List Price Ratio Cumulative DOM Price Per Sq Ft 99% 137 $131 New Listings Pending Sales 2 2
INTELLIGENCE REPORT CATEGORY $0$311,999 $312,000$354,999 $355,000$413,999 $414,000 - + AVG TOTALS ACTIVE LISTINGS 0 0 0 0 0 MONTHS OF SUPPLY - - - -AVG DAYS ON MARKET - - 10 - 10 AVG SALES PRICE - - $363,000 - $363,000 SIX MONTHS CLOSINGS 0 0 1 0 1 ANNUAL CLOSINGS 0 0 1 0 1 Market Intelligence | Page 7
MARKET
MILTON
Average Sales Price $1,313,192(Detached)
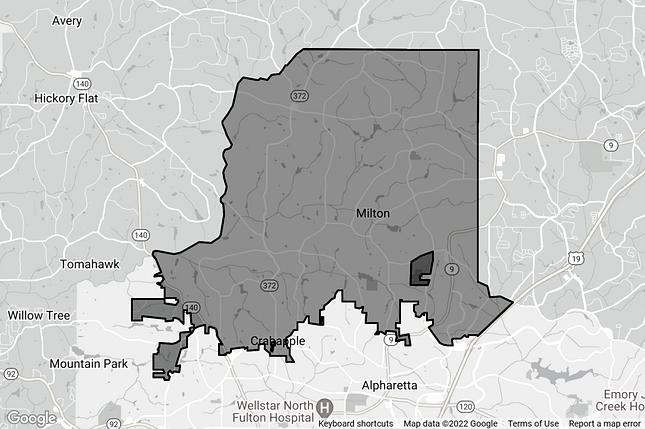
Average Sales Price $645,702(Attached)
MONTHS
OF SUPPLY ATTACHED
DETACHED HOMES - SOLD LAST SIX MONTHS (SELLERS' MARKET)
CATEGORY $0$477,999 $478,000$739,999 $740,000$1,024,999 $1,025,000 + AVG TOTALS ACTIVE LISTINGS 0 2 9 50 61 MONTHS OF SUPPLY - 08 14 32 24 AVG DAYS ON MARKET 17 39 40 32 34 AVG SALES PRICE $415,143 $647,650 $856,084 $1,764,880 $1,313,192 SIX MONTHS CLOSINGS 7 10 29 58 104 ANNUAL CLOSINGS 19 28 69 210 326
Market Snapshot MARKET INTELLIGENCE REPORT Market Intelligence | Page 6
DETACHED MONTHS OF
2.9
SUPPLY
2.4
ATTACHED HOMES - SOLD LAST SIX MONTHS (SELLERS' MARKET)
EACH DATA POINT BELOW IS ONE MONTH OF ACTIVITY (ALL PROPERTY TYPES)
98.6% 37 $275 New Listings Pending Sales 33 21
MARKET INTELLIGENCE REPORT CATEGORY $0$477,999 $478,000$739,999 $740,000$1,024,999 $1,025,000 + AVG TOTALS ACTIVE LISTINGS 1 3 5 3 12 MONTHS OF SUPPLY 05 2 26 3 29 AVG DAYS ON MARKET 29 88 19 353 49 AVG SALES PRICE $347,156 $644,799 $811,774 $1,180,000 $645,702 SIX MONTHS CLOSINGS 9 7 13 1 30 ANNUAL CLOSINGS 26 14 21 2 63 Market Intelligence | Page 7
MILTON
Cumulative DOM Price
Sq Ft
Sale To List Price Ratio
Per
NORTH BUCKHEAD
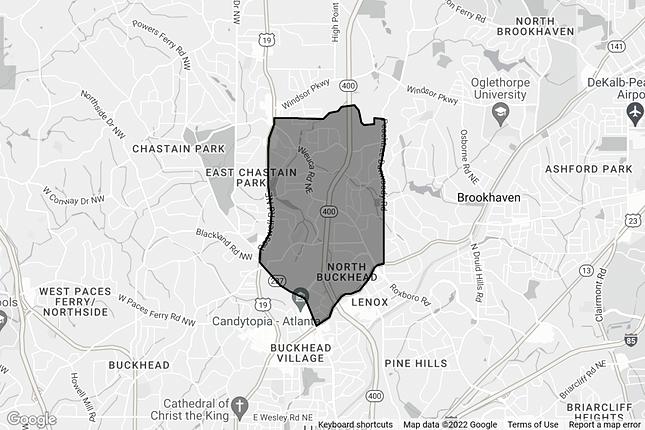
Average Sales Price $1,461,026(Detached)
1.3
DETACHED MONTHS OF SUPPLY
Average Sales Price $587,699(Attached)
3.1 MONTHS OF SUPPLY ATTACHED
DETACHED HOMES - SOLD LAST SIX MONTHS (SELLERS' MARKET)
CATEGORY $0 - $81,999 $82,000$344,999 $345,00$714,999 $715,00 + AVG TOTALS ACTIVE LISTINGS 0 0 0 10 10 MONTHS OF SUPPLY - - - 1.4 1.3 AVG DAYS ON MARKET - - 23 36 34 AVG SALES PRICE - - $634,800 1,614,031 $1,461,026 SIX MONTHS CLOSINGS 0 0 5 27 32 ANNUAL CLOSINGS 0 0 10 90 100
Market Snapshot MARKET INTELLIGENCE REPORT Market Intelligence | Page 6
NORTH BUCKHEAD
ATTACHED HOMES - SOLD LAST SIX MONTHS (SELLERS' MARKET)
EACH DATA POINT BELOW IS ONE MONTH OF ACTIVITY (ALL PROPERTY TYPES)
Sale To List Price Ratio Cumulative DOM Price Per Sq Ft 97.2% 97 $359 New Listings Pending Sales 30 19
MARKET INTELLIGENCE REPORT CATEGORY $0 - $81,999 $82,000$344,999 $345,00$714,999 $715,00 + AVG TOTALS ACTIVE LISTINGS 0 10 21 20 51 MONTHS OF SUPPLY - 17 28 6 31 AVG DAYS ON MARKET - 42 35 73 45 AVG SALES PRICE - $286,687 $446,646 $1,282,231 $587,699 SIX MONTHS CLOSINGS 0 15 32 13 60 ANNUAL CLOSINGS 0 72 103 43 218 Market Intelligence | Page 7
ROSWELL
Average Sales Price $692,989(Detached)
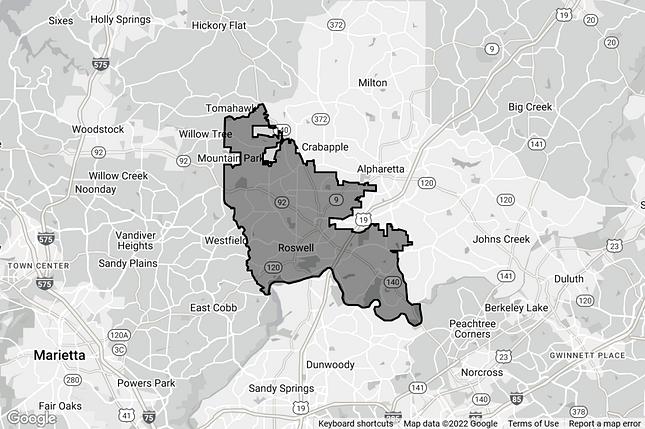
0.8 MONTHS OF SUPPLY ATTACHED DETACHED MONTHS OF SUPPLY
Average Sales Price $457,593(Attached)
DETACHED HOMES - SOLD LAST SIX MONTHS (SELLERS' MARKET)
CATEGORY $0$298,999 $299,000$414,999 $415,000$549,999 $550,000 + AVG TOTALS ACTIVE LISTINGS 0 3 12 74 89 MONTHS OF SUPPLY - 06 05 14 10 AVG DAYS ON MARKET 22 31 30 29 29 AVG SALES PRICE $295,000 $377,816 $480,662 $844,168 $692,989 SIX MONTHS CLOSINGS 2 36 108 232 378 ANNUAL CLOSINGS 4 71 300 681 1,056
Market Snapshot MARKET INTELLIGENCE REPORT Market Intelligence | Page 6
1.0
ROSWELL
ATTACHED HOMES - SOLD LAST SIX MONTHS (SELLERS' MARKET)
EACH DATA POINT BELOW IS ONE MONTH OF ACTIVITY (ALL PROPERTY TYPES) Sale To List
MARKET INTELLIGENCE REPORT CATEGORY $0$298,999 $299,000$414,999 $415,000$549,999 $550,000 + AVG TOTALS ACTIVE LISTINGS 4 2 2 12 20 MONTHS OF SUPPLY 0.6 0.4 0.3 1.5 0.8 AVG DAYS ON MARKET 17 24 38 25 25 AVG SALES PRICE $245,758 $360,039 $477,128 $707,360 $457,593 SIX MONTHS CLOSINGS 40 19 30 39 128 ANNUAL CLOSINGS 85 63 78 115 341 Market Intelligence | Page 7
Cumulative DOM Price Per Sq Ft
New Listings Pending Sales 79 77
Price Ratio
98.6% 47 $223
SANDY SPRINGS
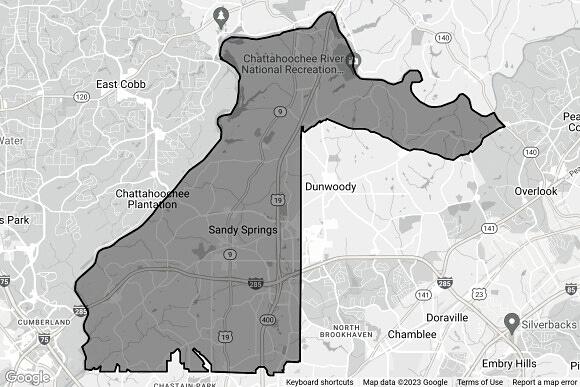
Average Sales Price $1,171,268(Detached)
1.8
DETACHED MONTHS OF SUPPLY
Average Sales Price $346,187(Attached)
1.5 MONTHS OF SUPPLY ATTACHED
DETACHED HOMES - SOLD LAST SIX MONTHS (SELLERS' MARKET)
CATEGORY 0 - $167,999 $168,000$474,999 $475,000$714,999 $715,000 + AVG TOTALS ACTIVE LISTINGS 0 0 9 53 62 MONTHS OF SUPPLY - - 1 2.1 1.8 AVG. DAYS ON MARKET - 56 45 43 44 AVG. SALES PRICE - $409,967 $600,579 $1,423,204 $1,171,268 SIX MONTHS CLOSINGS 0 3 45 111 159 ANNUAL CLOSINGS 0 7 109 308 424
Market Snapshot MARKET INTELLIGENCE REPORT Market Intelligence | Page 6
SANDY SPRINGS
ATTACHED HOMES - SOLD LAST SIX MONTHS (SELLERS' MARKET)
EACH DATA POINT BELOW IS ONE MONTH OF ACTIVITY (ALL PROPERTY TYPES)
CATEGORY 0 - $167,999 $168,000$474,999 $475,000$714,999 $715,000 + AVG TOTALS ACTIVE LISTINGS 8 31 11 4 54 MONTHS OF SUPPLY 2 1.2 2.4 1.8 1.5 AVG DAYS ON MARKET 40 19 31 30 25 AVG SALES PRICE $136,270 $278,860 $589,569 $881,189 $346,187 SIX MONTHS CLOSINGS 27 129 26 15 197 ANNUAL CLOSINGS 54 317 86 28 485 Market Intelligence | Page 7
MARKET INTELLIGENCE REPORT
Sale To List Price Ratio Cumulative DOM Price Per Sq Ft 98.4% 56 $236 New Listings Pending Sales 72 48
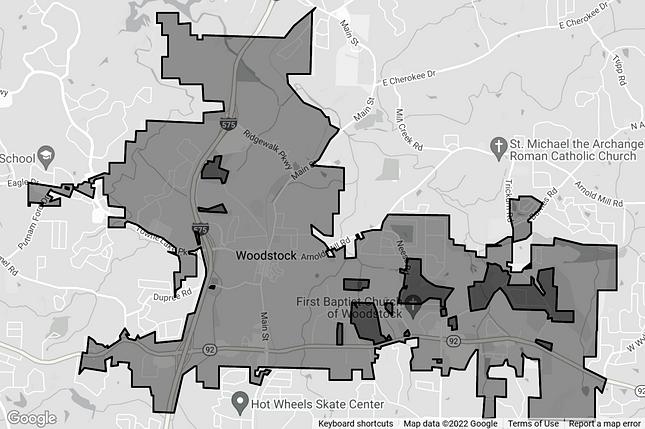
WOODSTOCK
Market Snapshot
Sales Price
Average Sales Price $421,840(Attached) 2.3
DETACHED HOMES - SOLD LAST SIX MONTHS (SELLERS' MARKET)
CATEGORY $0$214,999 $215,000$298,999 $299,000$408,999 $409,000 + AVG TOTALS ACTIVE LISTINGS 0 3 34 107 147 MONTHS OF SUPPLY - 0.6 0.8 1.6 1.3+ AVG. DAYS ON MARKET 79 27 38 34 35 AVG. SALES PRICE $211,000 $271,066 $358,053 $561,423 $457,204 SIX MONTHS CLOSINGS 1 38 231 290 560 ANNUAL CLOSINGS 1 72 516 810 1399
MONTHS OF SUPPLY ATTACHED DETACHED MONTHS OF SUPPLY
1.3 Average
$457,204(Detached)
MARKET INTELLIGENCE REPORT Market Intelligence | Page 6
WOODSTOCK
ATTACHED HOMES - SOLD LAST SIX MONTHS (SELLERS' MARKET)
EACH DATA POINT BELOW IS ONE MONTH OF ACTIVITY (ALL PROPERTY TYPES)
MARKET INTELLIGENCE REPORT CATEGORY $0$214,999 $215,000$298,999 $299,000$408,999 $409,000 + AVG TOTALS ACTIVE LISTINGS 1 1 14 43 59 MONTHS OF SUPPLY 1 0.7 1.3 3.1 2.3+ AVG DAYS ON MARKET 7 20 30 40 35 AVG SALES PRICE $201,000 $273,933 $363,905 $481,744 $421,840 SIX MONTHS CLOSINGS 1 9 58 82 150 ANNUAL CLOSINGS 1 21 131 185 338 Market Intelligence | Page 7
Sale To List Price Ratio Cumulative DOM Price Per Sq Ft 98.5% 54 $200 New Listings Pending Sales 115 105
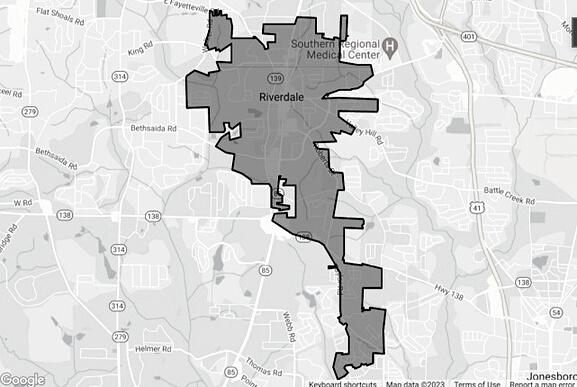
Market Snapshot
DETACHED HOMES - SOLD LAST SIX MONTHS (SELLERS' MARKET)
CATEGORY $0 -$84,999 $85,000$135,999 $136,000$179,999 $180,000 + AVG TOTALS ACTIVE LISTINGS 0 1 2 52 57 MONTHS OF SUPPLY - 0.7 0.7 2.1 2.0+ AVG. DAYS ON MARKET 11 15 21 27 26 AVG. SALES PRICE $82,000 $110,333 $161,764 $262,897 $249,469 SIX MONTHS CLOSINGS 1 3 14 135 153 ANNUAL CLOSINGS 2 9 25 305 341
MONTHS OF SUPPLY ATTACHED DETACHED MONTHS OF SUPPLY
MARKET INTELLIGENCE REPORT Market Intelligence | Page 6
Average Sales Price $188,358(Attached) 2.0
2.0 Average Sales Price $249,469(Detached) RIVERDALE
RIVERDALE
ATTACHED HOMES - SOLD LAST SIX MONTHS (SELLERS' MARKET)
EACH DATA POINT BELOW IS ONE MONTH OF ACTIVITY (ALL PROPERTY TYPES)
99.5% 24 $146 New Listings Pending Sales 36 24
MARKET INTELLIGENCE REPORT CATEGORY $0 -$84,999 $85,000$135,999 $136,000$179,999 $180,000 + AVG TOTALS ACTIVE LISTINGS 0 3 1 7 12 MONTHS OF SUPPLY - 3 0.5 1.8 2.0 AVG DAYS ON MARKET 19 7 22 11 13 AVG SALES PRICE $61,750 $122,000 $165,643 $204,385 $188,358 SIX MONTHS CLOSINGS 2 2 7 34 45 ANNUAL CLOSINGS 3 3 22 48 76 Market Intelligence | Page 7
To List Price Ratio Cumulative DOM Price Per Sq Ft
Sale
UNION CITY
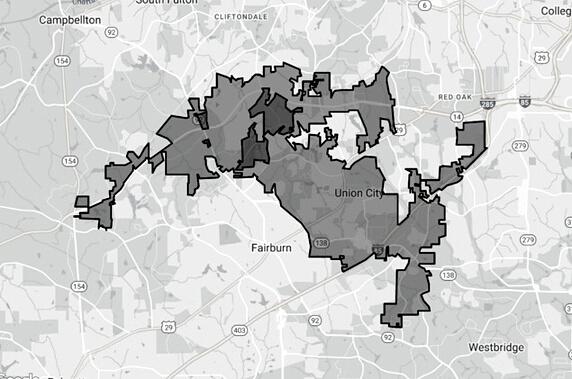
Market Snapshot
Average Sales Price $292,644(Detached)
Average Sales Price $177,598(Attached)
1.6
DETACHED HOMES - SOLD LAST SIX MONTHS (SELLERS' MARKET)
CATEGORY $0$214,999 $215,000$298,999 $299,000$408,999 $409,000 + AVG TOTALS ACTIVE LISTINGS 0 0 1 20 21 MONTHS OF SUPPLY - - 08 17 16 AVG DAYS ON MARKET - 14 9 27 25 AVG SALES PRICE - $83,750 $148,500 $309,172 $292,644 SIX MONTHS CLOSINGS 0 4 2 68 74 ANNUAL CLOSINGS 0 8 8 143 159
MONTHS OF SUPPLY ATTACHED DETACHED MONTHS OF SUPPLY
1.6
MARKET INTELLIGENCE REPORT Market Intelligence | Page 6
UNION CITY
ATTACHED HOMES - SOLD LAST SIX MONTHS (SELLERS' MARKET)
EACH DATA POINT BELOW IS ONE MONTH OF ACTIVITY (ALL PROPERTY TYPES)
MARKET INTELLIGENCE REPORT CATEGORY $0$214,999 $215,000$298,999 $299,000$408,999 $409,000 + AVG TOTALS ACTIVE LISTINGS 0 8 3 3 14 MONTHS OF SUPPLY - 2.9 1.2 0.7 1.6 AVG DAYS ON MARKET 37 26 20 17 21 AVG SALES PRICE $47,000 $103,269 $161,500 $231,094 $177,598 SIX MONTHS CLOSINGS 1 14 7 24 46 ANNUAL CLOSINGS 2 25 22 53 102 Market Intelligence | Page 7
Sale To List Price Ratio Cumulative DOM Price Per Sq Ft
New Listings
98.4% 24 $118
Pending Sales 24 19
FAYETTEVILLE
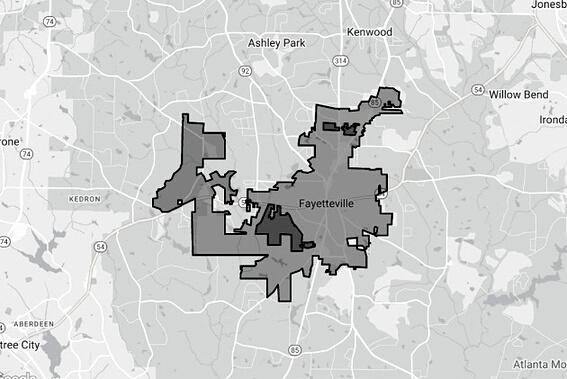
Market Snapshot
Average Sales Price $472,718(Detached)
2.3
Average Sales Price $371,180(Attached)
6.9
DETACHED HOMES - SOLD LAST SIX MONTHS (SELLERS' MARKET)
CATEGORY $0$214,999 $215,000$298,999 $299,000$408,999 $409,000 + AVG TOTALS ACTIVE LISTINGS 2 9 22 42 75 MONTHS OF SUPPLY 2 2 1.3 3.9 2.3 AVG. DAYS ON MARKET 29 39 28 30 31 AVG. SALES PRICE $157,500 $282,843 $385,611 $697,353 $472,718 SIX MONTHS CLOSINGS 1 34 77 60 172 ANNUAL CLOSINGS 3 77 190 129 399
MONTHS OF SUPPLY ATTACHED DETACHED MONTHS OF SUPPLY
MARKET INTELLIGENCE REPORT Market Intelligence | Page 6
FAYETTEVILLE
ATTACHED HOMES - SOLD LAST SIX MONTHS (SELLERS' MARKET)
EACH DATA POINT BELOW IS ONE MONTH OF ACTIVITY (ALL PROPERTY TYPES) Sale
MARKET INTELLIGENCE REPORT CATEGORY $0$214,999 $215,000$298,999 $299,000$408,999 $409,000 + AVG TOTALS ACTIVE LISTINGS 0 0 10 3 13 MONTHS OF SUPPLY - - 10 1.7 6.9 AVG DAYS ON MARKET 11 7 - 26 16 AVG SALES PRICE $137,000 $235,000 - $673,450 $371,180 SIX MONTHS CLOSINGS 2 1 0 2 5 ANNUAL CLOSINGS 4 3 1 9 17 Market Intelligence | Page 7
To List Price
Cumulative DOM Price Per Sq Ft
Ratio
97.2% 63 $172 New Listings Pending Sales 50 32
PEACHTREE CITY
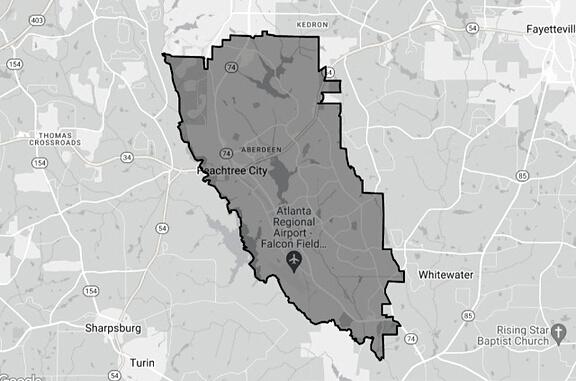
Market Snapshot
DETACHED HOMES - SOLD LAST SIX MONTHS (SELLERS' MARKET)
CATEGORY $0$214,999 $215,000$298,999 $299,000$408,999 $409,000 + AVG TOTALS ACTIVE LISTINGS 1 0 4 12 17 MONTHS OF SUPPLY 0.8 - 0.8 2.1 1.3 AVG. DAYS ON MARKET 9 23 41 32 34 AVG. SALES PRICE $246,567 $346,933 $489,744 $632,915 $528,986 SIX MONTHS CLOSINGS 3 9 32 36 80 ANNUAL CLOSINGS 5 22 83 62 172
MONTHS OF SUPPLY ATTACHED DETACHED MONTHS OF SUPPLY
Average Sales Price $288,300(Attached) 0.5
1.3 Average Sales Price $528,986(Detached)
MARKET INTELLIGENCE REPORT Market Intelligence | Page 6
PEACHTREE CITY
ATTACHED HOMES - SOLD LAST SIX MONTHS (SELLERS' MARKET)
EACH DATA POINT BELOW IS ONE MONTH OF ACTIVITY (ALL PROPERTY TYPES)
Sale To List Price Ratio
99.1% 24 $181 New Listings
Pending Sales 9 7
INTELLIGENCE REPORT CATEGORY $0$214,999 $215,000$298,999 $299,000$408,999 $409,000 + AVG TOTALS ACTIVE LISTINGS 0 1 0 0 1 MONTHS OF SUPPLY - 1 - - 5 AVG DAYS ON MARKET 12 - 3 - 9 AVG SALES PRICE $222,450 - $420,000 - $288,300 SIX MONTHS CLOSINGS 2 0 1 0 3 ANNUAL CLOSINGS 4 3 4 0 11 Market Intelligence | Page 7
MARKET
Cumulative DOM Price
Ft
Per Sq
Market Intelligence FEBRUARY 2023 Velocity Real Estate 20 23 ©Velocity Real Estate LLC. All rights reserved. The information in this document is believed to be reliable but cannot be guaranteed. The accuracy of this information should be independently verified. This market intelligence report is not an attempt to solicit your listing. Velocity Real Estate LLC fully supports the principles of the Fair Housing Act and the Equal Opportunity Act.
