

Market Intelligence JANUARY 2023 ATLANTA Velocity Real Estate 20 23
Who would have predicted that a worldwide health pandemic would lead to a white-hot real estate market in the US? Probably no one, but it happened As we welcome 2023, we can say the white-hot market has passed
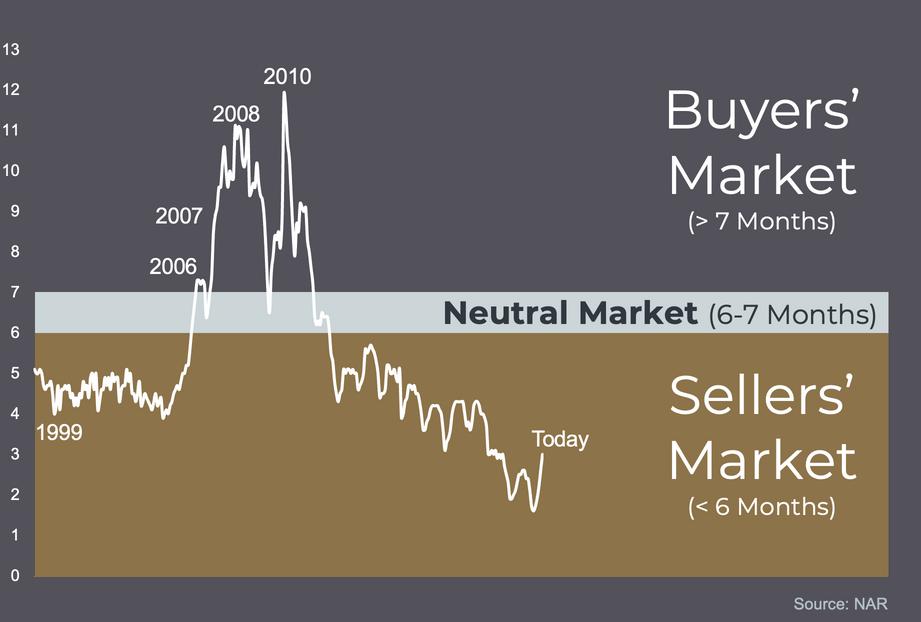
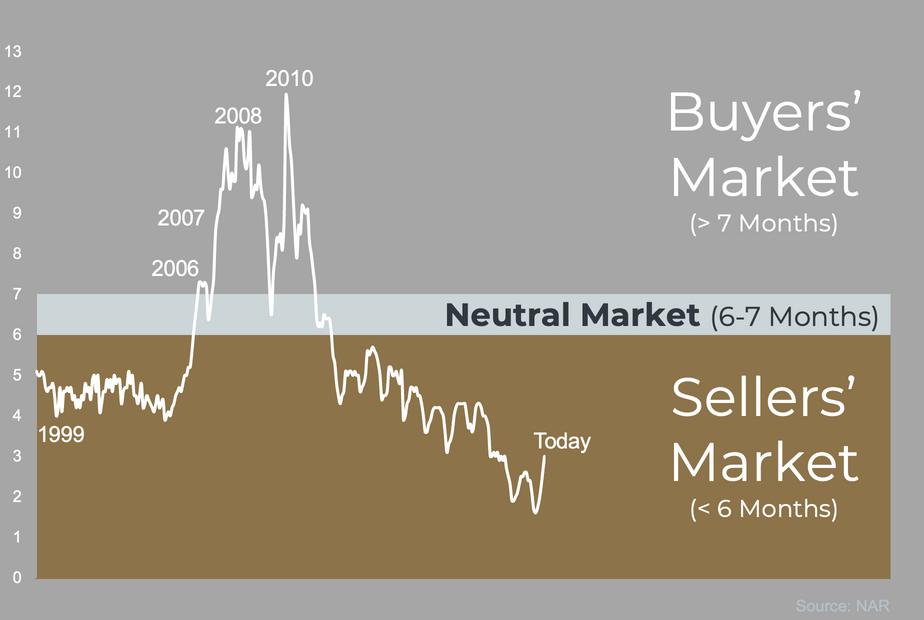
The buzzword for 2022 was INFLATION! It caused the pendulum to swing in the other direction as we saw the Fed manipulate rates to control it The Fed's response to increasing interest rates slowed down buyer demand. However, per the months of supply metric, we are still not in a buyer's market yet for the following reasons:
1) stabilizing new norms on interest rates
2) reduced inventory across most submarkets
3) historically low foreclosure numbers, and
4) a good job market
With these factors in play, we are in a market that has put price increases in check and allows buyers to ask for reasonable concessions
In short, whether you are buying a primary residence, a second home, or an investment property, you will be working in a SHIFTING MARKET This means that information will be critical to your decision-making We are sharing the stats on the market from the last quarter of 2022 in the areas we work most frequently
Use these numbers to guide your thoughts if a real estate purchase is in your future over the next six months. We would like to be the trusted advisor who assists you in the sale or purchase of real estate in Atlanta

We look forward to putting our years of experience and ability to read the numbers to work for you!
Itanza Sewell Managing Broker
Itanza Sewell
Office: 678-278-9798
Velocity Real Estate LLC VELOCITY-RE.COM

YEAR END MARKET INTELLIGENCE REPORT
VELOCITY REAL ESTATE
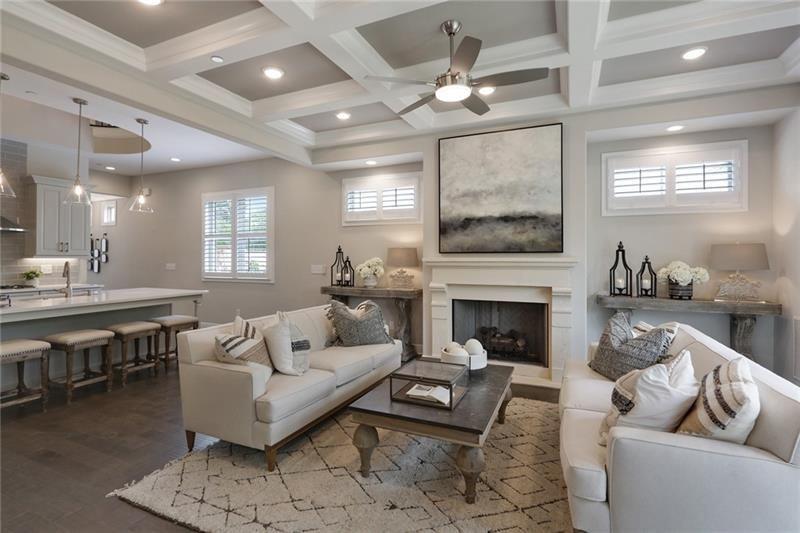
Discover your place to call home.
ALPHARETTACANTONCASCADE HEIGHTSCUMMING -
RIVERDALE
UNION CITY
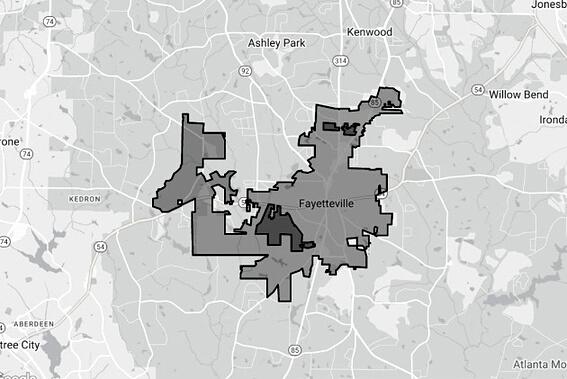
FAYETTEVILLE
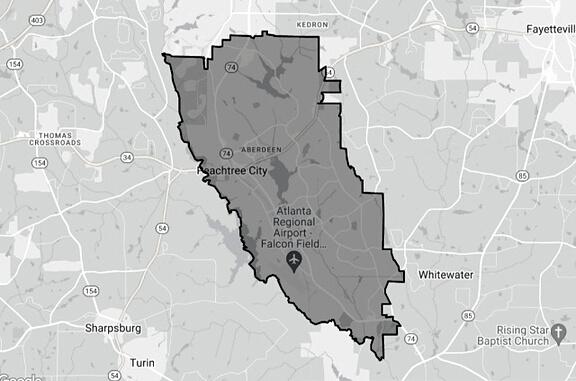
PEACHTREE CITY
Sources: FMLS (First Multiple Listing Services) and Realtors Property Resource® LLC.
Most recent twelve months through January 2023. Data deemed reliable but not guaranteed
DUNWOODYHOLLY SPRINGSMILTONNORTH BUCKHEADROSWELLSANDY SPRINGSWOODSTOCK -
VELOCITY REAL ESTATE
MARKET ACTIVITY
Table of Contents
Inventory and Months' Supply
The indicator of inventory levels (months' supply) is a measure of housing availability The higher inventory levels (Buyers' Market), the more homes there are on the market for sale, while lower inventory levels (Sellers' Market) mean you might have trouble finding what your heart desires.
VELOCITY REAL ESTATE
MARKET ACTIVITY
Market Snapshot
Average Sales Price $754,537(Detached)

1.4

Average Sales Price $494,220(Attached)
DETACHED HOMES - SOLD LAST SIX MONTHS (SELLERS' MARKET)
CATEGORY $0$188,999 $189,000$379,999 $380,000$574,999 $575,000 + AVG TOTALS ACTIVE LISTINGS 0 0 20 135 155 MONTHS OF SUPPLY - - 0.6 1.9 1.4 AVG. DAYS ON MARKET - 20 25 27 26 AVG. SALES PRICE - $334,807 $487,383 $907,505 $754,537 SIX MONTHS CLOSINGS 0 27 166 364 557 ANNUAL CLOSINGS 0 56 399 938 1393
MARKET INTELLIGENCE REPORT Market Intelligence | Page 6
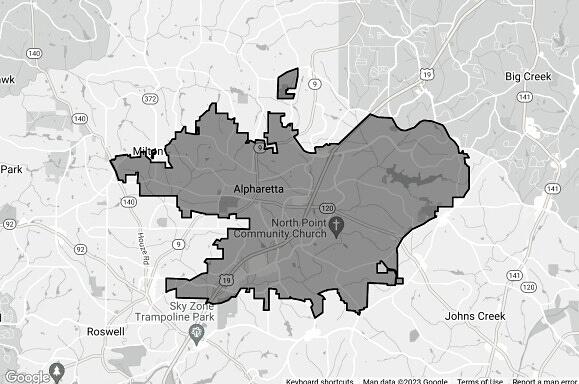
ALPHARETTA
1.5 MONTHS OF SUPPLY ATTACHED DETACHED MONTHS OF SUPPLY
ALPHARETTA
ATTACHED HOMES - SOLD LAST SIX MONTHS (SELLERS' MARKET)
EACH DATA POINT BELOW IS ONE MONTH OF ACTIVITY (ALL PROPERTY TYPES)
MARKET INTELLIGENCE REPORT CATEGORY $0$188,999 $189,000$379,999 $380,000$574,999 $575,000 + AVG TOTALS ACTIVE LISTINGS 0 4 26 45 75 MONTHS OF SUPPLY - 0.2 1.4 4.2 1.5 AVG DAYS ON MARKET 5 21 27 27 25 AVG SALES PRICE $185,000 $307,276 $461,426 $831,294 $494,220 SIX MONTHS CLOSINGS 1 82 109 57 249 ANNUAL CLOSINGS 1 206 251 133 591 Market Intelligence | Page 7
Sale To List Price Ratio Cumulative DOM Price Per Sq Ft
New Listings Pending Sales 115 91
97% 40 $235
Market Snapshot
Average Sales Price $530,307(Detached)
2.1
DETACHED MONTHS OF SUPPLY
Average Sales Price $332,670(Attached)
3.7 MONTHS OF SUPPLY ATTACHED
DETACHED HOMES - SOLD LAST SIX MONTHS (SELLERS' MARKET)
CATEGORY $0$228,999 $229,000$328,999 $329,000$452,999 $453,000 + AVG TOTALS ACTIVE LISTINGS 5 13 60 223 301 MONTHS OF SUPPLY 2.8 1.2 1.3 2.7 2.1 AVG. DAYS ON MARKET 59 50 30 33 34 AVG. SALES PRICE $180,800 $285,158 $393,491 $661,610 $530,307 SIX MONTHS CLOSINGS 11 59 261 405 736 ANNUAL CLOSINGS 25 129 628 1021 1803
MARKET INTELLIGENCE REPORT Market Intelligence | Page 6
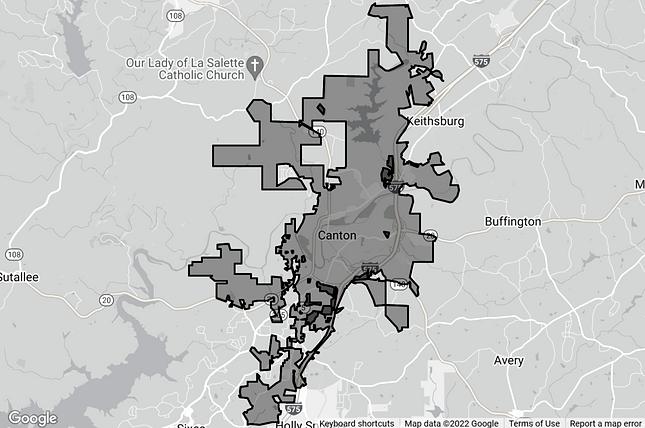
CANTON
CANTON
ATTACHED HOMES - SOLD LAST SIX MONTHS (SELLERS' MARKET)
EACH DATA POINT BELOW IS ONE MONTH OF ACTIVITY (ALL PROPERTY TYPES) Sale
96.8% 50 $192 New Listings Pending Sales 137 93
MARKET INTELLIGENCE REPORT CATEGORY $0$228,999 $229,000$328,999 $329,000$452,999 $453,000 + AVG TOTALS ACTIVE LISTINGS 0 3 9 20 32 MONTHS OF SUPPLY - 0.6 3.4 8.8 3.7 AVG DAYS ON MARKET - 15 27 44 21 AVG SALES PRICE - $288,067 $371,861 $595,817 $332,670 SIX MONTHS CLOSINGS 0 30 14 3 47 ANNUAL CLOSINGS 0 59 33 12 104 Market Intelligence | Page 7
Cumulative DOM Price Per Sq Ft
To List Price Ratio
Snapshot
Average Sales Price
0.8
DETACHED HOMES - SOLD LAST SIX MONTHS (SELLERS' MARKET)
CATEGORY $0$98,999 $99,000$209,999 $210,000$288,999 $289,000 + AVG TOTALS ACTIVE LISTINGS 0 0 0 1 1 MONTHS OF SUPPLY 0 0 0 0.8 0.8 AVG. DAYS ON MARKET - - - 54 54 AVG. SALES PRICE - - - $555,000 $555,000 SIX MONTHS CLOSINGS 0 0 0 2 2 ANNUAL CLOSINGS 0 0 0 7 7
MARKET INTELLIGENCE REPORT Market Intelligence | Page 6 Average
0 MONTHS OF SUPPLY ATTACHED DETACHED MONTHS OF SUPPLY
Market
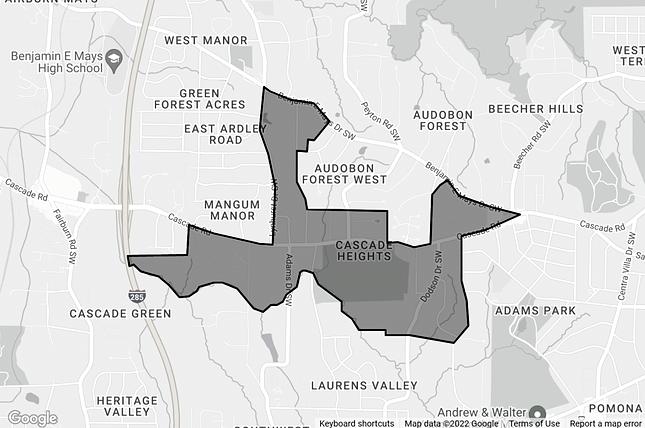
CASCADE HEIGHTS
Sales Price $0 (Attached)
$555,000(Detached)
CASCADE HEIGHTS
ATTACHED HOMES - SOLD LAST SIX MONTHS (SELLERS' MARKET)
EACH DATA POINT BELOW IS ONE MONTH OF ACTIVITY (ALL PROPERTY TYPES)
Sale To List Price Ratio Cumulative DOM Price Per Sq Ft -% - $ New Listings
MARKET INTELLIGENCE REPORT CATEGORY $0$98,999 $99,000$209,999 $210,000$288,999 $289,000 + AVG TOTALS ACTIVE LISTINGS 0 0 0 0 0 MONTHS OF SUPPLY - - - -AVG DAYS ON MARKET 0 0 0 0 0 AVG SALES PRICE - - - -SIX MONTHS CLOSINGS - - - -ANNUAL CLOSINGS 0 1 0 0 1 Market Intelligence | Page 7
Pending Sales 0 0
Market Snapshot
Average Sales Price $590,749(Detached)
1.5
Average Sales Price $394,207(Attached)
1.3
DETACHED HOMES - SOLD LAST SIX MONTHS (SELLERS' MARKET)
CATEGORY $0$245,999 $246,000$353,999 $354,000$478,999 $479,000 + AVG TOTALS ACTIVE LISTINGS 1 16 45 250 312 MONTHS OF SUPPLY 0.4 1 1 1.8 1.5 AVG. DAYS ON MARKET 26 32 26 25 26 AVG. SALES PRICE $166,191 $307,222 $419,510 $701,780 $590,749 SIX MONTHS CLOSINGS 11 95 233 644 983 ANNUAL CLOSINGS 33 190 534 1808 2565
MARKET INTELLIGENCE REPORT Market Intelligence | Page 6
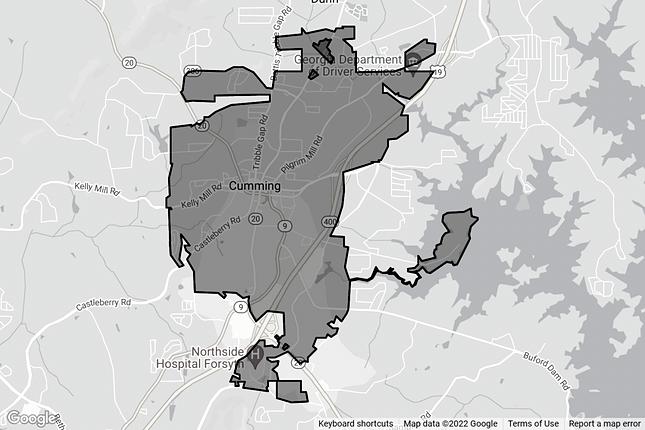
CUMMING
MONTHS OF SUPPLY ATTACHED DETACHED MONTHS OF SUPPLY
CUMMING
ATTACHED HOMES - SOLD LAST SIX MONTHS (SELLERS' MARKET)
EACH DATA POINT BELOW IS ONE MONTH OF ACTIVITY (ALL PROPERTY TYPES)
MARKET INTELLIGENCE REPORT CATEGORY $0$245,999 $246,000$353,999 $354,000$478,999 $479,000 + AVG TOTALS ACTIVE LISTINGS 0 1 9 19 29 MONTHS OF SUPPLY - 0.1 1 3.2 1.3 AVG DAYS ON MARKET 20 25 24 18 23 AVG SALES PRICE $245,000 $311,728 $402,682.00 $546,970 $394,207 SIX MONTHS CLOSINGS 1 45 59 22 127 ANNUAL CLOSINGS 2 85 122 70 279 Market Intelligence | Page 7
Sale To List Price Ratio Cumulative DOM Price Per Sq Ft 97.6% 56 $200 New Listings Pending Sales 197 161
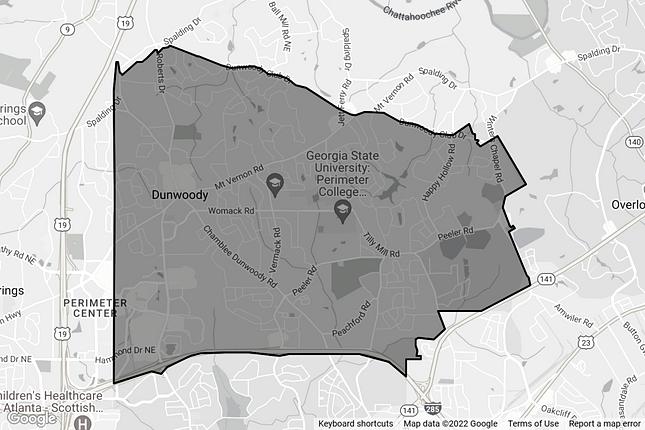
DUNWOODY
Market Snapshot
Average Sales Price $655,760(Detached)
1.3
DETACHED MONTHS OF SUPPLY
Average Sales Price $397,151(Attached)
1.2 MONTHS OF SUPPLY ATTACHED
DETACHED HOMES - SOLD LAST SIX MONTHS (SELLERS' MARKET)
CATEGORY $0$311,999 $312,000$468,999 $469,000$574,999 $575,000 + AVG TOTALS ACTIVE LISTINGS 0 3 5 27 35 MONTHS OF SUPPLY - 2.1 0.8 1.5 1.3 AVG. DAYS ON MARKET 3 14 19 10 12 AVG. SALES PRICE $308,500 $396,669 $523,827 $761,669 $655,760 SIX MONTHS CLOSINGS 1 11 44 85 141 ANNUAL CLOSINGS 2 19 87 218 326
MARKET INTELLIGENCE REPORT Market Intelligence | Page 6
DUNWOODY
ATTACHED HOMES - SOLD LAST SIX MONTHS (SELLERS' MARKET)
EACH DATA POINT BELOW IS ONE MONTH OF ACTIVITY (ALL PROPERTY TYPES) Sale To List Price Ratio
97.1% 69 $207
MARKET INTELLIGENCE REPORT CATEGORY $0$311,999 $312,000$468,999 $469,000$574,999 $575,000 + AVG TOTALS ACTIVE LISTINGS 3 6 2 1 12 MONTHS OF SUPPLY 0.9 1.5 1.2 0.4 1.2 AVG DAYS ON MARKET 11 12 7 29 11 AVG SALES PRICE $244,900 $381,279 $530,667 $671,125 $397,151 SIX MONTHS CLOSINGS 11 14 6 4 35 ANNUAL CLOSINGS 32 51 20 16 119 Market Intelligence | Page 7
Sq Ft
New Listings Pending Sales 34 19
Cumulative DOM Price Per
HOLLY SPRINGS
Market Snapshot
Average Sales Price $515,163(Detached)
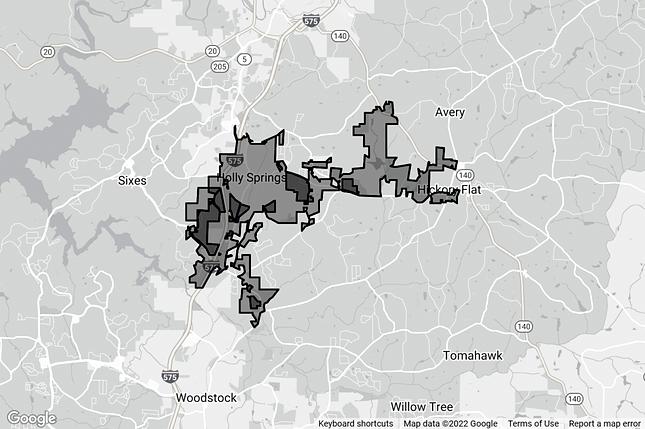
3.1
DETACHED MONTHS OF SUPPLY
Average Sales Price $363,000(Attached)
MONTHS OF SUPPLY ATTACHED
DETACHED HOMES - SOLD LAST SIX MONTHS (SELLERS' MARKET)
CATEGORY $0$311,999 $312,000$354,999 $355,000$413,999 $414,000 - + AVG TOTALS ACTIVE LISTINGS 0 0 1 7 8 MONTHS OF SUPPLY - - - 2.7 3.1 AVG. DAYS ON MARKET - - 11 31 28 AVG. SALES PRICE - - $400,078 $540,738 $515,163 SIX MONTHS CLOSINGS 0 0 2 9 11 ANNUAL CLOSINGS 0 0 4 37 41
MARKET INTELLIGENCE REPORT Market Intelligence | Page 6
HOLLY SPRINGS
ATTACHED HOMES - SOLD LAST SIX MONTHS (SELLERS' MARKET)
EACH DATA POINT BELOW IS ONE MONTH OF ACTIVITY (ALL PROPERTY TYPES)
Sale
98.6% 31 $180 New Listings Pending Sales 4 1
MARKET INTELLIGENCE REPORT CATEGORY $0$311,999 $312,000$354,999 $355,000$413,999 $414,000 - + AVG TOTALS ACTIVE LISTINGS 0 0 0 0 0 MONTHS OF SUPPLY - - - -AVG DAYS ON MARKET - - 10 - 10 AVG SALES PRICE - - $363,000 - $363,000 SIX MONTHS CLOSINGS 0 0 1 0 1 ANNUAL CLOSINGS 0 0 1 0 1 Market Intelligence | Page 7
Cumulative DOM Price Per Sq Ft
To List Price Ratio
Market Snapshot
Average Sales Price $1,326,815(Detached)
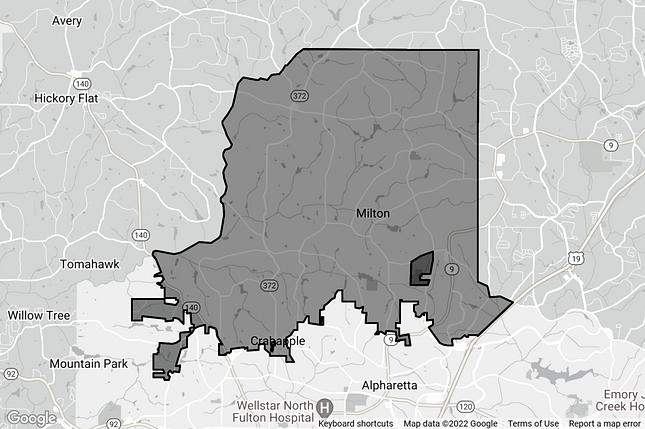
2.3
Average Sales Price $622,001(Attached)
2.2 MONTHS OF SUPPLY ATTACHED
DETACHED HOMES - SOLD LAST SIX MONTHS (SELLERS' MARKET)
CATEGORY $0$477,999 $478,000$739,999 $740,000$1,024,999 $1,025,000 + AVG TOTALS ACTIVE LISTINGS 0 3 8 51 62 MONTHS OF SUPPLY - 1 1.2 3.3 2.3 AVG. DAYS ON MARKET 17 34 33 33 32 AVG. SALES PRICE $408,238 $635,409 $863,690 $1,765,392 $1,326,815 SIX MONTHS CLOSINGS 8 11 34 70 123 ANNUAL CLOSINGS 21 32 70 213 335
MILTON MARKET INTELLIGENCE REPORT Market Intelligence | Page 6
DETACHED
MONTHS OF SUPPLY
ATTACHED HOMES - SOLD LAST SIX MONTHS (SELLERS' MARKET)
EACH DATA POINT BELOW IS ONE MONTH OF ACTIVITY (ALL PROPERTY TYPES)
96.6% 60 $291 New Listings Pending Sales 30 15
MARKET INTELLIGENCE REPORT CATEGORY $0$477,999 $478,000$739,999 $740,000$1,024,999 $1,025,000 + AVG TOTALS ACTIVE LISTINGS 1 1 6 3 11 MONTHS OF SUPPLY 0.4 0.6 2.7 3 2.2 AVG DAYS ON MARKET 24 89 25 353 47 AVG SALES PRICE $358,667 $643,516 $812,226 $1,180,000 $622,001 SIX MONTHS CLOSINGS 12 6 13 1 32 ANNUAL CLOSINGS 26 15 20 2 63 Market Intelligence | Page 7
MILTON
Sale To List Price Ratio Cumulative DOM Price Per Sq Ft
1.2
NORTH BUCKHEAD DETACHED MONTHS OF SUPPLY
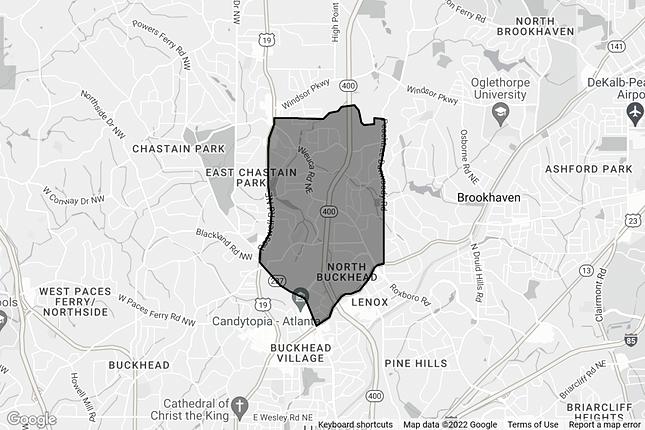
Average Sales Price $560,660(Attached) 3.1
DETACHED HOMES - SOLD LAST SIX MONTHS (SELLERS' MARKET)
CATEGORY $0 - $81,999 $82,000$344,999 $345,00$714,999 $715,00 + AVG TOTALS ACTIVE LISTINGS 0 0 0 10 10 MONTHS OF SUPPLY - - - 1.3 1.2 AVG. DAYS ON MARKET - - 20 30 29 AVG. SALES PRICE - - $639,833 1,594,821 $1,439,958 SIX MONTHS CLOSINGS 0 0 6 31 37 ANNUAL CLOSINGS 0 0 10 94 104
MARKET INTELLIGENCE REPORT Market Intelligence | Page 6
Market Snapshot MONTHS OF SUPPLY ATTACHED
Average Sales Price $1,439,958(Detached)
NORTH BUCKHEAD
ATTACHED HOMES - SOLD LAST SIX MONTHS (SELLERS' MARKET)
EACH DATA POINT BELOW IS ONE MONTH OF ACTIVITY (ALL PROPERTY TYPES)
96.9% 73 $185
MARKET INTELLIGENCE REPORT CATEGORY $0 - $81,999 $82,000$344,999 $345,00$714,999 $715,00 + AVG TOTALS ACTIVE LISTINGS 0 9 23 22 54 MONTHS OF SUPPLY - 1.5 2.7 6.4 3.1 AVG DAYS ON MARKET - 29 35 78 41 AVG SALES PRICE - $287,344 $463,583 $1,313,500 $560,660 SIX MONTHS CLOSINGS 0 24 41 14 79 ANNUAL CLOSINGS 0 78 109 45 232 Market Intelligence | Page 7
Sale To List Price Ratio Cumulative DOM Price Per Sq Ft
New Listings Pending
Sales 30 8
ROSWELL
Average Sales Price $691,070(Detached)
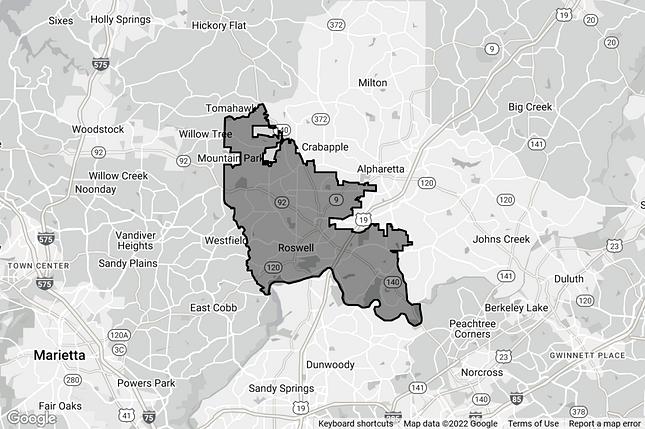
DETACHED
MONTHS OF SUPPLY ATTACHED
DETACHED HOMES - SOLD LAST SIX MONTHS (SELLERS' MARKET)
CATEGORY $0$298,999 $299,000$414,999 $415,000$549,999 $550,000 + AVG TOTALS ACTIVE LISTINGS 0 6 14 96 116 MONTHS OF SUPPLY - 11 05 18 14 AVG DAYS ON MARKET 16 27 20 25 23 AVG SALES PRICE 295,000 379,121 480,462 835,626 691,070 SIX MONTHS CLOSINGS 1 36 126 264 427 ANNUAL CLOSINGS 3 77 308 671 1,059
Market Snapshot MARKET INTELLIGENCE REPORT Market Intelligence | Page 6
OF SUPPLY
Average Sales Price $467,704(Attached) 0.6
MONTHS
1.4
ATTACHED HOMES - SOLD LAST SIX MONTHS (SELLERS' MARKET)
EACH DATA POINT BELOW IS ONE MONTH OF ACTIVITY (ALL PROPERTY TYPES)
MARKET INTELLIGENCE REPORT CATEGORY $0$298,999 $299,000$414,999 $415,000$549,999 $550,000 + AVG TOTALS ACTIVE LISTINGS 3 2 3 9 17 MONTHS OF SUPPLY 0.4 0.4 0.5 1.1 0.6 AVG DAYS ON MARKET 15 19 30 26 22 AVG SALES PRICE 244,164 359,167 483,271 697,666 467,704 SIX MONTHS CLOSINGS 44 24 31 52 151 ANNUAL CLOSINGS 86 67 80 114 347 Market Intelligence | Page 7
ROSWELL
Sale To List Price Ratio Cumulative DOM Price Per Sq Ft
New Listings Pending Sales 79 76
99.1% 27 $224
SANDY SPRINGS
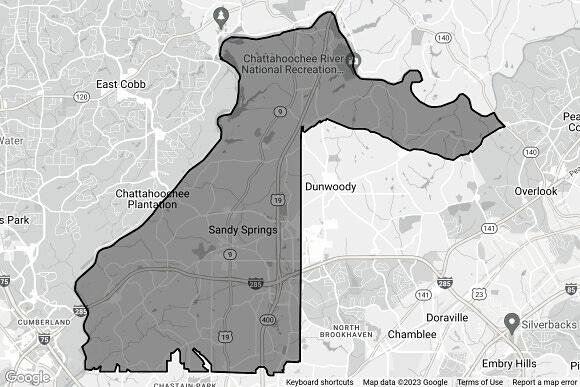
Average Sales Price $1,117,879(Detached)
1.8
DETACHED MONTHS OF SUPPLY
Average Sales Price $343,431(Attached)
1.5 MONTHS OF SUPPLY ATTACHED
DETACHED HOMES - SOLD LAST SIX MONTHS (SELLERS' MARKET)
CATEGORY 0 - $167,999 $168,000$474,999 $475,000$714,999 $715,000 + AVG TOTALS ACTIVE LISTINGS 0 0 5 58 64 MONTHS OF SUPPLY - - 0.5 2.3 1.8 AVG. DAYS ON MARKET - 45 35 38 37 AVG. SALES PRICE - $380,000 $599,317 $1,325,498 $1,117,879 SIX MONTHS CLOSINGS 0 2 46 122 170 ANNUAL CLOSINGS 0 7 115 312 434
Market Snapshot MARKET INTELLIGENCE REPORT Market Intelligence | Page 6
SANDY SPRINGS
ATTACHED HOMES - SOLD LAST SIX MONTHS (SELLERS' MARKET)
EACH DATA POINT BELOW IS ONE MONTH OF ACTIVITY (ALL PROPERTY TYPES)
95.7% 54 $234 New Listings Pending Sales 86 51
MARKET
CATEGORY 0 - $167,999 $168,000$474,999 $475,000$714,999 $715,000 + AVG TOTALS ACTIVE LISTINGS 11 30 11 6 58 MONTHS OF SUPPLY 2.5 1.1 2.2 2.9 1.5 AVG DAYS ON MARKET 33 17 25 33 21 AVG SALES PRICE $135,968 $277,936 $582,869 $897,680 $343,431 SIX MONTHS CLOSINGS 22 150 30 13 215 ANNUAL CLOSINGS 50 341 82 25 498 Market Intelligence | Page 7
INTELLIGENCE REPORT
Sale To List Price Ratio Cumulative DOM Price Per Sq Ft
WOODSTOCK
Market Snapshot
Average Sales Price $467,653(Detached)
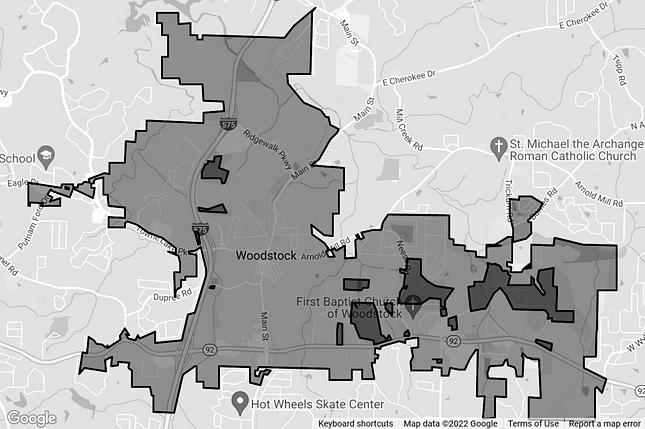
1.3
Average Sales Price $428,597(Attached)
2.7
DETACHED HOMES - SOLD LAST SIX MONTHS (SELLERS' MARKET)
CATEGORY $0$214,999 $215,000$298,999 $299,000$408,999 $409,000 + AVG TOTALS ACTIVE LISTINGS 1 3 47 103 155 MONTHS OF SUPPLY 0.7 0.6 1.1 1.5 1.3 AVG. DAYS ON MARKET 79 15 30 29 29 AVG. SALES PRICE $211,000 $270,909 $360,005 $566,575 $467,653 SIX MONTHS CLOSINGS 1 37 236 333 607 ANNUAL CLOSINGS 1 78 527 812 1418
DETACHED MONTHS OF SUPPLY
MONTHS OF SUPPLY ATTACHED
MARKET INTELLIGENCE REPORT Market Intelligence | Page 6
WOODSTOCK
ATTACHED HOMES - SOLD LAST SIX MONTHS (SELLERS' MARKET)
EACH DATA POINT BELOW IS ONE MONTH OF ACTIVITY (ALL PROPERTY TYPES) Sale To List Price Ratio
97.8% 55 $203 New Listings Pending Sales 135 116
MARKET INTELLIGENCE REPORT CATEGORY $0$214,999 $215,000$298,999 $299,000$408,999 $409,000 + AVG TOTALS ACTIVE LISTINGS 1 0 17 50 68 MONTHS OF SUPPLY 1 - 1.6 3.8 2.7 AVG DAYS ON MARKET 7 14 22 40 32 AVG SALES PRICE $201,000 $275,140 $360,440 $488,040 $428,597 SIX MONTHS CLOSINGS 1 10 57 95 163 ANNUAL CLOSINGS 1 21 134 180 336 Market Intelligence | Page 7
Cumulative DOM Price
Sq Ft
Per
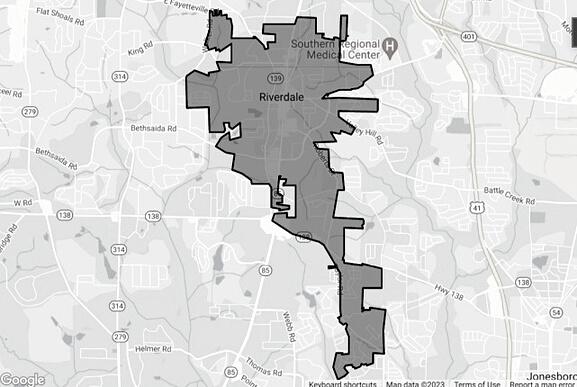
Market Snapshot
DETACHED HOMES - SOLD LAST SIX MONTHS (SELLERS' MARKET)
CATEGORY $0 -$84,999 $85,000$135,999 $136,000$179,999 $180,000 + AVG TOTALS ACTIVE LISTINGS 0 1 2 52 57 MONTHS OF SUPPLY - 0.7 0.7 2.1 2.0 AVG. DAYS ON MARKET 11 15 21 27 26 AVG. SALES PRICE $82,000 $110,333 $161,764 $262,897 $249,469 SIX MONTHS CLOSINGS 1 3 14 135 153 ANNUAL CLOSINGS 2 9 25 305 341
MONTHS OF SUPPLY ATTACHED DETACHED MONTHS OF SUPPLY
MARKET INTELLIGENCE REPORT Market Intelligence | Page 6
Average Sales Price $188,358(Attached) 2.0
2.0 Average Sales Price $249,469(Detached) RIVERDALE
RIVERDALE
ATTACHED HOMES - SOLD LAST SIX MONTHS (SELLERS' MARKET)
EACH DATA POINT BELOW IS ONE MONTH OF ACTIVITY (ALL PROPERTY TYPES)
MARKET INTELLIGENCE REPORT CATEGORY $0 -$84,999 $85,000$135,999 $136,000$179,999 $180,000 + AVG TOTALS ACTIVE LISTINGS 0 3 1 7 12 MONTHS OF SUPPLY - 3 0.5 1.8 2.0 AVG DAYS ON MARKET 19 7 22 11 13 AVG SALES PRICE $61,750 $122,000 $165,643 $204,385 $188,358 SIX MONTHS CLOSINGS 2 2 7 34 45 ANNUAL CLOSINGS 3 3 22 48 76 Market Intelligence | Page 7
Sale To List Price Ratio Cumulative DOM Price Per Sq Ft 99.5%
$146 New Listings
36
24
Pending Sales
24
UNION CITY
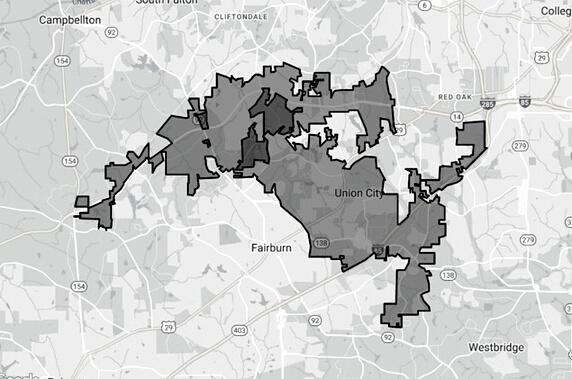
Market Snapshot
Average Sales Price $292,644(Detached)
Average Sales Price $177,598(Attached)
1.6
DETACHED HOMES - SOLD LAST SIX MONTHS (SELLERS' MARKET)
CATEGORY $0$214,999 $215,000$298,999 $299,000$408,999 $409,000 + AVG TOTALS ACTIVE LISTINGS 0 0 1 20 21 MONTHS OF SUPPLY - - 08 17 16 AVG DAYS ON MARKET - 14 9 27 25 AVG SALES PRICE - $83,750 $148,500 $309,172 $292,644 SIX MONTHS CLOSINGS 0 4 2 68 74 ANNUAL CLOSINGS 0 8 8 143 159
MONTHS OF SUPPLY ATTACHED DETACHED MONTHS OF SUPPLY
1.6
MARKET INTELLIGENCE REPORT Market Intelligence | Page 6
UNION CITY
ATTACHED HOMES - SOLD LAST SIX MONTHS (SELLERS' MARKET)
EACH DATA POINT BELOW IS ONE MONTH OF ACTIVITY (ALL PROPERTY TYPES)
MARKET INTELLIGENCE REPORT CATEGORY $0$214,999 $215,000$298,999 $299,000$408,999 $409,000 + AVG TOTALS ACTIVE LISTINGS 0 8 3 3 14 MONTHS OF SUPPLY - 2.9 1.2 0.7 1.6 AVG DAYS ON MARKET 37 26 20 17 21 AVG SALES PRICE $47,000 $103,269 $161,500 $231,094 $177,598 SIX MONTHS CLOSINGS 1 14 7 24 46 ANNUAL CLOSINGS 2 25 22 53 102 Market Intelligence | Page 7
Sale To List Price Ratio Cumulative DOM Price Per Sq Ft 98.4% 24 $118 New Listings Pending Sales 24 19
FAYETTEVILLE
Market Snapshot
Average Sales Price $472,718(Detached)
2.3
Average Sales Price $371,180(Attached)
6.9
DETACHED HOMES - SOLD LAST SIX MONTHS (SELLERS' MARKET)
CATEGORY $0$214,999 $215,000$298,999 $299,000$408,999 $409,000 + AVG TOTALS ACTIVE LISTINGS 2 9 22 42 75 MONTHS OF SUPPLY 2 2 1.3 3.9 2.3 AVG. DAYS ON MARKET 29 39 28 30 31 AVG. SALES PRICE $157,500 $282,843 $385,611 $697,353 $472,718 SIX MONTHS CLOSINGS 1 34 77 60 172 ANNUAL CLOSINGS 3 77 190 129 399
MONTHS OF SUPPLY ATTACHED DETACHED MONTHS OF SUPPLY
MARKET INTELLIGENCE REPORT Market Intelligence | Page 6
FAYETTEVILLE
ATTACHED HOMES - SOLD LAST SIX MONTHS (SELLERS' MARKET)
EACH DATA POINT BELOW IS ONE MONTH OF ACTIVITY (ALL PROPERTY TYPES) Sale
MARKET INTELLIGENCE REPORT CATEGORY $0$214,999 $215,000$298,999 $299,000$408,999 $409,000 + AVG TOTALS ACTIVE LISTINGS 0 0 10 3 13 MONTHS OF SUPPLY - - 10 1.7 6.9 AVG DAYS ON MARKET 11 7 - 26 16 AVG SALES PRICE $137,000 $235,000 - $673,450 $371,180 SIX MONTHS CLOSINGS 2 1 0 2 5 ANNUAL CLOSINGS 4 3 1 9 17 Market Intelligence | Page 7
To List Price
Cumulative DOM Price Per Sq Ft
Ratio
97.2% 63 $172 New Listings Pending Sales 50 32
PEACHTREE CITY
Market Snapshot
DETACHED HOMES - SOLD LAST SIX MONTHS (SELLERS' MARKET)
CATEGORY $0$214,999 $215,000$298,999 $299,000$408,999 $409,000 + AVG TOTALS ACTIVE LISTINGS 1 0 4 12 17 MONTHS OF SUPPLY 0.8 - 0.8 2.1 1.3 AVG. DAYS ON MARKET 9 23 41 32 34 AVG. SALES PRICE $246,567 $346,933 $489,744 $632,915 $528,986 SIX MONTHS CLOSINGS 3 9 32 36 80 ANNUAL CLOSINGS 5 22 83 62 172
MONTHS OF SUPPLY ATTACHED DETACHED MONTHS OF SUPPLY
Average Sales Price $288,300(Attached) 0.5
1.3 Average Sales Price $528,986(Detached)
MARKET INTELLIGENCE REPORT Market Intelligence | Page 6
PEACHTREE CITY
ATTACHED HOMES - SOLD LAST SIX MONTHS (SELLERS' MARKET)
EACH DATA POINT BELOW IS ONE MONTH OF ACTIVITY (ALL PROPERTY TYPES)
Sale To List Price Ratio
99.1% 24 $181 New Listings Pending Sales 9 7
INTELLIGENCE REPORT CATEGORY $0$214,999 $215,000$298,999 $299,000$408,999 $409,000 + AVG TOTALS ACTIVE LISTINGS 0 1 0 0 1 MONTHS OF SUPPLY - 1 - - 5 AVG DAYS ON MARKET 12 - 3 - 9 AVG SALES PRICE $222,450 - $420,000 - $288,300 SIX MONTHS CLOSINGS 2 0 1 0 3 ANNUAL CLOSINGS 4 3 4 0 11 Market Intelligence | Page 7
MARKET
Cumulative DOM Price
Sq Ft
Per
Market Intelligence JANUARY 2023 Velocity Real Estate 20 23 ©Velocity Real Estate LLC. All rights reserved. The information in this document is believed to be reliable but cannot be guaranteed. The accuracy of this information should be independently verified. This market intelligence report is not an attempt to solicit your listing. Velocity Real Estate LLC fully supports the principles of the Fair Housing Act and the Equal Opportunity Act.
