The RED Method Patterns for instrumentation & monitoring. Tom Wilkie tom@kausal.co @tom_wilkie github.com/tomwilkie

• Founder Kausal, “transforming observability”

• Prometheus developer
• Home brewer
Previously:
• Worked on Kubernetes & Prometheus at Weaveworks
• SRE for Google Analytics
• Founder/CTO at Acunu, worked on Cassandra


Introduction
Why does this matter?
The USE Method
Utilisation, Saturation, Errors
The RED Method Requests Rate, Errors, Duration..
The Four Golden Signals
RED + Saturation

Introduction

The USE Method


For every resource, monitor:
• Utilisation: % time that the resource was busy
• Saturation: amount of work resource has to do, often queue length
• Errors: the count of error events
http://www.brendangregg.com/usemethod.html
USE Method

Utilisation Saturation Errors


CPU ✔ ✔ ✔ Memory ✔ ✔ ✔ Disk ✔ ✔ ✔ Network ✔ ✔ ✖

CPU Utilisation:
1 - avg(rate(node_cpu{job="default/node-exporter",mode="idle"}[1m])) CPU Saturation: sum(node_load1{job="default/node-exporter"})
CPU USE in Prometheus
/ sum(node:node_num_cpu:sum)
Memory
Utilisation
:
1 - sum( node_memory_MemFree{job=“…”} + node_memory_Cached{job=“…”} + node_memory_Buffers{job=“…”}
) / sum(node_memory_MemTotal{job=“…”})
Memory Saturation
:
1e3 * sum( rate(node_vmstat_pgpgin{job=“…”}[1m]) + rate(node_vmstat_pgpgout{job=“…”}[1m])) )

Memory USE in Prometheus
• CPU Errors, Memory Errors
• Hard Disk Errors!
• Disk Capacity vs Disk IO
• Network Utilisation
• Interconnects

Interesting
Cases
/ Hard

Demo Time
• “The USE Method” - Brendan Gregg
• KLUMPS - Kubernetes/Linux USE Method with Prometheus https://github.com/kausalco/public

More Details

The RED Method

For every service, monitor request:
• Rate - number of requests per second
• Errors - the number of those requests that are failing
• Duration - the amount of time those requests take
Method
The RED


import ( “github.com/prometheus/client_golang/prometheus" )
var requestDuration = prometheus.NewHistogramVec(prometheus.HistogramOpts{
Name: "request_duration_seconds",
Help: "Time (in seconds) spent serving HTTP requests.", Buckets: prometheus.DefBuckets, }, []string{"method", "route", "status_code"}) func init() { prometheus.MustRegister(requestDuration) }

Prometheus Implementation
func wrap(h http.Handler) http.Handler { return http.HandlerFunc(func(w http.ResponseWriter, r *http.Request) { m := httpsnoop.CaptureMetrics(h, w, r) requestDuration.WithLabelValues(r.Method, r.URL.Path, strconv.Itoa(m.Code)).Observe(m.Duration.Seconds()) })
func server(addr string) { http.Handle("/metrics", prometheus.Handler()) http.Handle("/greeter", wrap(http.HandlerFunc(func(w http.ResponseWriter, r *http.Request) ... }))

Prometheus Implementation
}
}

Rate: sum(rate(request_duration_seconds_count{job=“…”}[1m]))
Errors: sum(rate(request_duration_seconds_count{job=“…”, status_code!~”2..”}[1m]))
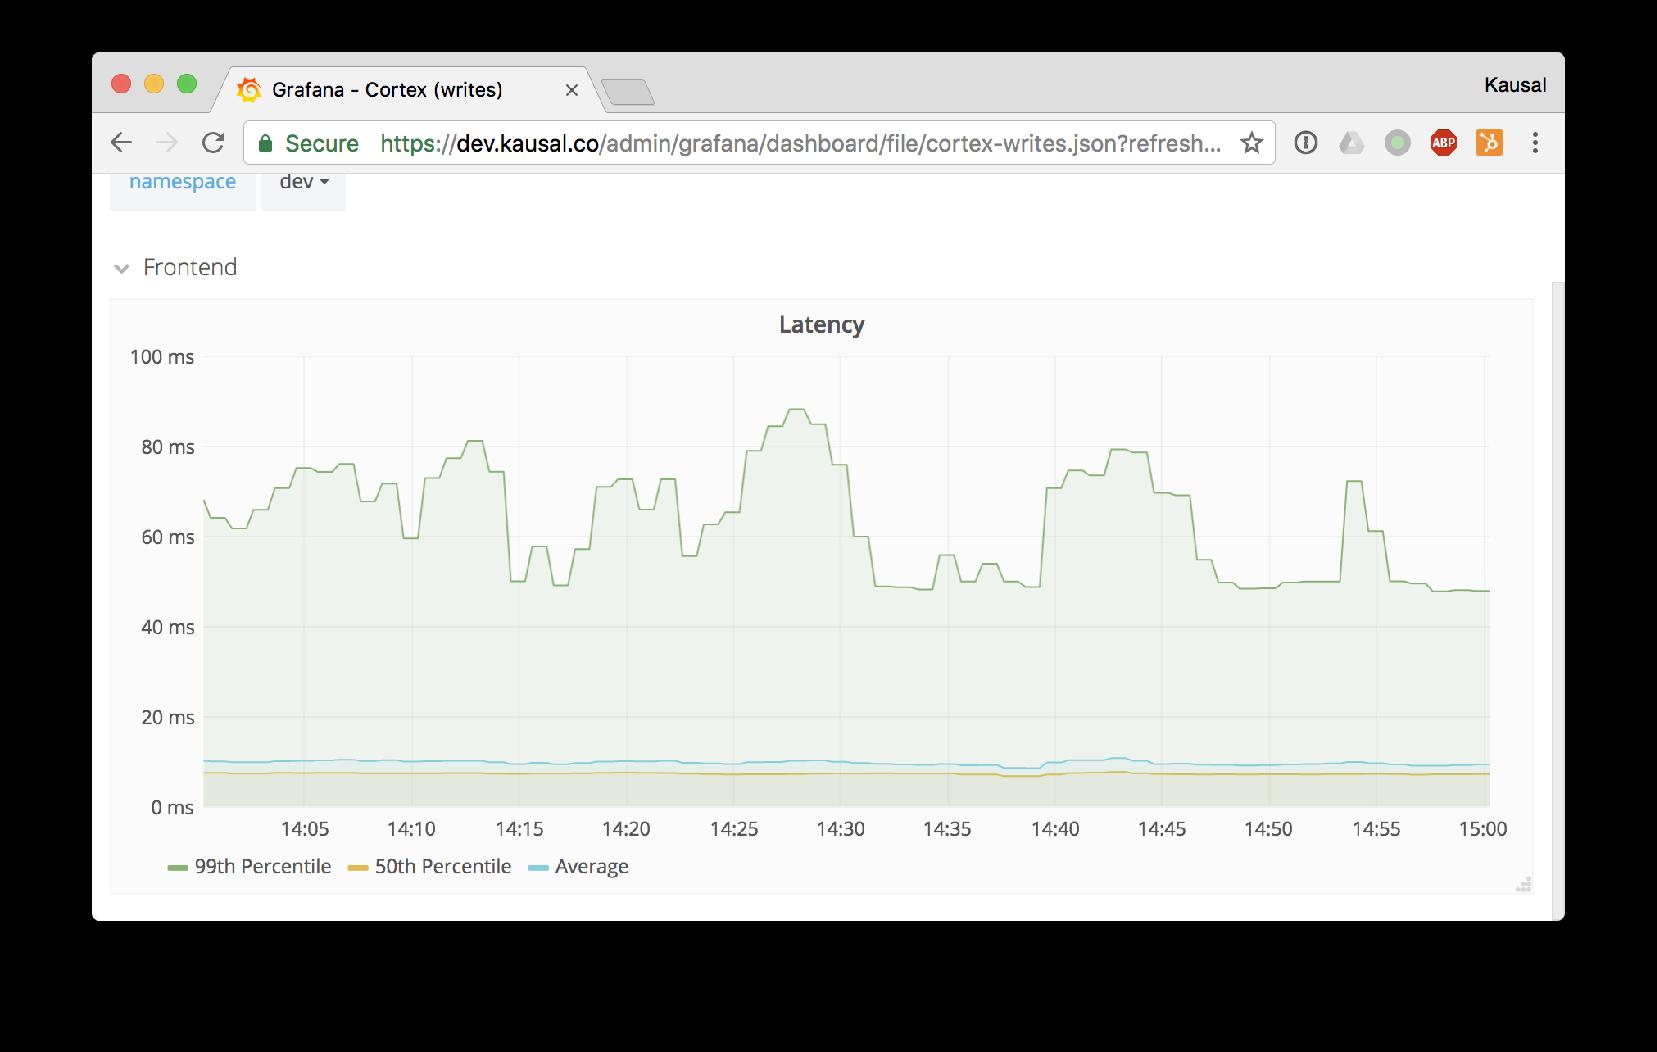
Duration: histogram_quantile(0.99, sum(rate(request_duration_seconds_bucket{job=“…}[1m])) by (le))
Easy to query

Demo Time


Latencies & Averages
• “Monitoring Microservices” - Weaveworks (slides)
• "The RED Method: key metrics for microservices architecture” - Weaveworks
• “Monitoring and Observability with USE and RED” - VividCortex
• “RED Method for Prometheus – 3 Key Metrics for Monitoring” - Rancher Labs
• “Logs and Metrics” - Cindy Sridharan
• "Logging v. instrumentation”, “Go best practices, six years in” - Peter Bourgon

More Details

The Four Golden Signals


For each service, monitor:
• Latency - time taken to serve a request
• Traffic - how much demand is places on your system
• Errors - rate or requests that are failing
• Saturation - how “full” your services is

Four Golden Signals
The


Demo Time
• “The Four Golden Signals” - The Google SRE Book
• “How to Monitor the SRE Golden Signals” - Steve Mushero

More Details

Summary

Thanks! Questions?


