1 minute read
Technical analysis and charting

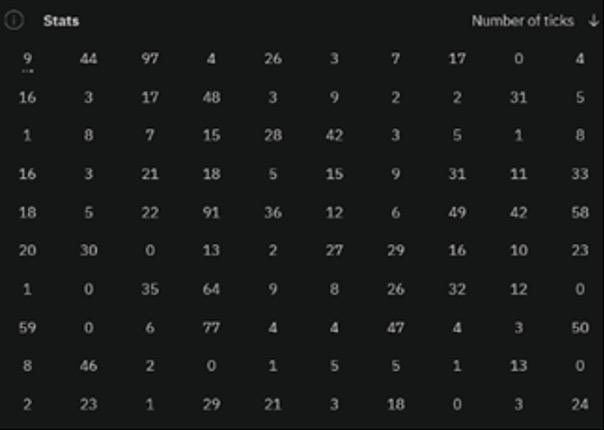
Traders interested in analysing patterns may choose to copy this data into a spreadsheet. You can also download the underlying index data (such as Volatility 100 Index) in CSV format.
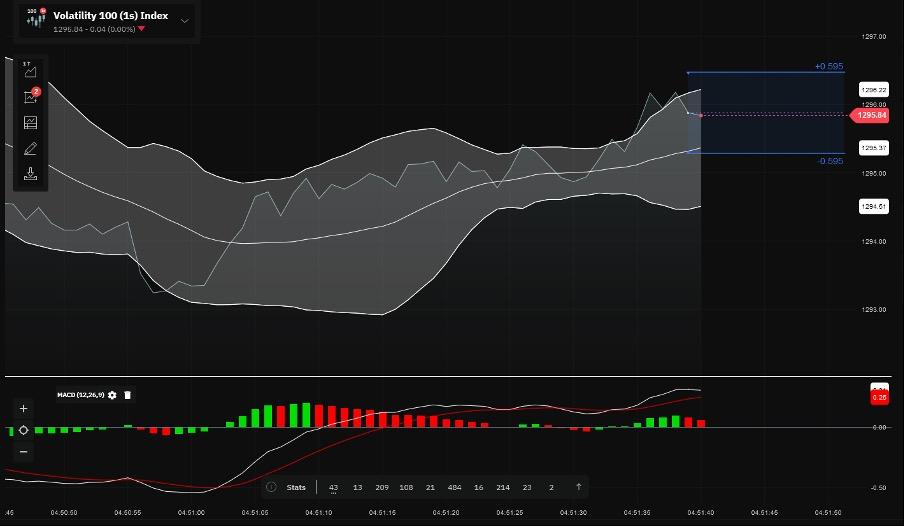
Since these are short-term options, the default chart is a tick chart, also known as a line chart. You can enhance this chart with popular technical analysis tools, including Moving Averages, Bollinger Bands, and MACD.
Full fair transparency
As with all products offered by Deriv, all accumulator options are fully audited and transparent. Each trade, no matter its size, is assigned a unique reference ID number when opened and closed. This ensures that every trade can be verified in case of any disputes or queries.
