4 minute read
4.1.4 Use of services during Housing First


Figure 2b. Changes in service use from 12 months pre-VOICES, to 12 months in VOICES and 12 months of Housing First in those who were NOT housed (n=5)
• Housed vs. not housed
Advertisement
Figures 3a and 3b compare service use during the first 12 months of Housing First in those who were housed vs. not housed, in terms of actual numbers and numbers per customer. Outcomes for criminal justice system use were similar in those were and were not housed (Figure 3a). Given the different numbers in each group (11 housed, 5 not housed) we explored events per customer. This showed a pattern of demand being three times higher among those not housed compared with those who were housed (Figure 3b).
For health service use outcomes, the overall numbers of A&E episodes were similar for each group, but hospital in-patient episodes were far higher in those who were housed (Figure 3a). Again, the patterns were different when exploring events per customer (Figure 3b). Compared with those who did get a Housing First tenancy, among those not housed: A&E episodes were 2.5 times more common, in-patient episodes were similar.
Despite the limitations of small numbers, in which individual customers can distort between-group comparisons, these data do indicate a clear benefit of Housing First for reducing demands on the criminal justice system and A&E, but only if a tenancy is successfully started. This highlights the importance of referrals to Housing First and rapid securement of tenancies (see Recommendations). This pattern could also reflect a degree of self-selection bias, whereby those who are less complex and easier to house are housed first, leaving a waiting list of unhoused customers who have the most complex needs.

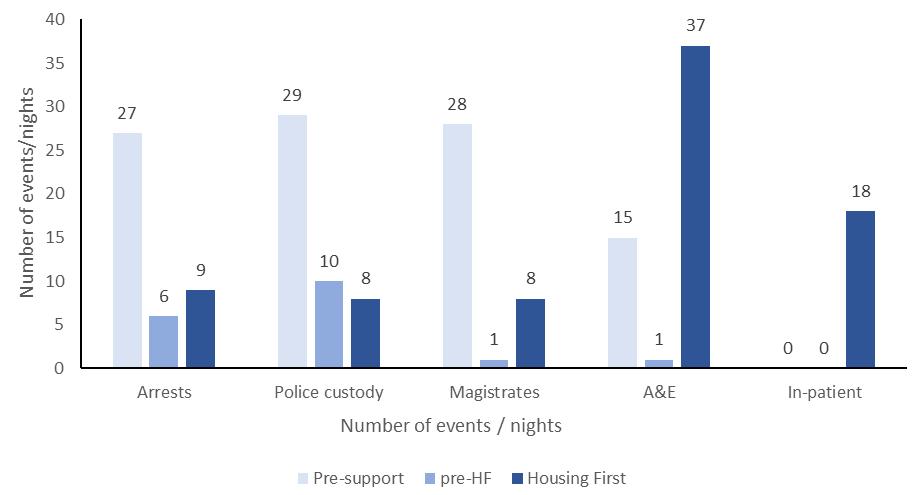
Figure 3a. Service use during the first 12 months of Housing First in those who were housed (n=11) and were not housed (n=5)
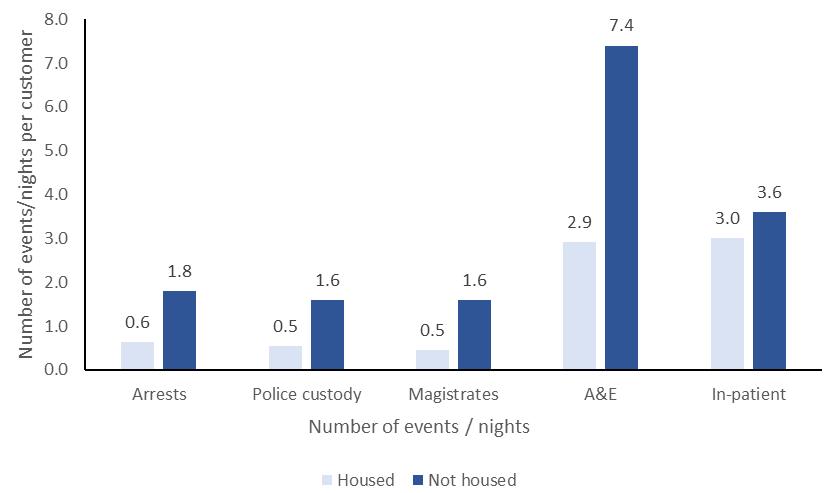
Figure 3b. Service use per customer during the first 12 months of Housing First in those who were NOT housed (n=5)
• Changes in service use during time as a Housing First Customer
The data below offer some insight regarding the effectiveness of Housing First in promoting ongoing improvements in service use during their time in the programme, and the respective trajectories in those housed vs. not housed.
Overall, except for hospital in-patient episodes (which showed inconsistent patterns), outcomes for criminal justice system use and A&E episodes showed gradual reductions over time in Housing First. To account for the different group sizes, outcomes are reported per customer (Figure 4).
Arrests: started with 1.2 arrests per person in the first quarter of Housing First, then reduced to less than one arrest per person per quarter for the remainder.
Police custody: steady reduction from 1.4 nights in custody per quarter per person, stabilising at less than 0.6 nights per person per quarter by the third quarter in Housing First.
Magistrate court appearances: aside from the initial small increase during the first quarter, there was a steady decrease to less than one appearance per person per quarter, and less than 0.5 after one year in Housing First.

Figure 4a. Criminal justice system use per customer, in all Housing First customers by quarter

Figure 4b. Health service use per customer, in all Housing First customers by quarter
A&E episodes: there was a sharp drop in A&E episodes from the first to second quarters in Housing First, followed small quarterly fluctuations, keeping the rate close to or below on episodes per person per quarter.
Hospital in-patient episodes: quarterly fluctuations, from close to zero episodes per person per quarter, to 3.5 did not offer any clear patterns, perhaps given the nature of the outcome, which can be distorted by a small number of customers with many hospital visits.
• Changes by quarter – housed vs. not housed
Trajectories by quarter in Housing First were compared in those who were/were not housed. For criminal justice system demand, there was an overall pattern indicating that housing provide a more stable environment for the steadily reduction of during Housing First (Figure 5).

5a. Arrests
There was a clearer, more sustained reduction in arrests in those housed vs. not housed.

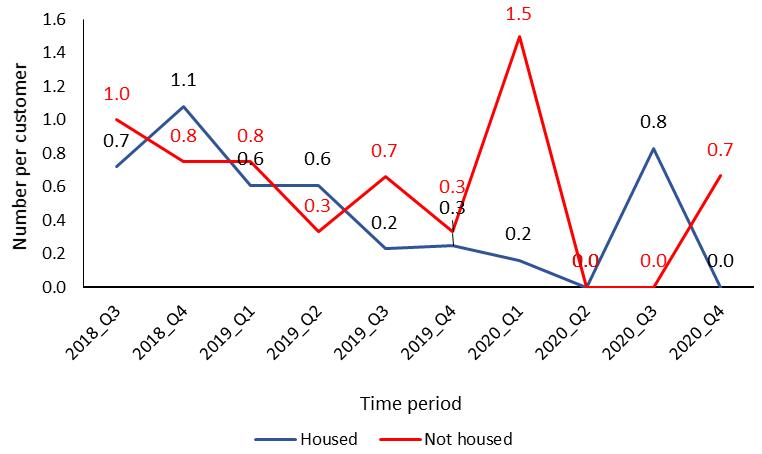
Figure 5. Criminal Justice System use per customer, by quarter, in housed vs. not housed Housing First customers
For health service use, the patterns were mixed (Figure 6).

6a. A&E episodes
After being housed for one year in Housing First, there was a sustained low level of A&E episodes close to 0.5 per person per quarter.
5b. Nights in Police custody
There was a clearer, more sustained reduction in nights in Police custody housed vs. not housed, although increases were observed in the Q3-Q4 in 2020 in both groups.
5c. Magistrate court appearances
The reduction and sustained low rate of court appearances was clearer in housed Housing First customers, compared with fluctuations observed in those not housed
