by Ciaran Murphy, Principal Consultant, Data Science and Analytics

LXA — a unique, no-code solution transforming the insurance claims process
Luxoft Analytics Platform (LXA) uses data analytics as a mechanism for driving automation.
Traditionally, those specialists working on data analytics and machine learning use cases have a fairly niche skill set. They have an innate aptitude for computer science, statistics, math and so forth.
They’re skilled in the programming languages that enable software developers to do all kinds of analytical wizardry,
LXA gives you options
It’s your choice. You can either code away to your heart’s content or take the no-code, business enterprise approach, because the days when only data engineers could build out pipelines are gone. Today, business analysts can use LXA’s simple drag-and-drop user interface to create some pretty complex use cases.
And that’s LXA’s first USP; ease of use. Virtually any team member can use advanced analytics to solve
Flexibility
The LXA platform is not just tailored for insurance, though. It’s generic, and learning from other domains is one of its strengths. So, regardless of whether you’re building forecast models for credit card transactions, looking at ESG use cases or something else entirely, LXA caters for all eventualities.

Insurance is just one use case example.
Here’s a quick rundown of the platform to give you an idea how LXA works from end-to-end, beginning with a snapshot of our extremely user-friendly UI:
whether that’s handling the initial data ingestion, data preparation and visualization, or building predictive models.
This is the great thing about working with LXA’s single platform — non-technical staff can build advanced use cases too, thanks to its straightforward, user-friendly UI.
complex problems, as insurers will quickly realize. Of course, non-tech users still need to appreciate how machine-learning algorithms work — otherwise, LXA will appear to be just another black box.
The second major benefit is LXA’s no-code approach, and the third is its rapid time to value. As long as the data is in good condition, you can expect to see tangible results in not months or days, but in a matter of hours.
One of the interesting things being built into the platform at the moment is graph analytics and network analysis. Social network analysis is trending in insurance right now, and it works like this: A claims handler working on a case discovers that the policy holder lives at the same address as an individual who’s on their insurance watchlist — risk by association is a major fraud indicator.
LXA — a unique, no-code solution transforming the insurance claims process | luxoft.com 2
Cross-industry, end-to-end analytics solution
The LXA platform comprises different components. We use Snowflake for data storage and Dataiku for the actual analytics engine. Appian is used for the front end, which is where claims analysts can come in and investigate claims with a high-risk score.
The analytics engine
It’s very modular (plug and play). For example, an insurance client might already have a data warehouse but not an analytics engine. We can take components off the LXA platform and sit them atop the existing data warehouse.
This pipeline was built out to detect insurance fraud as part of the insurance use case on the LXA platform (there are other components as well, of course).
Data ingestion (red): Dataiku allows you to build out pipelines for data science use cases right from the initial data ingestion, and users can very easily connect to their preferred data sources (not just Snowflake, as shown here). Once you have data on the platform, data preparation can begin.
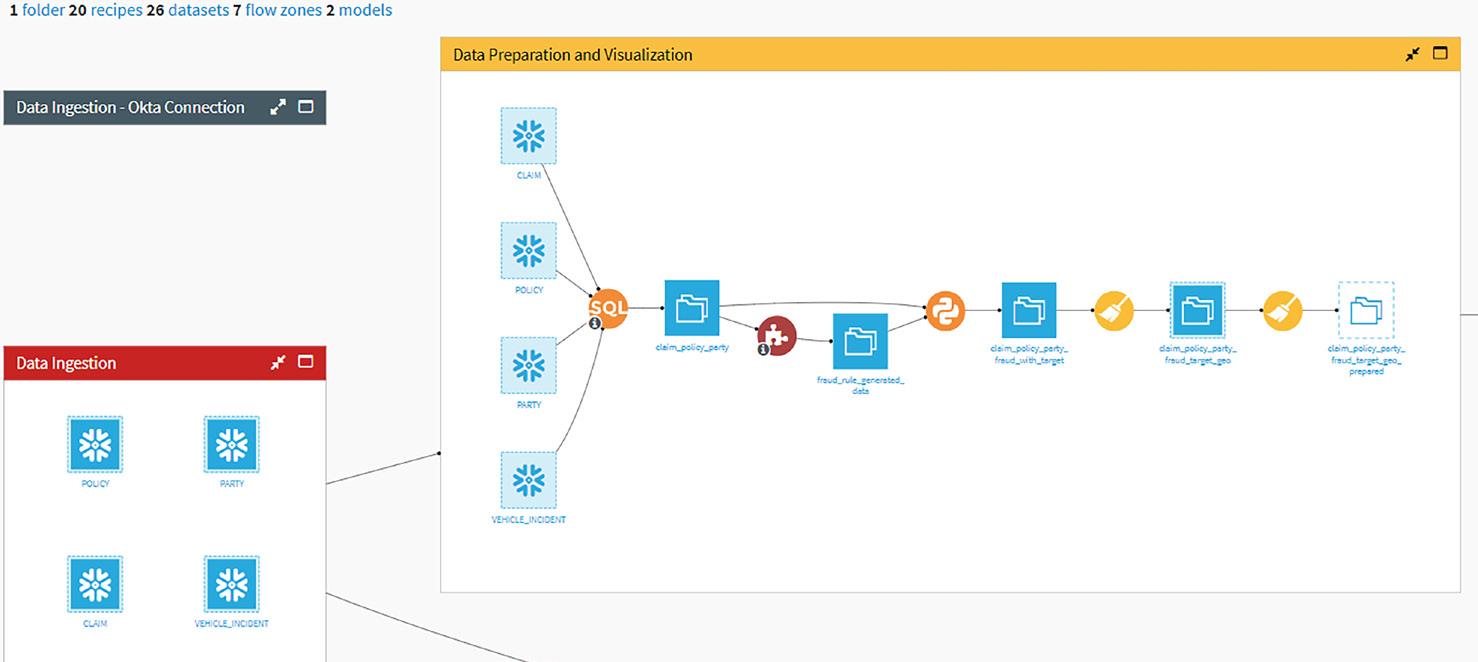
Data preparation (yellow): Preprocessing of data so that it’s of sufficient quality for advanced analytics, including dealing with missing data, merging different data sources, or any number of important issues. This can be implemented using traditional code (Python, R) or via the in-built functionality of the UI. Provides a platform for cross-functional teams to work together (e.g., technical data scientists and business analysts).

LXA — a unique, no-code solution transforming the insurance claims process | luxoft.com 3
Feature engineering (dark green): Apply business rules to data sets that we think could be good predictors. As with the previous step, this can be achieved via a programming language or our no-code UI approach.
Model training (light green): Building machine learning models to predict claims fraud using the platform’s AutoML functionality for fast experiments and iterations. Once a predictive model has been selected, the model can be deployed to score the latest data available in the database, or as a REST API with a few clicks of a button.

Reduce the workload
Traditionally, you would have to resolve complex SQL queries and write lines and lines of Python code to complete a preparation or transformation. Now, Dataiku’s simple, user-friendly UI enables you to do advanced data transformations without writing a single line of code.
Which underlines the fact that you don’t really need experienced technical data scientists to build out use cases. With some basic training, non-technical team members can implement use cases. That said, if you prefer to write the code in-house, that’s fine too. As can be seen, it’s good to have a cross-functional team; a mixture of experienced data scientists and technical business analysts.

LXA — a unique, no-code solution transforming the insurance claims process | luxoft.com 4
Get in better shape and move on
You can do some fairly advanced stuff here via our engaging user interface and get the data into good shape before moving on to predictive analytics.

Here’s an example of Dataiku’s practical, out-of-the-box visualizations, showing a geospatial distribution of fraud cases.
This visualization shows the spread of a notional series of vehicle incidents. Each point marks an insurance claim and its location, where orange represents a fraudulent claim and green, a non-fraudulent claim. But it’s not just for advanced analytics and machine learning. Here, we’re just applying some of the business rules that we have. Dataiku offers a couple of options for this — use the drag-and-drop user interface or integrate preexisting scripts.

Perhaps you want to adopt the LXA platform, but you’ve already started a project and don’t really want to reinvent the wheel. If you do have chunks of Python, R or similar, already written, you can integrate it seamlessly into the workflow. It’s really just a matter of copying and pasting.
Train the data model to recognize fraud
So, that’s data preparation, feature engineering and business rules. Then there’s the actual model training — the build-out of machine learning models to predict whether a claim is fraudulent or not. Again, there are a couple of ways you can do this. If you’re an experienced
data scientist keen to build out your models in code, you can easily do that. Otherwise, you can use the super-easy, no-code UI.
All it takes is a few clicks. Let’s start with the design app.
LXA — a unique, no-code solution transforming the insurance claims process | luxoft.com 5
You want to build a predictive model to figure out if a claim is fraudulent. Simply select your target (in this case, fraud) and nominate which algorithms you think will be good predictors of fraudulent claims.


Remember, if you were using Python or R, you’d be writing lines and lines of code to set this up (the number of vehicles, weather conditions, road type, etc.). Whereas, with Dataiku it’s just a matter of clicking relevant features — in other words, what type of
algorithm you want to use to anticipate fraudulent claims. Algorithms all behave differently, so instead of training one, you can actually train several and select different parameters to use as part of the training.
LXA — a unique, no-code solution transforming the insurance claims process | luxoft.com 6
The reason for this is that once you’ve got the results page from your training session, you can compare different models, side by side, to see which performed best.
You can also do a deep dive on the individual models themselves. Click on one and it will interpret the model, telling you how the model works and if a claim is fraudulent.
It’s a decision tree, so you can trace various routes taken through the data and reach the final outcome.

There’s a lot of information here — confusion matrix, false positives and negatives, etc. — which is all generated automatically for the training session. In Dataiku, there’s not a single piece of code required. Time to value is rapid, results are evident after a few clicks, and drag-and-drop icons on the main canvas.

LXA — a unique, no-code solution transforming the insurance claims process | luxoft.com 7
Train once, use often
Imagine you’ve trained a pretty advanced predictive model and are happy with the way it performs. The great thing is, you can reuse the pipeline. So, when new data comes in, put it through the trained model to get all the latest predictions and fraud scores as new claims are added to the database.

The trained model can be scheduled to run automatically. If your database updates itself each day at midnight, you could tell the model to run at 1 a.m., which will give you the latest data refresh as well as your new scores.
The refresh can also be based on an event. Let’s say there’s a particular table you want to point your model at. Every time that table changes (e.g., new rows are added or certain rows and fields are changed) it will kick-start the pipeline. That’s rather more real time, and as new data comes in, you can grab it straightaway and get the latest predictions. Or suppose it’s intraday, and instead of waiting until the end of the day after the database runs, you can get the latest numbers.
And how do you want to consume these results? In the above table, we have a claim ID and a fraud score associated with it, plus a couple of other fields. It needs to be written back to the database, which is just a matter of clicking a button. The platform has plugins that allow you to export results in the correct format for business intelligence tools like Power BI, Tableau or QlikView, too.
Also, if real-time predictions are more helpful or you have a third-party system to which you’d like to send requests for values, this can be exposed as a REST API. Again, it really is just a matter of a few clicks to set up a RESTful API on your infrastructure. Traditionally, this is a convoluted process requiring lots of steps. With Dataiku, you can set it up in minutes, which leaves you extra time to work on more pressing parts of the use case.
LXA — a unique, no-code solution transforming the insurance claims process | luxoft.com 8
About the author
Ciarán Murphy Principal Consultant, Data Science and Analytics
Amassing 10 years’ experience in data analytics and machine learning has taken Ciarán across multiple industries; all the way from financial services to e-commerce and utilities. The hard-earned result is a proven track record in implementing end-to-end data science use cases, communicating results and insights, and solutioning. Ciarán has a BSc in Mathematical Physics from University College Dublin and an MSc in Theoretical Physics from King’s College London.

If you’d like to find out about LXA’s no cost initial deployment and what the platform could do for your own claims processes, visit luxoft.com/insurance or contact us. We’ll be pleased to provide a deeper, more personalized dive into the LXA claims automation engine.
About Luxoft
Luxoft is the design, data and development arm of DXC Technology, providing bespoke, end-to-end technology solutions for mission-critical systems, products and services. We help create data-fueled organizations, solving complex operational, technological and strategic challenges. Our passion is building resilient businesses, while generating new business channels and revenue streams, exceptional user experiences and modernized operations at scale. luxoft.com
© 2022 Luxoft, A DXC Technology Company. All rights reserved.
