13 minute read
Engagement
Engagement
Current Engagement
There are 11 landowners in the Cottey Brook catchment. WRT has engaged with farmers managing 4.65% of the total farm area under Upstream Thinking 3. WRT has not engaged the catchment community in other projects. The local community appears to already have measures to increase the climate resilience of the catchment name. Details of the village’s flooding groups can be found on slide 18. There is also a community response group called Sustainable Tiverton. This is for residents of Tiverton to communicate about local solutions to face the climate emergency. They mainly focus on the areas of biodiversity, reducing carbon-dioxide emissions, and building climate resilience.


More information on Upstream Thinking activities on the Exe catchment can be found in regular newsletters on the WRT website.
Engagement
Getting Involved
As well as the opportunities identified in the previous section, there may be opportunities for you to get involved as an individual. WRT runs a Citizen Science Investigation (CSI) team of volunteers across the south west, whereby volunteers receive a testing kit and training to procure water samples from a watercourse. Westcountry CSI aims to engage people with their local environment, and produce water monitoring data that can identify pollution events quickly and target improvement work. There are no active CSI sampling sites in the catchment. However, there may be the potential for new sampling sites along the main Cottey Brook in Tiverton and further up the catchment in if there is suitable access to the water.
For more information about Westcountry CSI, including instructions on what’s involved and how to sign up, visit our website at wrt.org.uk/westcountry-csi Another opportunity for you to get involved in is the Riverfly Partnership’s Anglers’ Riverfly Monitoring Initiative (ARMI). This recognises that anglers are very well placed to monitor river water quality and facilitates communication between them and their local Environment Agency contact. There are no riverfly survey sites within the micro-catchment, but, as with CSI sites, it may be possible to start a new site if there is suitable access to the water and with communication with the Environment Agency. For more information on ARMI, visit their website at riverflies.org/anglersriverfly-monitoring-initiative-armi
Summar y and Next Steps
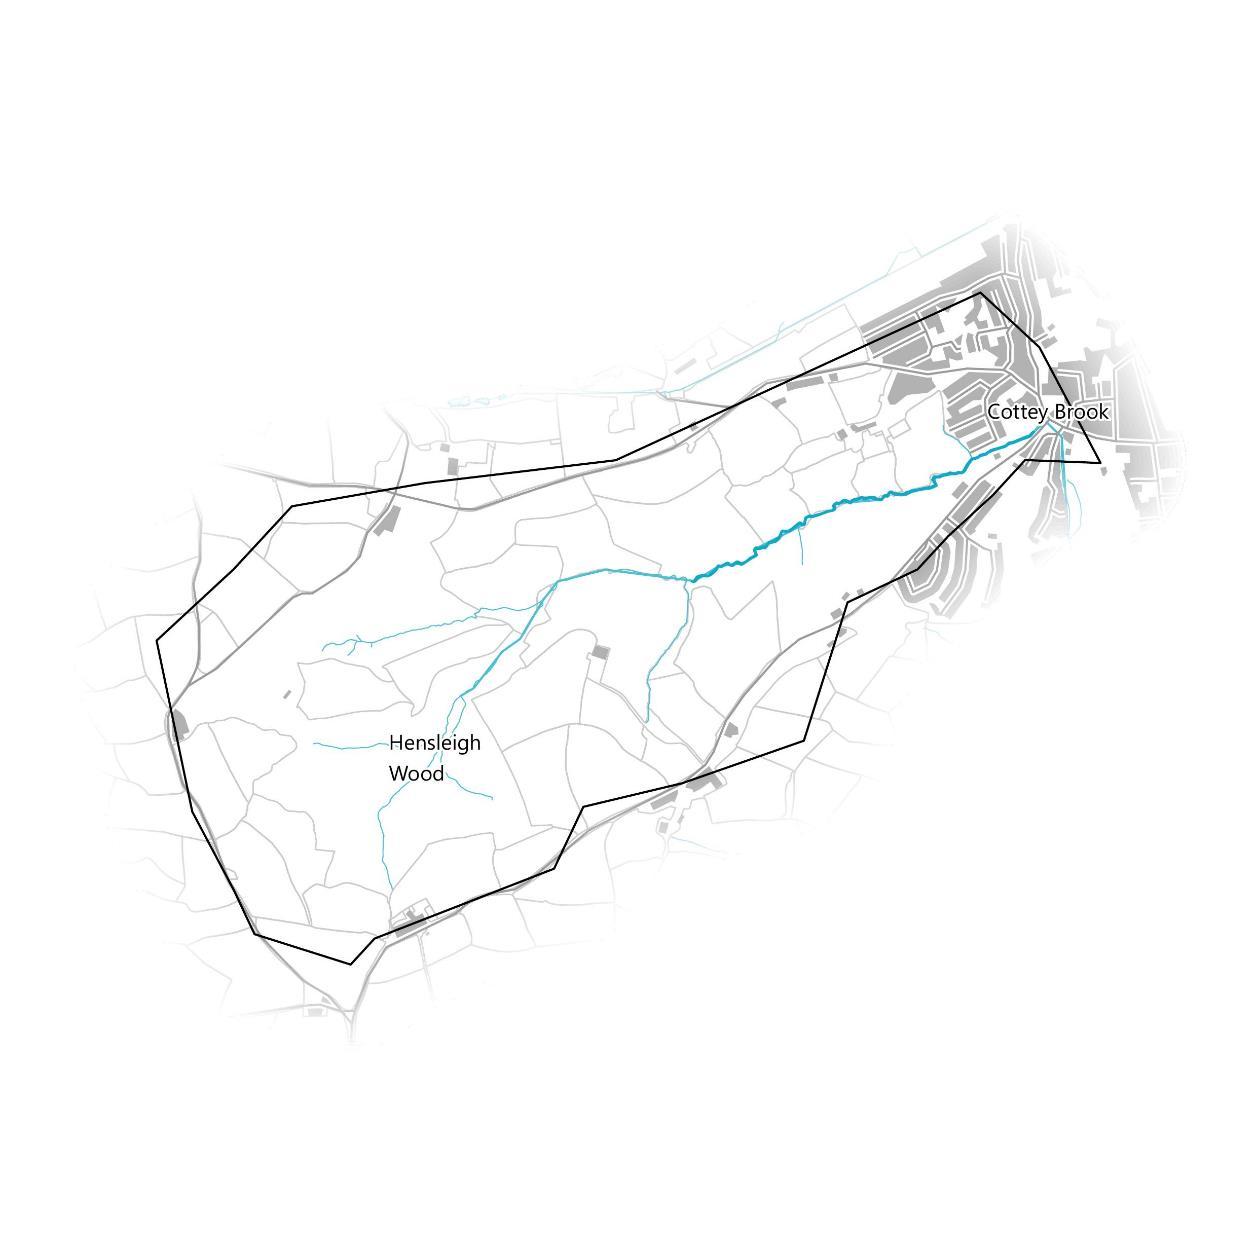
Multiple reasons for the possible causes and remedies for flooding in the micro-catchment for the Tiverton Cottey Brook have been mapped in this study, as have other factors that are key to consider when making NFM decisions.
It is likely that a combination of causes are at play here contributing to there being properties at flood risk, including the topography, land use and absence of habitats in certain areas of the catchment, however the flood risk may not be as high as modelled in current circumstances. That is not to say that flood risk won’t rise in the future, and that interventions will help future-proof against drought and water quality as well as flooding, but investment may need to be justified further.
Benefits arising from this catchment may also be realized in a larger cumulative context elsewhere downstream.
Given the low perceived risk that has come to light as a result of the survey and alternative areas which have shown higher risk factors, it is recommended that no further action be taken in this catchment at this time unless more information is supplied that causes re-evaluation and increased concern.
The next steps could then be to engage and empower the community in the catchment to discuss and work towards building climate change resilience through some of the opportunities identified in the previous pages. It is imperative that property owners and landowners share perspectives and work together to find solutions agreeable to all sides. Opportunities will provide secondary benefits towards improving the catchment’s WFD ecological status but must be proportional to the risk.
Appendix
Methodology Details
Step 1: Micro-catchment Mapping Method
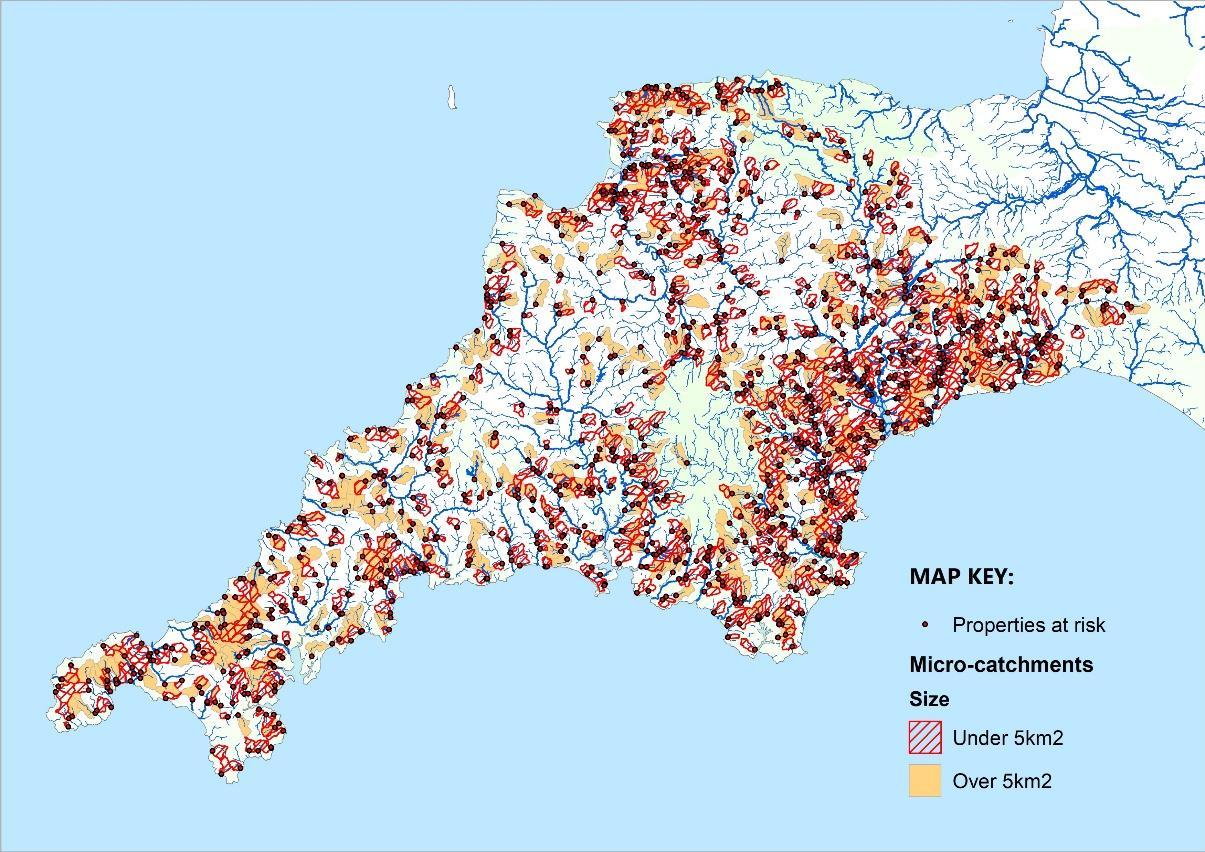
The process for identifying the highest-impacting locations of NFM measures across Devon and Cornwall involved several steps in a Geographic Information System (GIS). The first step was to identify watercourses with an upstream watershed less than 10km2 and less than 5km2 in size, then to identify properties adjacent to these watercourses that overlapped with the Environment Agency’s (EA) fluvial “Flood Zone 2” dataset. Next, pour points were placed on the watercourses in front of the furthest downstream flood risk properties. These pour points were thenused to delineate the upstream micro-catchment boundaries. A total of 1270 micro-catchments with properties potentially at risk were identified across the 2 counties. For every micro-catchment identified, its area was divided by the number of flood risk properties within it to calculate the area per property at risk for each micro-catchment. Those with the lowest area per property indicated higher potential for small-scale NFM measures to benefit the greatest number of flood risk properties. Lastly, additional factors, such as WFD classifications and previous WRT engagement with farmers, were considered alongside the area per property at flood risk to prioritise a small number of micro-catchments to target community engagement and NFM delivery.
Modelling assumptions and constraints: ➢ Due to the large geographic extent (Devon and Cornwall) and the manual element of the mapping (both causing the mapping process to be time-consuming), the resolution/accuracy of some datasets may be compromised. ➢ The buildings dataset (OS VectorMap Buildings) is not as accurate as OS MasterMap - some properties are amalgamated into a single polygon and very small buildings are not shown. Therefore properties at risk of flooding may be underestimated. ➢ Potential flood-risk is identified by selecting building polygons that intersect the flood zones; no detailed local information (e.g. drainage or defences) or modelling has been used. ➢ The spatial resolution of the topography data is coarse (50m). This is used to calculate the upstream catchment area for each community at-risk.
Therefore, some errors may occur (additions or omissions) when identifying micro-catchments. ➢ The mapping method involves an element of manual validation, which has the potential to be subjective and/or possible errors.
Methodology Details
Step 2: Theoretical Ground Truthing
Once catchments were modelled and the information tabulated to show theoretical flood risk in conjunction with WFD failures, a systematic approach to ground-truthing was adopted. Catchments that were perceived to have elevated water quality and water quantity risks were discussed with local land management advisors and regulators to determine if the modelled risk was likely to be correct. Upon a theoretical, or desk-based ground-truthing, the catchments were then surveyed using a rapid walkover survey to observe run-off pathways and confirm if useful managed interventions could be implemented to reduce flood risk locally and improve water quality in the process.
Step 3: Rapid Walkover Survey
A further modelling process using SCIMAP was undertaken to identify high risk run-off pathways of the specific micro-catchment being surveyed to assist the surveyor in locating issues within a <10km2 area. Where possible, surveyors reacted to high rainfall predictions and went out to observe the catchment when the conditions were right. Walkover surveys were undertaken noting observations about surface water run-off and taking photographs of key areas and issues. All walkovers aimed to provide:
➢ Dry or Wet weather photos, ➢ Identify stakeholder PROVIDERS where NFM can be instigated, ➢ Identify stakeholder BENEFICIARIES by property and number people, ➢ Establish opportunities in each catchment and feasibility of action.
Georeferenced photos were taken to provide a visual overview of issues, opportunities, and as general reference notes. Where issues and opportunities existed, further investigation was made or attempted to establish the realistic chances of further action. This was achieved by either speaking with the local community or contacting community groups or key landowners. All 1270 micro-catchments with properties potentially at risk were identified across the 2 counties.
References and fur ther information
Reference
CIRIA (Slide 43)
FRFW (Slide 32)
SEPA NFM Handbook (Slide 32) Handbook describing various natural flood management interventions and case studies (PDF)
https://www.sepa.org.uk/media/163560/sepa-natural-floodmanagement-handbook1.pdf
Resource description Link
The Construction Industry Research and Information Association’s (CIRIA) Natural Flood Management Manual (C802) (PDF)
https://www.ciria.org /Books/Free_publications/C802F.aspx
Statutory guidance for Farming Rules for Water (FRFW) (Webpages) https://www.gov.uk/government/publications/applying-thefarming-rules-for-water/applying-the-farming-rules-for-water
Mapping Data Sources
Dataset Source Attribution Statement
Agricultural Land Classification Natural England © Natural England copyright. Contains Ordnance Survey data © Crown copyright and database right 2022.
Air Quality Management Areas UKAIR
© Crown copyright and database rights licensed under Defra's Public Sector Mapping Agreement with Ordnance Survey (licence No. 100022861) and the Land and Property Services Department (Northern Ireland) MOU206.
Ancient Woodland Natural England © Natural England copyright. Contains Ordnance Survey data © Crown copyright and database right 2022.
AONB Natural England © Natural England copyright. Contains Ordnance Survey data © Crown copyright and database right 2022. Areas Benefitting from Flood Defences Environment Agency © Environment Agency copyright and/or database right 2018. All rights reserved.Some features of this map are based on digital spatial data from the Centre for Ecology & Hydrology, © NERC (CEH) © Crown copyright and database rights 2018 Ordnance Survey 100024198 Bathing Water Monitoring Locations Environment Agency © Environment Agency copyright and/or database right 2015. All rights reserved. Consented Discharges Country Parks Natural England © Natural England copyright. Contains Ordnance Survey data © Crown copyright and database right 2022. Countryside Stewardship Scheme Agreements Natural England © Natural England copyright. Contains Ordnance Survey data © Crown copyright and database right 2022. Crop Map of England Rural Payments Agency © Rural Payments Agency CRoW Access Land Natural England © Natural England copyright. Contains Ordnance Survey data © Crown copyright and database right 2022. CRoW Registered Common Land Natural England © Natural England copyright. Contains Ordnance Survey data © Crown copyright and database right 2022. Detailed River Network Environment Agency © Environment Agency Crown copyright and databse right 2022. Drinking Water Safeguard Zones (Ground Water) Environment Agency © Environment Agency and/or database rights. Derived from BGS digital data under licence from British Geological Survey copyright NERC. Drinking Water Safeguard Zones (Surface Water) Environment Agency © Environment Agency copyright and/or database right. All rights reserved. Derived from BGS digital data under licence from B Survey ©NERC. Derived from Centre of Ecology and Hydrology data ©CEH ritish Geological
Energy Crop Scheme Agreements Natural England © Natural England copyright. Contains Ordnance Survey data © Crown copyright and database right 2022.
Environmental Stewardship Scheme Agreements
Flood Defences
Flood Zone 2
Greenspaces
Habitat Networks
Hillshade Historic Landfill Sites Natural England © Natural England copyright. Contains Ordnance Survey data © Crown copyright and database right 2022.
Environment Agency © Environment Agency copyright and/or database right 2020. All rights reserved.
Environment Agency © Environment Agency copyright and/or database right 2018. All rights reserved. Some features of this map are based on digital spatial data from the Centre for Ecology & Hydrology, © NERC (CEH). © Crown copyright and database rights 2018 Ordnance Survey 100024198 Ordnance Survey Contains OS data © Crown copyright and database right 2022
Natural England © Natural England copyright. Contains Ordnance Survey data © Crown copyright and database right 2022.
Environment Agency © Environment Agency copyright and/or database right 2018. All rights reserved. Contains information © Local Authorities
Mapping Data Sources
Dataset
Land Parcels
LCM2019 25m Parcels
LNR
MCZ
Source Attribution Statement
Rural Payments Agency © Crown copyright and database rights 2020 OS
Morton, D., Marston, C. G, O’Neil, A. W., & Rowland, C. S. (2020). Land Cover Map 2019 (25m rasterised land parcels, GB) [Data set]. NERC Environmental Centre for Ecology and Hydrology Information Data Centre. https://doi.org/10.5285/F15289DA-6424-4A5E-BD92-48C4D9C830CC
Natural England © Natural England copyright. Contains Ordnance Survey data © Crown copyright and database right 2022.
Natural England © Natural England copyright. Contains Ordnance Survey data © Crown copyright and database right 2022.
National Forest Inventory
National Trails
NATMAPvector Forestry Commission
Natural England
Cranfield University
Nitrate Vulnerable Zones 2021 Combined Environment Agency
National Parks Natural England
Organic Farming Scheme Agreements Natural England
OS Open Datasets
Permitted Waste Sites
Ordnance Survey
Environment Agency
PM2.5 2020 UKAIR
Contains Forestry Commission information licensed under the Open Government Licence v3.0
© Natural England copyright. Contains Ordnance Survey data © Crown copyright and database right 2022.
Soil data © Cranfield University (NSRI) and for the Controller of HMSO 2019 © Environment Agency copyright and/or database right. Derived in part from geological mapping data provided by the British Geological Survey © NERC. Derived in part from data provided by the National Soils Research Institute © Cranfield University. Contains Ordnance Survey data © Crown copyright and database rights 2016. Derived in part from data provided by the Department for the Environment, Farming and Rural Affairs © Crown 2016 copyright Defra. Derived in part from data provided by the Centre for Ecology and Hydrology © NERC. Derived in part from data provided by UK Water Companies. © Natural England copyright. Contains Ordnance Survey data © Crown copyright and database right 2022.
© Natural England copyright. Contains Ordnance Survey data © Crown copyright and database right 2022.
Contains OS data © Crown copyright and database right 2022
© Environment Agency copyright and/or database right 2015. All rights reserved.
© UKAIR crown copyright
Pollution Incidents Environment Agency
Priority Habitat Creation and Restoration Projects Environment Agency © Environment Agency copyright and/or database right 2015. All rights reserved.
Priority Habitat Inventory Natural England
Priority Habitats (Aquatic and Wetlands) Natural England
Priority Roads for Catchment Management of Runoff Highways England
Priority Roads for Catchment Management of Surface Water Highways England
Public Rights of Way Ordnance Survey
Ramsar Natural England
Recorded Flood Outlines Environment Agency
© Natural England copyright. Contains Ordnance Survey data © Crown copyright and database right 2022.
© Natural England copyright. Contains Ordnance Survey data © Crown copyright and database right 2022.
Contains OS data © Crown copyright and database right 2022
© Natural England copyright. Contains Ordnance Survey data © Crown copyright and database right 2022.
© Environment Agency copyright and/or database right 2018. All rights reserved.
Mapping Data Sources
Dataset
RoFSW Extent 1 in 1000
RPA Land Parcels
SACs
SCALGO Live Scheduled Monuments
SCIMAP Flow Pathways
Slope
Source Protection Zones
SPAs
SSSI Units
SSSIs
Vegetation Health Index
Source Attribution Statement
Environment Agency © Environment Agency copyright and/or database right 2015. All rights reserved.
Rural Payments Agency © Crown copyright and database rights 2020 OS
Natural England © Natural England copyright. Contains Ordnance Survey data © Crown copyright and database right 2022.
Historic England © Historic England 2022. Contains Ordnance Survey data © Crown copyright and database right 2022
SCIMAP SCIMAP modelling system - SCIMAP was developed at Durham and Lancaster Universities as part of a NERC grant
TellusSW
Ferraccioli, F.; Gerard, F.; Robinson, C.; Jordan, T.; Biszczuk, M.; Ireland, L.; Beasley, M.; Vidamour, A.; Barker, A.; Arnold, R.; Dinn, M.; Fox, A.; Howard, A. (2014). LiDAR based Digital Terrain Model (DTM) data for South West England. NERC Environmental Information Data Centre. https://doi.org/10.5285/e2a742df-3772-481a-97d6-0de5133f4812 Environment Agency © Environment Agency copyright and/or database right 2016. All rights reserved.
Natural England
Natural England © Natural England copyright. Contains Ordnance Survey data © Crown copyright and database right 2022.
© Natural England copyright. Contains Ordnance Survey data © Crown copyright and database right 2022.
Natural England © Natural England copyright. Contains Ordnance Survey data © Crown copyright and database right 2022.
Centre for Ecology and Hydrology © UK Centre for Ecology & Hydrology
Water Abstraction Licenses
Water Resource Availability and Abstraction Reliability Cycle 2 Environment Agency © Environment Agency copyright and/or database right 2015. All rights reserved. WFD Monitoring Sites Environment Agency WFD River Waterbody Catchments Environment Agency © Environment Agency copyright and/or database right 2015. All rights reserved. WFD River Waterbody Status Environment Agency WIMS Locations Environment Agency Uses Environment Agency water quality data from the Water Quality Archive (Beta) WWNP Datasets Environment Agency © Environment Agency copyright and/or database right 2015. All rights reserved.


