Gavin Tilstone1, Dan Clewley1, Silvia Pardo1, Liz Atwood1, Tom Jordan1, Aser
Mata1, Sarah Breimann1, Malcolm Woodward1, Bethany Wilkinson1, Mathew
Taylor1, Helen Parry1, James Harding1 , Nagur Cherukuru2, Tim Malthus2, Adam Macloed2, Robert Woodcock2, Sam Lavender3, Geoff Smith
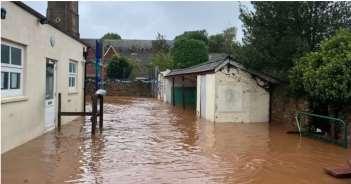
Global warming and flooding.
• Increases in global temperature through climate change,
• Enhances evapotranspiration,
• Causing heavier rainfall,
• which increases the frequency of flooding,
• that impacts livelihoods.
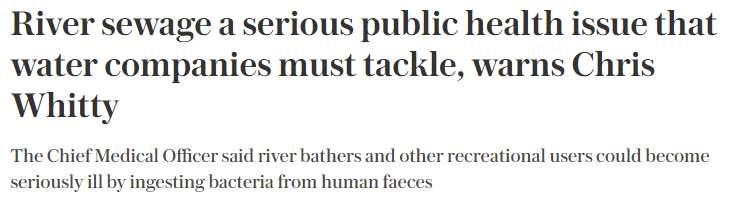
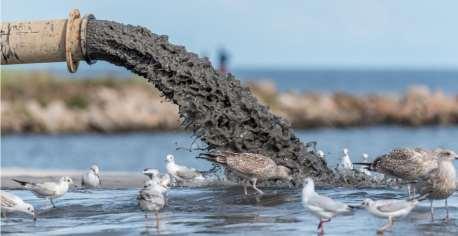
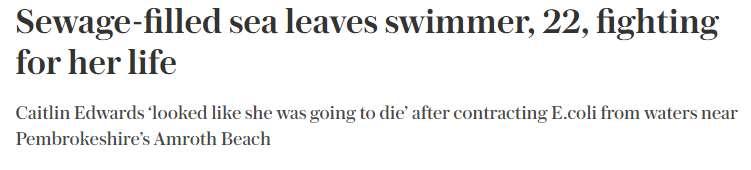
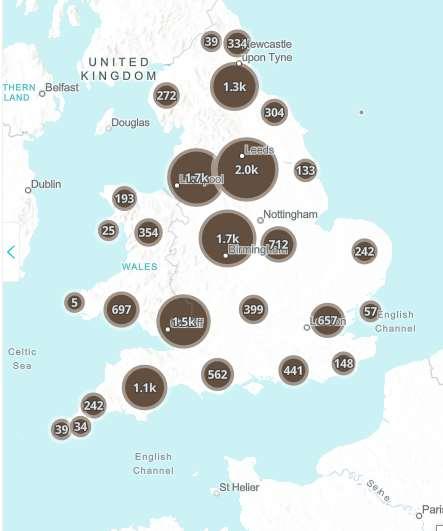
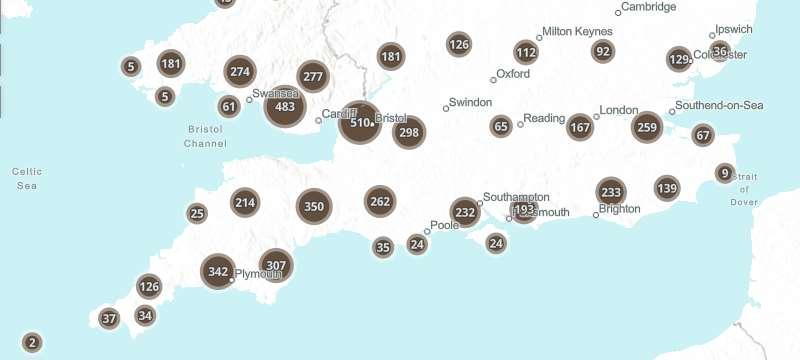
Sewage discharge: Public and nature health risk
into rivers in England & Wales
Key aims.
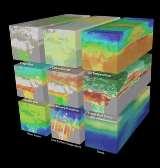
1) This project is using an Open Data Cube to bring together data from in situ samples, automated sensors and multi-source, multi-sensor satellite data for monitoring the water quality in Plymouth Sound, UK.
2) Optical, machine and deep learning algorithms are being applied to the satellite data to facilitate the generation of water quality parameters to address specific environmental case studies on flooding and sewage effluent.
Key outcomes.
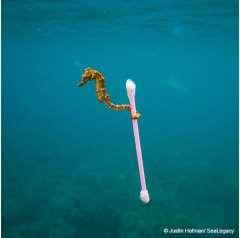
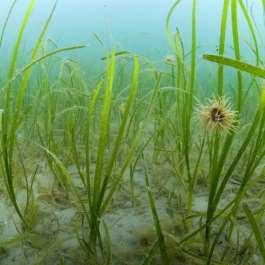
The project case studies are focusing on localised flooding and the effect of sewage effluent and heavy metals washing out of the rivers and onto seagrass beds and mud flats in Plymouth Sound.
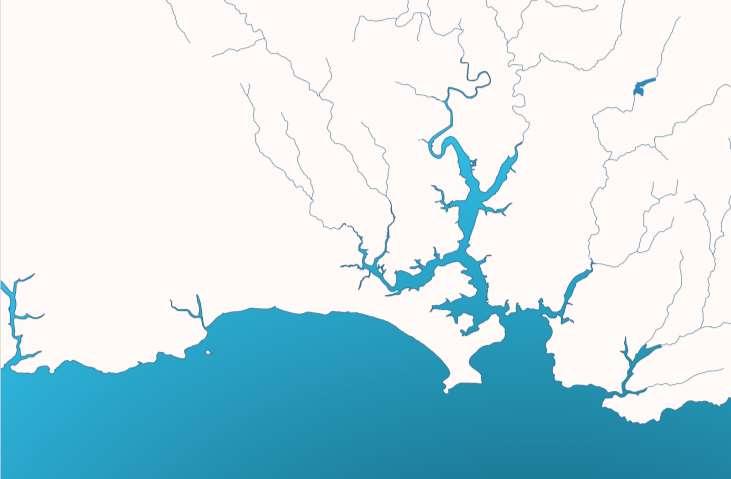
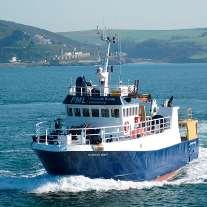
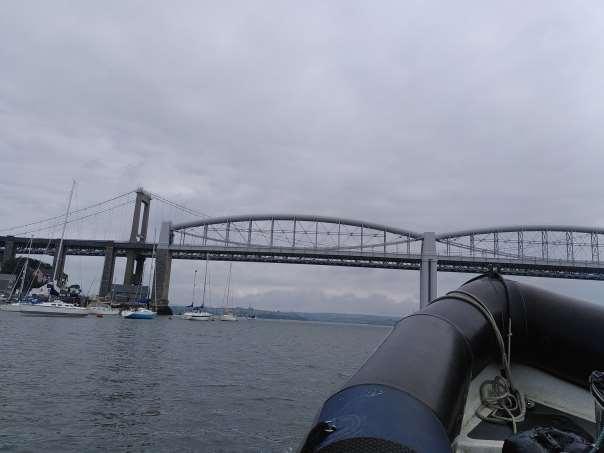
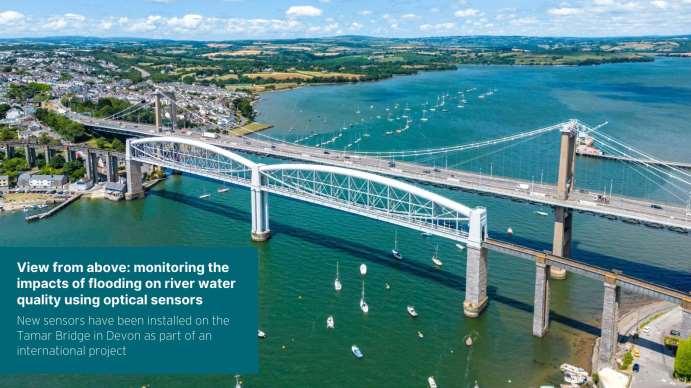
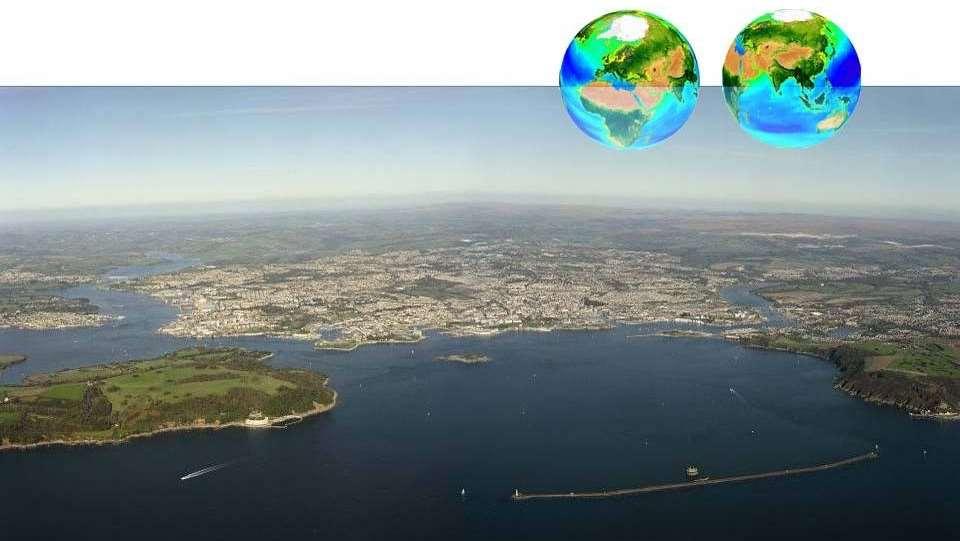
Location: Tamar and Plym Rivers, Plymouth Sound and the western Channel Observatory.
Partners: Plymouth Marine Laboratory, Pixalytics Ltd., Specto-Natura Ltd and CSIRO-Australia.
Funding: UKRI STFC, EO4AgroClimate program. Timeline: Aug 2023–March 2025
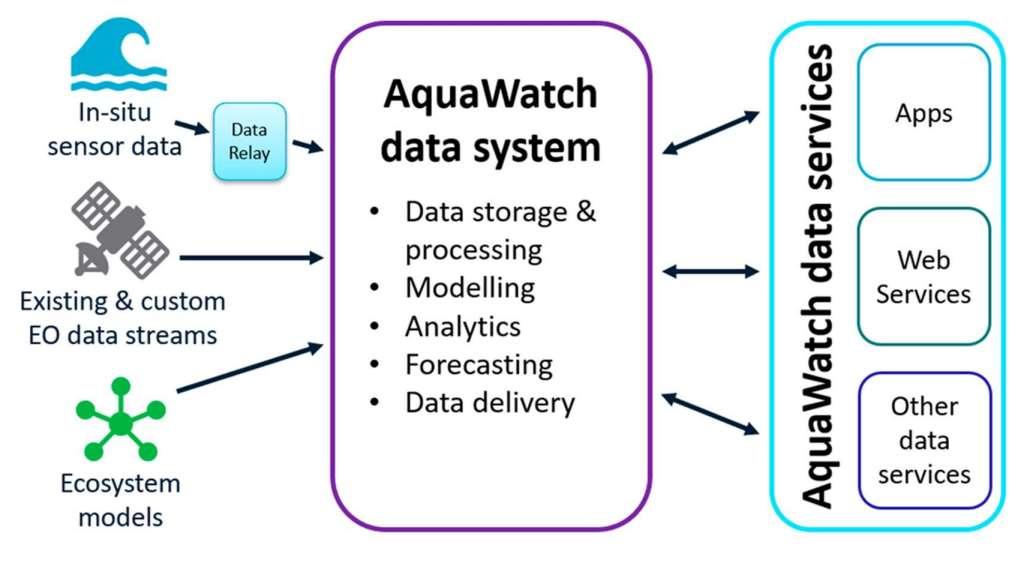
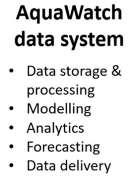
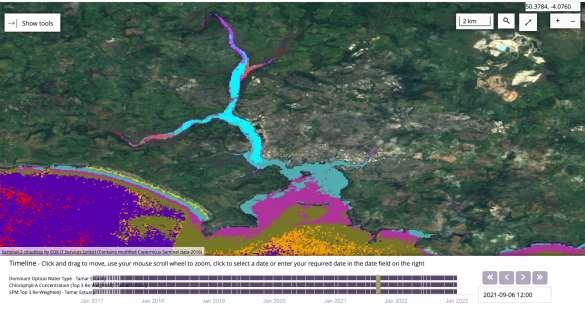
Vis4Sea: AquaWatch Data Integration System
The AquaWatch system is an Australian initiative to improve and forecast water quality monitoring in riverine and coastal systems. Vis4Sea is utilising this system for the Plymouth catchment and western English Channel.
Vis4Sea: Integrating multi-source data
In situ samples
Multi-sensor, high resolution satellite data
Buoy data
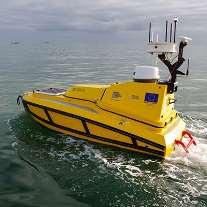
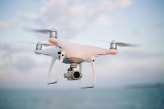
Autonomous vehicles
Optical sensors
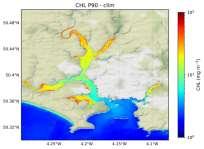
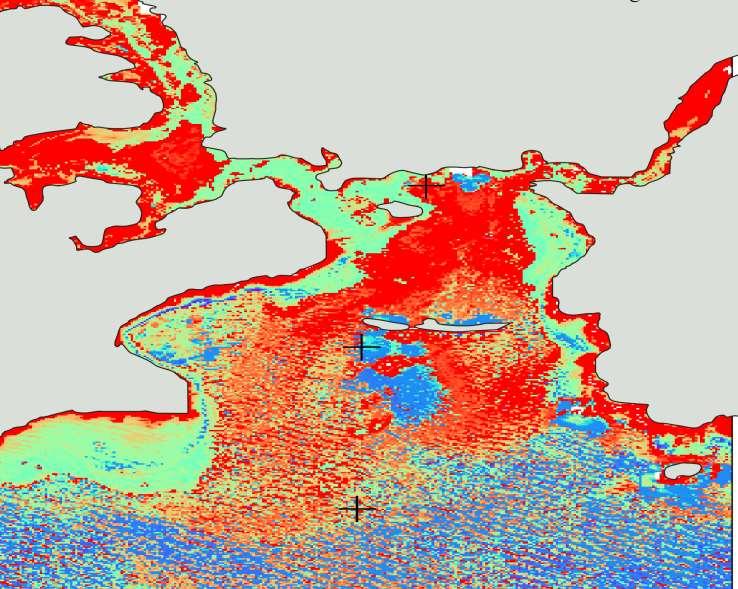
SPM (mg/m 3 )
Optical suspended particulate matter products
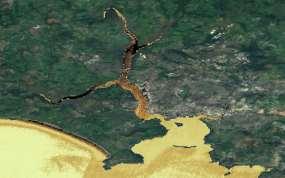
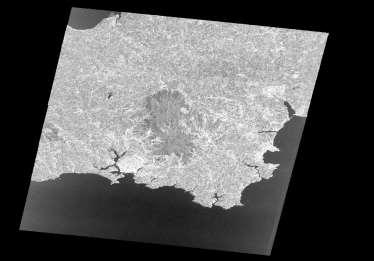
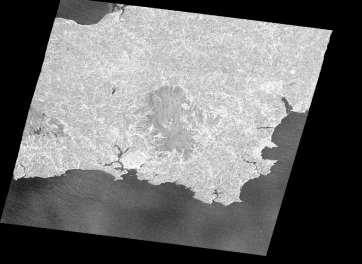
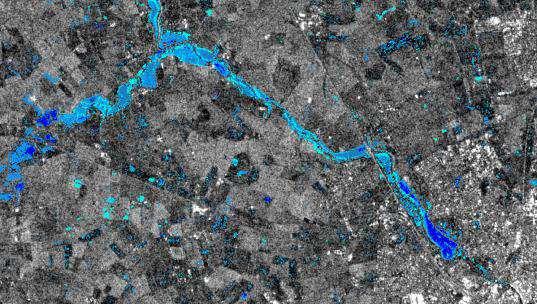
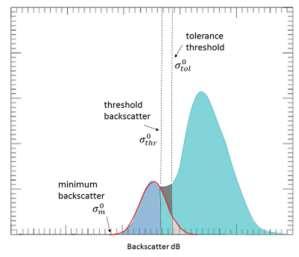
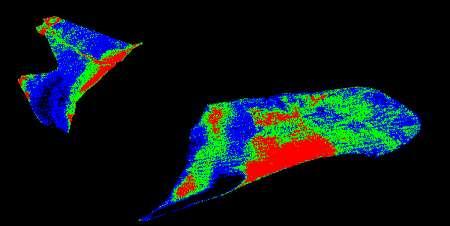
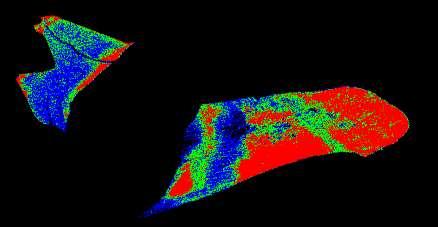
Flood detection from Sentinel-1 & -2
Water extent with Otsu method, derive flooding indicator through imagery time series + rain + river gauge + tide
Sentinel-1A 2023-12-21
Flood detection methods using UN-SPIDER Use of Synthetic Aperture Radar
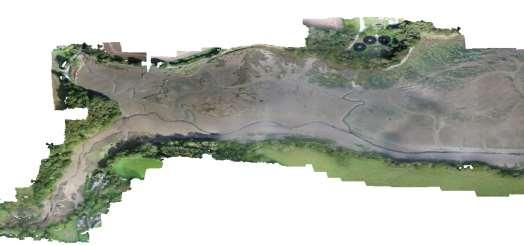
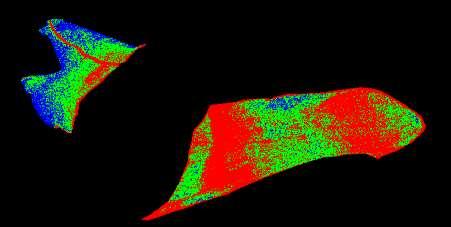
Sentinel-2 map of subtidal, intertidal and supratidal regions
Assess habitat changes before and after flooding events
Seagrass beds
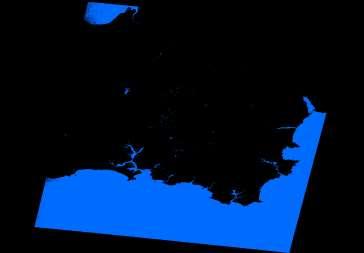
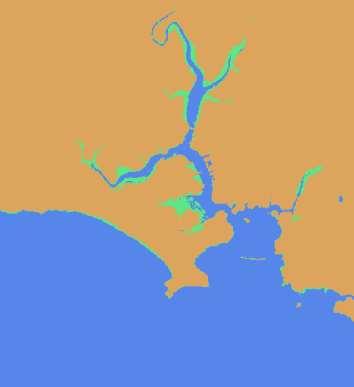
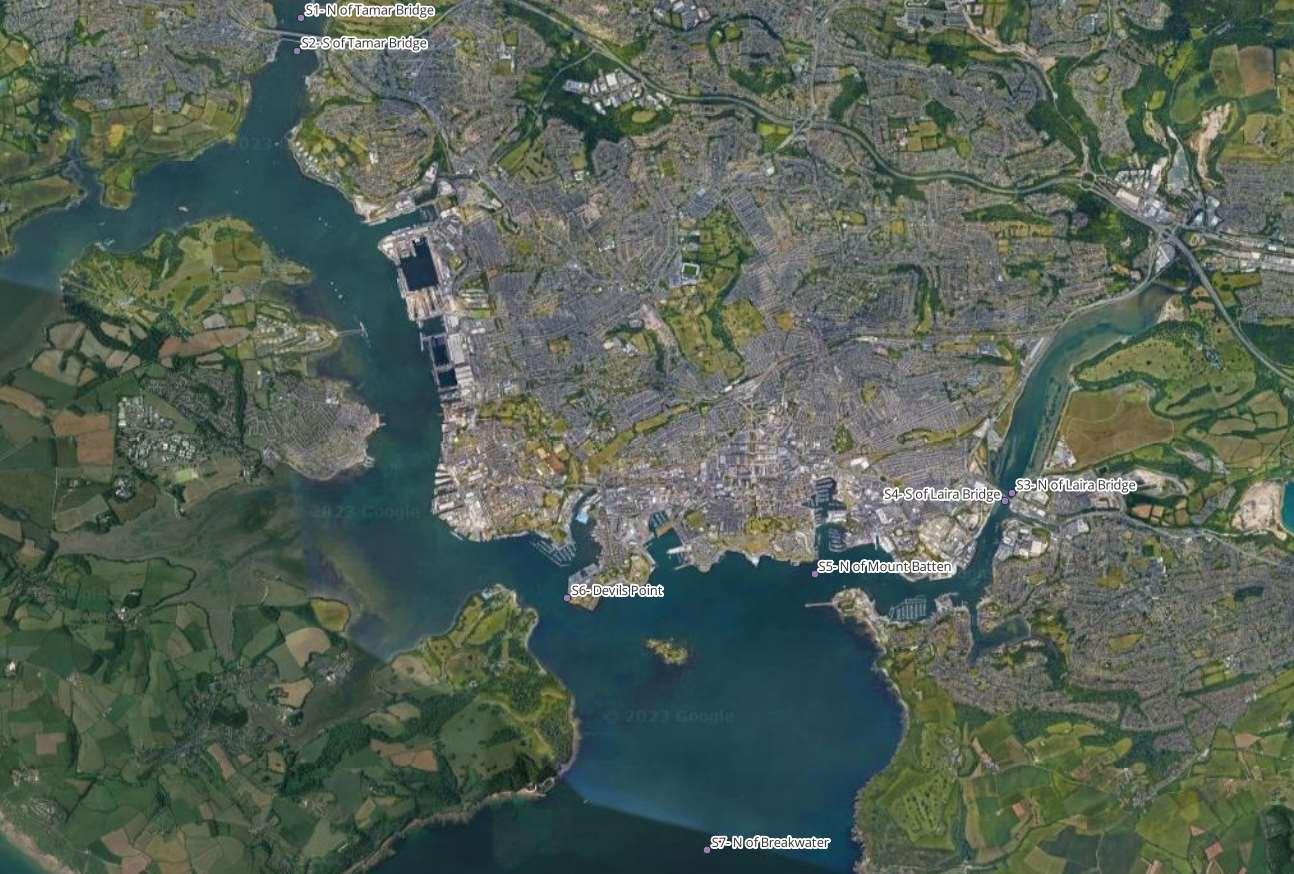
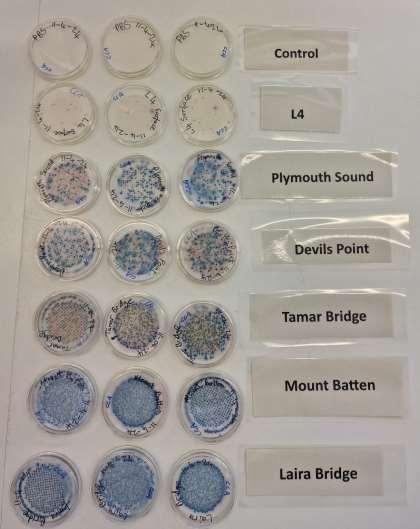
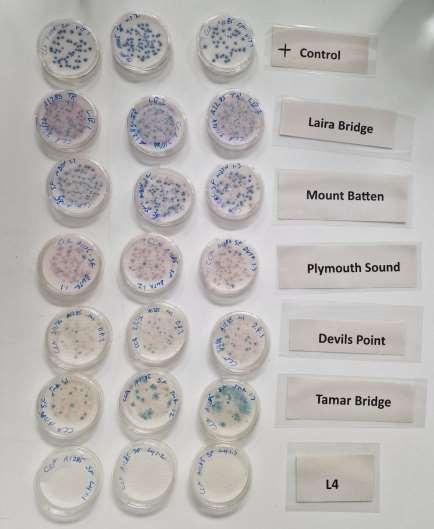
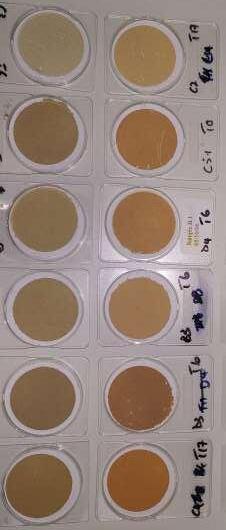
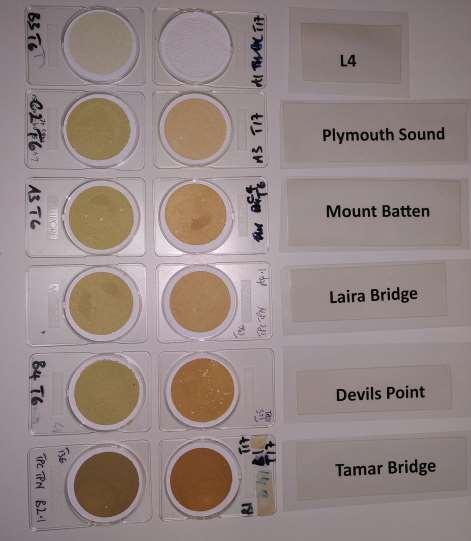
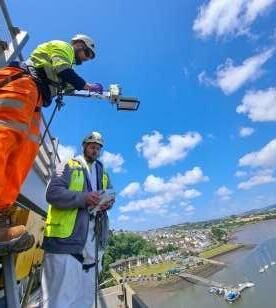
Vis4Sea: In situ sampling sites.
Monthly transects.
From the Tamar and Plym rivers, to the breakwater and onto the Shelf.
TSM increases at bridges during flooding; influenced by tidal cycle at other sites.
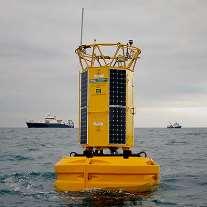
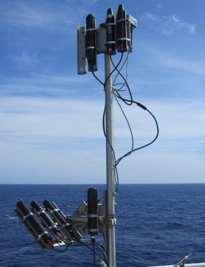
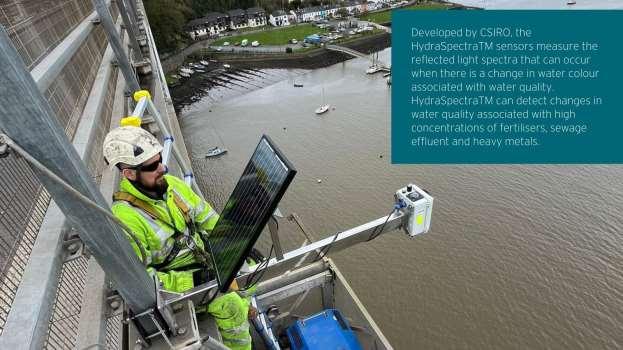
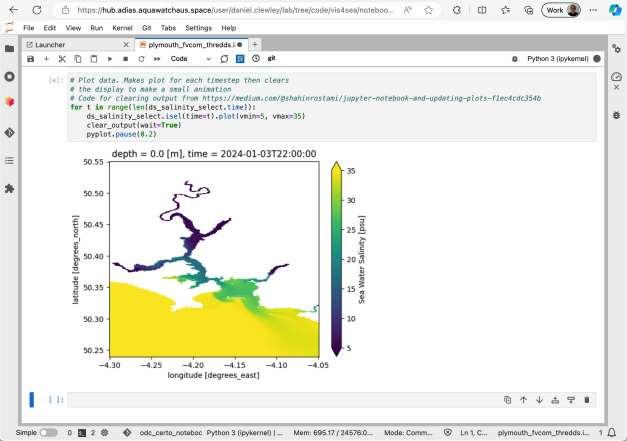
Vis4Sea: Autonomous water quality sensors.
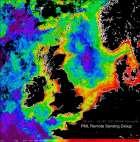
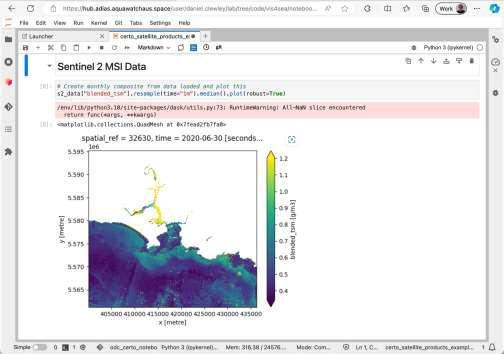
Vis4Sea: Satellite water quality products.
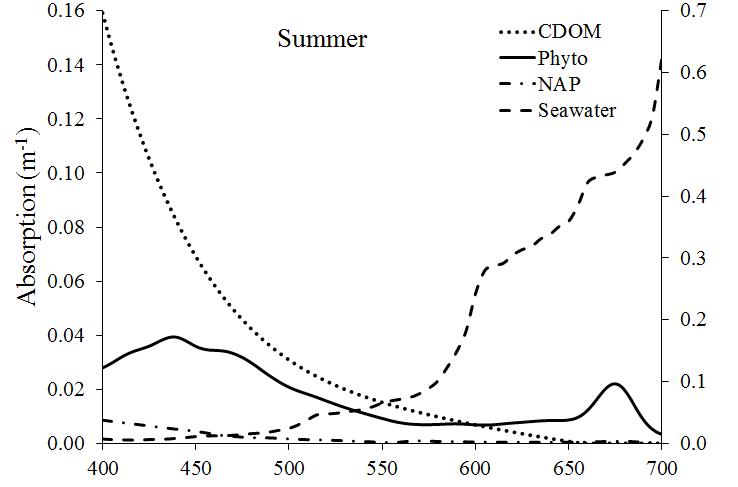
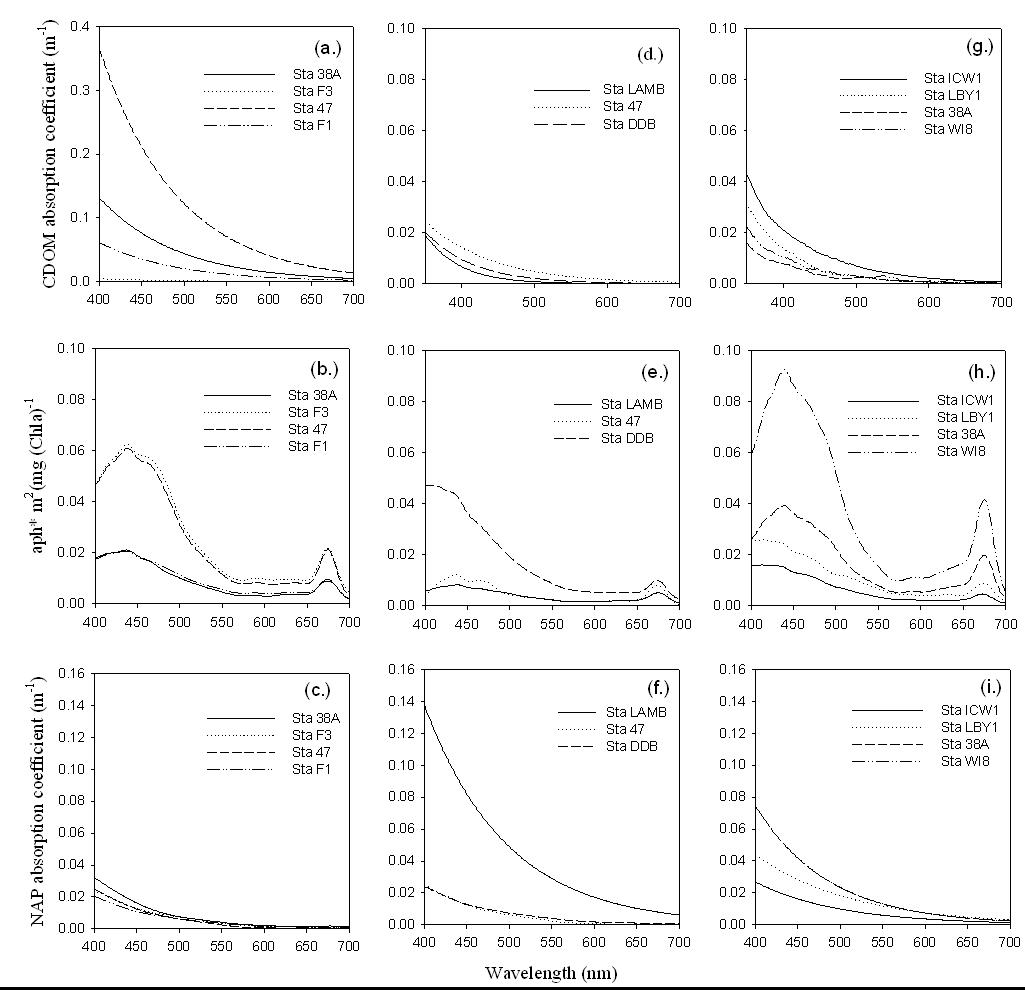
Satellite-based water quality indicators
• Medium (OLCI) and high-resolution (MSI) optical imagery
• Algorithm blending over OWT
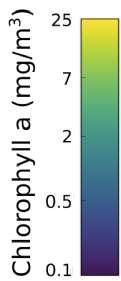
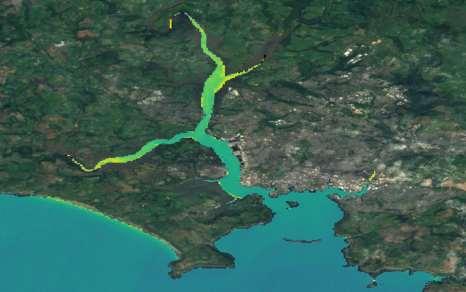
• Chlorophyll-a indicator of algal activity
• Suspended Particulate Matter (SPM) indicator of sediment transport
• SPM algorithms calibrated per OWT
https://engage.certo-project.org/data/
Optical Water Types
Overview
Sunlight entering water interacts with substances within the water (either through absorption or scattering).
A proportion of the sunlight gets backscattered back through the atmosphere and is detected by a satellite as surface relectance.
Optical properties of coastal waters.
Vis4Sea: AI technology for predicting water quality.
• Vis4Sea is mapping water quality using deep learning methods on in situ, drone, automated sensor and satellite data.
• The TSM map shown on the right is generated from a deep learning model constructed for the Australian coast.
• The model is being re-calibrated for the Plymouth coastal catchment using optical data measured for Vis4Sea and applied to Landsat and Sentinel-2 satellite data.
TSM concentration, August 2023.
Example Vis4Sea Notebooks:
Data has been added to Plymouth area using Landsat standard L2 reflectance (from USGS) and Sentinel 2 L2 (sen2cor).
• Scripts written, using eodatasets3
• Added to project Git Repo
Downstream effects: Case studies.
1. Assessment of the effects of sewage and heavy metals on seagrass beds.
2. Assessment of the effects of sewage and heavy metals on intertidal surfaces.