3 minute read
Workforce Overview
Oakland County 2021 LABOR FORCE, EMPLOYMENT, AND UNEMPLOYMENT
CENSUS 2020 LABOR FORCE DEMOGRAPHICS
Following labor force fluctuations throughout 2021, labor force participation totaled 649,405 individuals, a decrease of 6,020 individuals since 2020. Employment is up to 621,944 workers in 2021, an increase of 28,775 workers. Both unemployment and the unemployment rate decreased, corresponding with the economic recovery. Unemployment decreased to 21,441 workers, down by 34,796 workers since the high of 56,237 workers recorded in 2020. Similarly, the unemployment rate declined by 5.3 percentage points for a 2021 unemployment rate of 3.3 percent.
Annual Labor Market Data 2011-2021
Data: Bureau of Labor Statistics
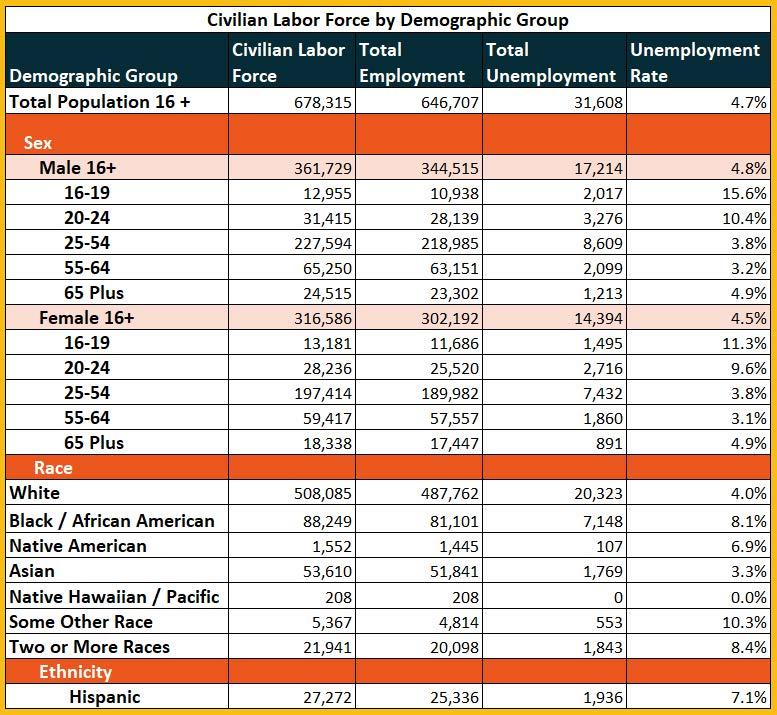
During 2020, the most recent census year, there were about 678,315 individuals in the labor force, meaning they were either working or looking for work, in Oakland County. Slightly more than half of the population, 646,707 individuals (51.5 percent) living in the county were actively working. The highest unemployment rates were seen in those aged 24 years old or younger. Males under the age of 25 face an unemployment rate of 26.0 percent, compared to females under the age of 25 reporting an unemployment rate of 21.0 percent.
POPULATION DEMOGRAPHICS
2020 Census Population
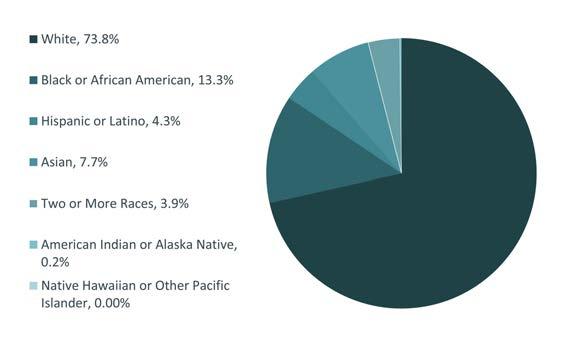
According to data from the most recent Census Bureau 2020 ACS Five Year estimates, the population in Oakland County increased by about 0.2 percent between 2019 and 2020. During 2020, 1,255,340 people were living in the county. The sex of the populace was split almost evenly, with about 51.0 percent of the population identifying as female, and the other 49.0 percent identifying as male. Majority of the population identified as white (73.8 percent) with the second largest number of individuals identifying as Black or African American (13.3 percent). The region is facing an aging population; 31.1 percent of population was over the age of 54, compared to 29.1 percent under the age of 25.
2021 Current Workforce
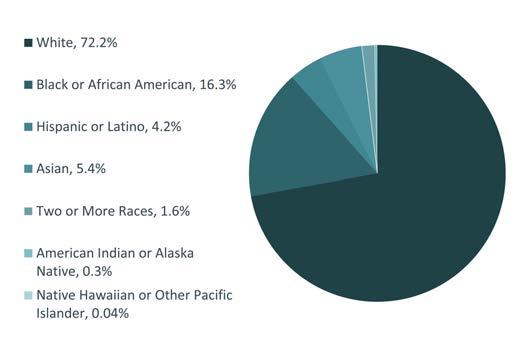
In 2021, the workforce had a total of 691,180 individuals working in Oakland County. A slight majority, 51.1 percent (355,181 workers) were male, while 48.9 percent (339,813 workers) of the workforce was female. Most workers in the county identified as white, accounting for 72.2 percent of the workforce, while Black or African American workers totaled 16.3 percent of the workforce. Those identifying as having a Hispanic or Latino ethnicity accounted for 4.2 percent. Much of the workforce in Oakland County are between the ages of 25 through 54 (64.7 percent), while 22.9 percent of workers are 55 and older.
Population Gender Demographics
51.0% Female 49.0% Male
48.9 Female 51.1 Male
Workforce Race and Ethnicity Demographics

REGIONAL COMMUTING PATTERNS
According to the most recent OnTheMap data set available from the Census Bureau, during 2019, Oakland County's workforce consisted of 568,442 residents. There were 323,035 (56.8 percent) residents living and working within the county, while the remaining 245,407 residents (43.2 percent) traveled outside of the county for work. There were 730,192 workers employed in the county during 2019. Of those, 407,157 workers (55.8 percent) lived outside of the county's borders and commuted in. From this information, we can see that Oakland is a net importer of jobs, with more workers entering the area for employment than outwardly commuting.
Where Oakland County Residents Work Where Oakland County Workers Live
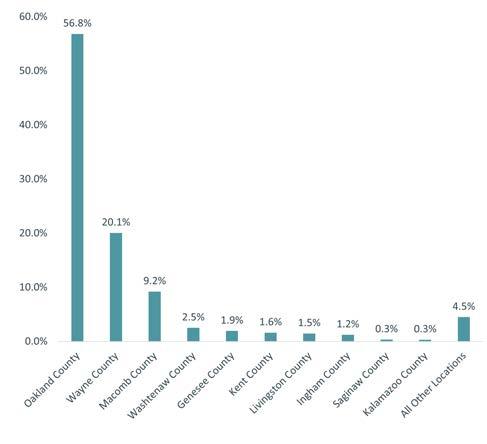
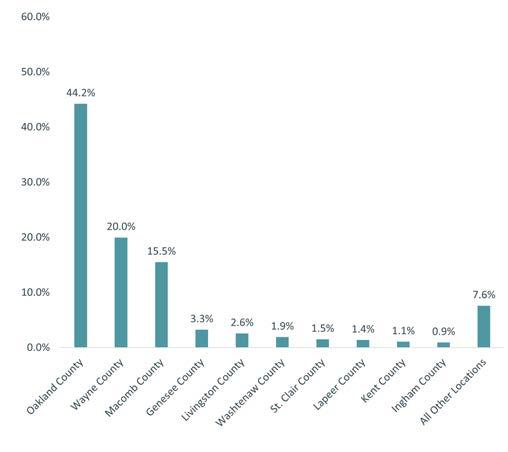
Source: U.S. Census OnTheMap, 2019 Analysis: Workforce Intelligence Network Source: U.S. Census OnTheMap, 2019 Analysis: Workforce Intelligence Network
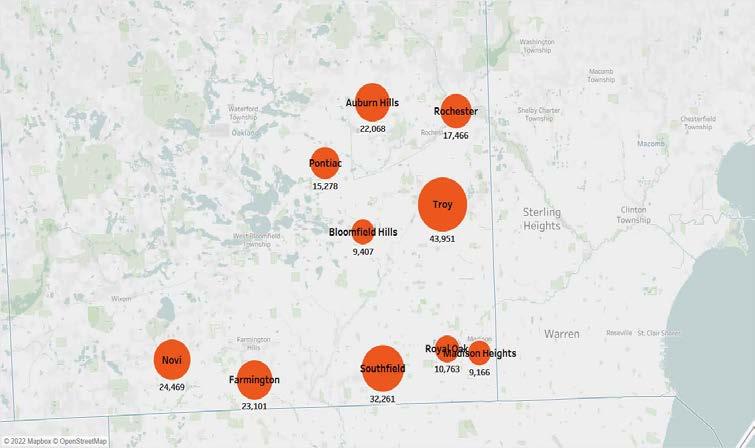
Job Postings by City
1. Troy: 43,951 Postings 2. Southfield: 32,261Postings 3. Novi: 24,469 Postings 4. Farmington: 23,101 Postings 5. Auburn Hills: 22,068 Postings 6. Rochester: 17,466 Postings 7. Pontiac: 15,278 Postings 8. Royal Oak: 10,763 Postings 9. Bloomfield Hills: 9,407 Postings 10.Madison Heights: 9,166 Postings
