3 minute read
Workforce Overview


LABOR FORCE, EMPLOYMENT, AND UNEMPLOYMENT
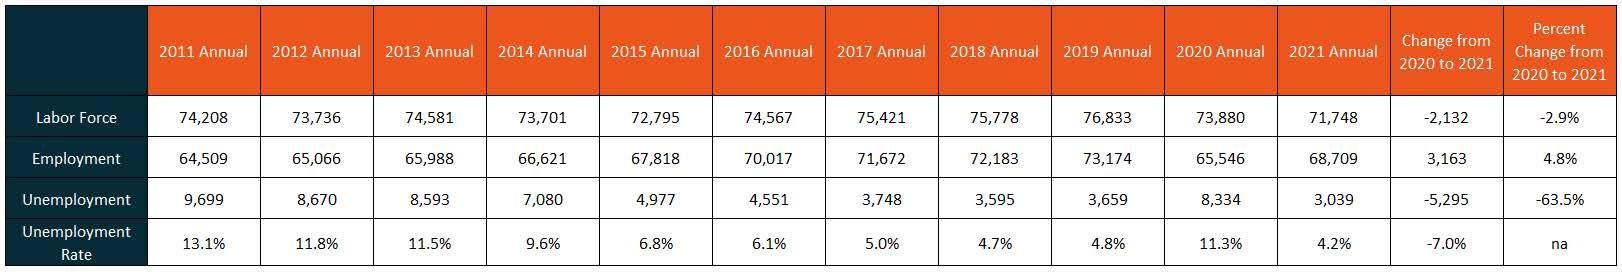
Following labor force fluctuations throughout 2021, labor force participation totaled 71,748 individuals, a decrease of 2,132 individuals since 2020. Employment is up to 68,709 workers in 2021, an increase of 3,163 workers. Both unemployment and the unemployment rate decreased, corresponding with the economic recovery. Unemployment decreased to 3,039 workers, down by 5,295 workers since the high of 8,334 workers recorded in 2020. Similarly, the unemployment rate declined by 7.0 percentage points for a 2021 unemployment rate of 4.2 percent.
Annual Labor Market Data 2011-2021
Data: Bureau of Labor Statistics
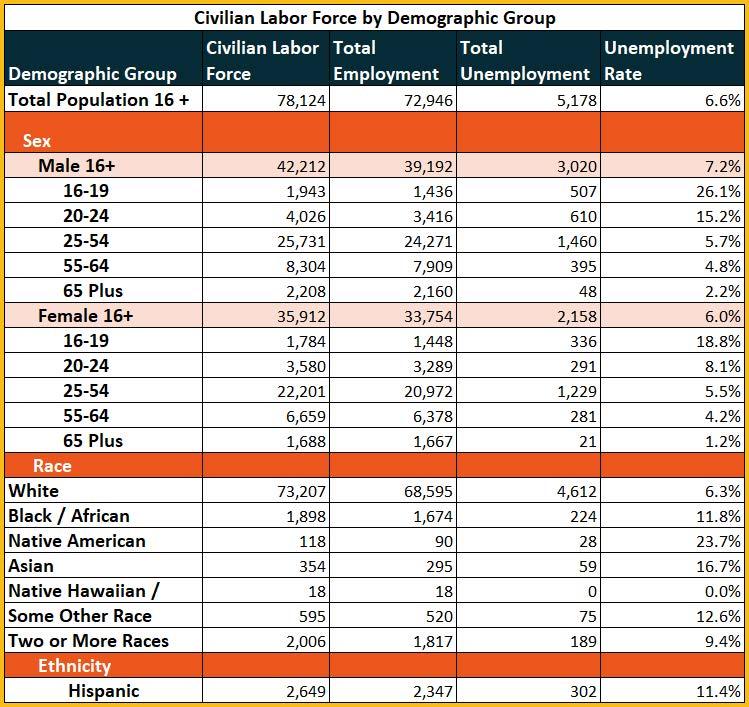
CENSUS 2020 LABOR FORCE DEMOGRAPHICS
During 2020, the most recent census year, there were about 78,124 people in the labor force, meaning they were either working or looking for work, in St. Clair County. Slightly less than half of the total population, or 72,946 individuals (45.8 percent), living in the county were actively working. The highest unemployment rates were seen in those aged 24 years old or younger. Males under the age of 25 face an unemployment rate of 41.2 percent, while females under the age of 25 face an unemployment rate of 27.0 percent. Native American job seekers also have a difficult time finding employment, facing an unemployment rate of 23.7 percent.
2020 Census Population
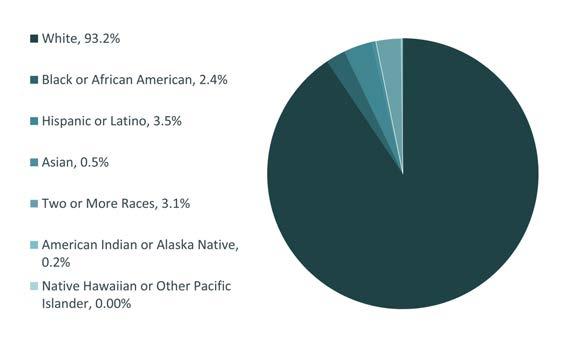
According to data from the most recent Census Bureau 2020 ACS Five Year estimates, the population in St. Clair County increased by about 0.02 percent between 2019 and 2020. During 2020, 159,285 people were living in the county. The sex of the populace was split almost evenly, with about 50.3 percent of the population identifying as female, and the other 49.7 percent identifying as male. Majority of the population identified as white (93.2 percent) with the second largest number of individuals identifying as Hispanic or Latino (3.5 percent). The county is facing an aging population; 34.5 percent of the population was over the age of 54, compared to 28.8 percent under the age of 25.
2021 Current Workforce
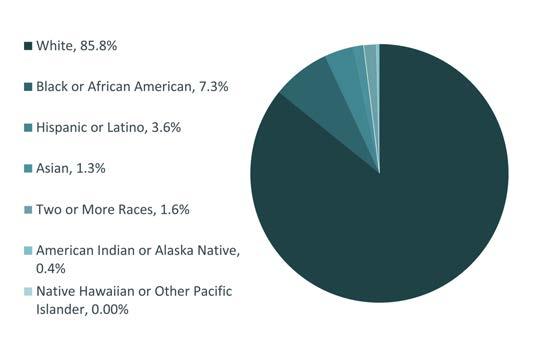
In 2021, the workforce had a total of 42,075 individuals working in St. Clair County. A slight majority, 50.4 percent (21,282 workers) were male, while 49.6 percent (20,912 workers) of the workforce was female. Most workers in the county identified as white, accounting for 85.5 percent of the workforce, while Black or African American workers totaled 7.3 percent of the workforce. Those identifying as having a Hispanic or Latino ethnicity accounted for 3.6 percent. Much of the workforce in St. Clair County are between the ages of 25 through 54 (61.2 percent), while 24.1 percent of workers are 55 and older.
Population Gender Demographics
49.6% Female 50.4 Male
Population Race Demographics
Population Age Demographics Workforce Race and Ethnicity Demographics
Workforce Age Demographics

REGIONAL COMMUTING PATTERNS
According to the most recent OnTheMap data set available from the Census Bureau, during 2019, the county's workforce consisted of 72,507 residents. There were 26,920 (37.1 percent) residents living and working within St. Clair County, while the remaining 45,587 residents (62.9 percent) traveled outside of the county for work. There were 41,152 workers employed in the county during 2019. Of those, 14,232 workers (34.6 percent) lived outside of the county and commuted in. From this information, we can see that St. Clair is a net exporter of jobs, with more workers leaving the area for employment than inwardly commuting.
Where St. Clair County Residents Work Where St. Clair County Workers Live
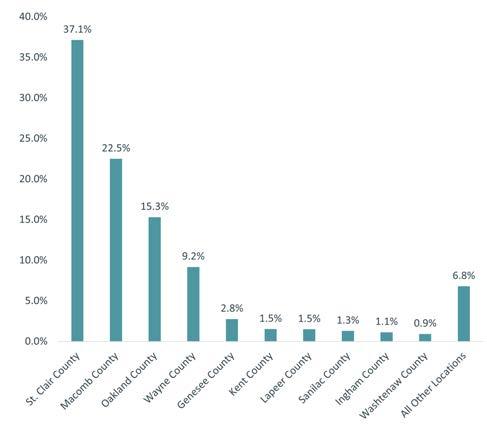
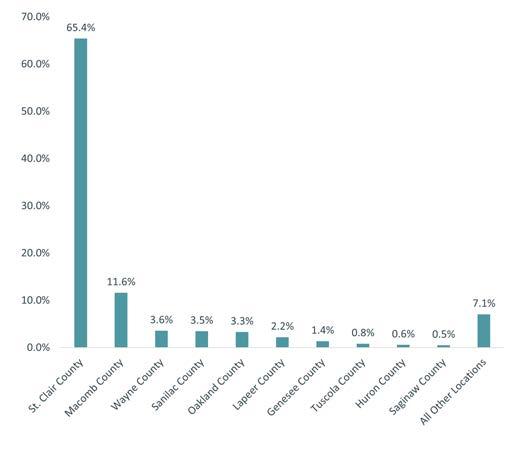
Source: U.S. Census OnTheMap, 2019 Analysis: Workforce Intelligence Network Source: U.S. Census OnTheMap, 2019 Analysis: Workforce Intelligence Network
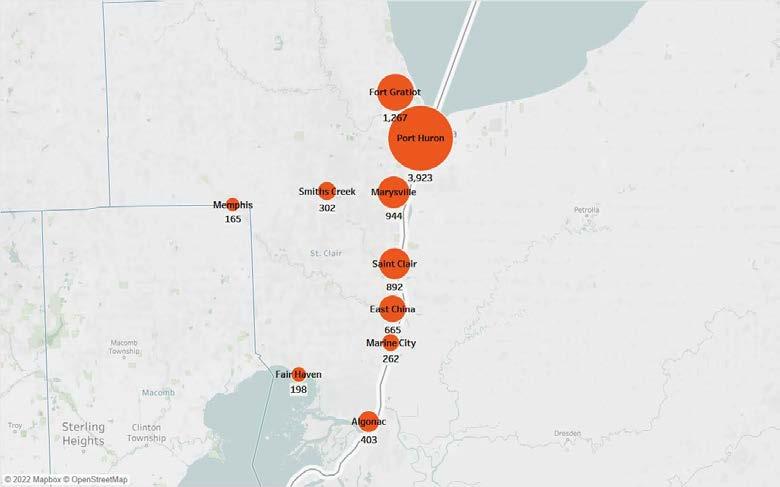
Job Postings by City
1. Port Huron: 3,923 Postings 2. Fort Gratiot: 1,267 Postings 3. Marysville: 944 Postings 4. Saint Clair: 892 Postings 5. East China: 665 Postings 6. Algonac: 403 Postings 7. Smiths Creek: 302 Postings 8. Marine City: 262 Postings 9. Fair Haven: 198 Postings 10. Memphis: 165 Postings