QUARTERLY WORKFORCE INDICATORS
3
16-County WIN Region | Key Findings for Q1 2020
Employer demand sinks to 315,000 jobs posted during Q1 2020, reflecting both an overall pattern of slowing demand and the earliest results of COVID-19 shutdown measures.
Posting Trends by Occupation Group Q1 2020
During Q1 2020, there were 315,434 job postings, 18,311 fewer than the 333,745 postings made during Q4 2019 in the 16-county WIN region. Though postings are often lower in the first half of the year than the second, Q1 2020 demand levels were also 8.6 percent lower than in Q1 2019. Seasonal changes in job postings for each occupation group throughout 2019 and the first quarter of 2020 can be seen to the right, showing early divergences in the way different occupation groups are affected by the COVID-19 pandemic. Note that some of the consistent decline in TDL postings is related to improvement in duplicate posting removal methodology. For more information about quarterly job postings, see page 9.
Job postings made by employers in southeast Michigan indicate that about 59 percent of job openings were available to workers with two years of experience or less.
Experience Levels In-Demand Q1 2020
Just over half, or 59 percent of all Q1 2020 job postings identified a preferred worker experience level, and nearly half (44.7 percent) of those sought candidates with zero to two years of experience. As ongoing safety measures, economic downturn, and recovery continue to reshape the labor market in coming months, employer willingness to hire and train inexperienced workers will benefit both recent grads and those looking to change industries alike. The proportion of entrylevel postings requiring college degrees, about 41 percent, mirrors the requirement among postings for all experience levels. The Engineers and Designers, IT, and Business and Finance groups most frequently a bachelor’s degree. For more information about in-demand education and experience levels, see each occupation group’s section.
Annual Labor Market Data Data: Bureau of Labor Statistics
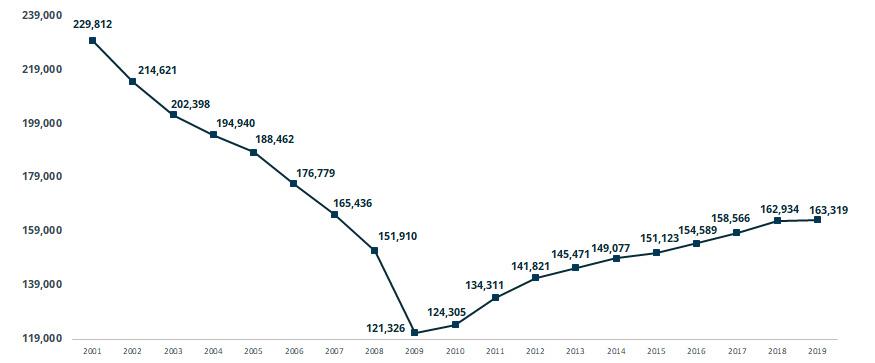
During the first quarter of 2020, employment in the 16-county WIN region dropped by 19,618 workers. Following a strong trend of growth in the labor force both quarterly through 2019 and annually since 2011, as well as consistently falling unemployment, the first quarter of 2020 showed beginning decline in the labor market. During Q1 2020, labor force figures were 0.1 percent smaller (1,515 individuals) than in Q4 2019, but 0.4 percent greater (11,689 individuals) than in Q1 2019. The decrease in labor force participants was joined by a 19,618-worker drop in employment compared to Q4 2019. The greater decline in employment than in labor force caused the unemployment rate to rise from 3.5 percent in Q4 2019 to 4.2 percent in Q1 2020. For more information about this year’s unemployment rate and other labor market indicators, see page 4. Data: Emsi | Analysis: Workforce Intelligence Network


