1 minute read
Evaluation.Toolkit


London, United Kingdom
Client:
Advertisement
Project Team:
Gruner&Friends
March 2021
Wojciech Karnowka Calvin Sin
The Evaluation Toolkit comprises tools commissioned by Gruner&Friends, a small practice based in Switzerland, to provide reliable analytical capabilities for architectural proposals during the early design phases.

Collaborating on prior concepts like CHAM and Borgot Miranda, the office management realised that the analysis methods developed were pertinent not only to those projects but also to many early-stage designs. The project involved creating a toolkit within Rhino, scripted using Grasshopper and Python. It included a user interface catering to non-technical users, enabling analysis of designed massings.
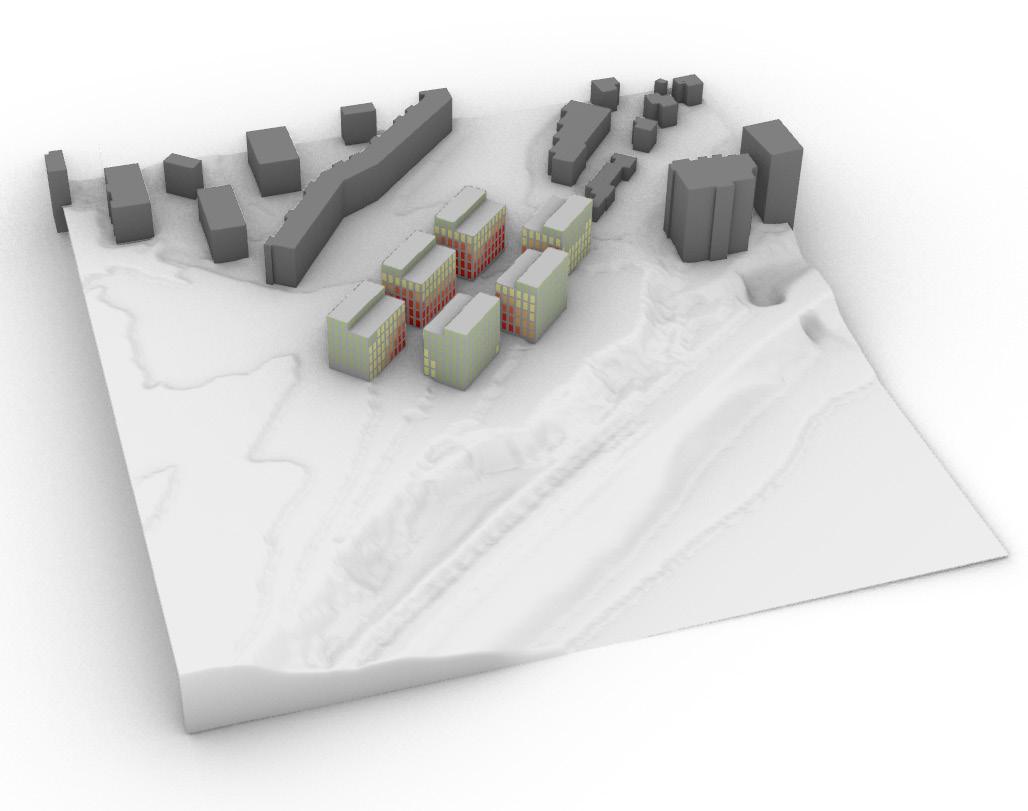
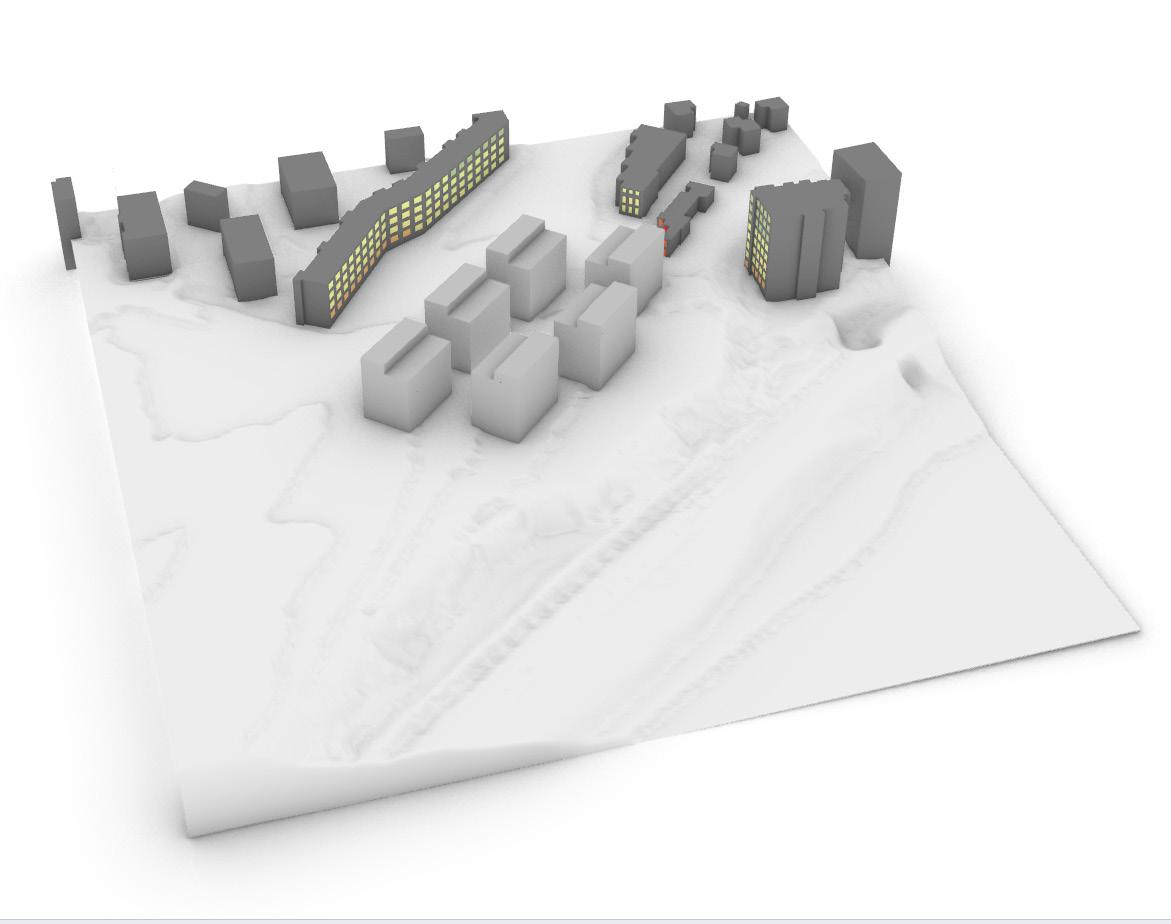
The toolkit encompassed tools focusing on Daylight (both proposed and existing), Visibility, Area, and Topography characteristics. In collaboration with german-speaking architect, we established benchmarks and parameters for testing against Swiss building codes and compliance.
Since its inception, the toolkit has become widely utilised within the office to enhance efficiency. It has also been showcased during office presentations and at the University of Applied Sciences Northwestern Switzerland (FHNW).
Windows Orientation Analysis
Toolkit Header
Refresh Button
Every time Rhino geometry is modified, the script requires a refresh. The button will also reset the analysis.
Subtitle
Tab Name
Name used for analysis export. The default name will copy the current Rhino file name.
Define Project Path
Directory for analysis export. The default directory is the current Rhino file path.
Save Visibility Mode
Before analysis begins, the user can save the layers state. Once the project path is set, the script will hide all layers beside ‘Visualisation’; this is to provide controlled and consistent visualisation. Once the path is reset, the script will restore the visibility to that saved layer state.
Analysis Geometry Section
Settings - Analysis Specific
Set analysis specific settings.
Analysis - Activate Section
Toggle activates the analysis; once switched on, the results tab will appear, displaying analysis results and export options.

Display Settings Section
Controls visibility/graphic setting of Rhino also allows displaying north direction.


