4 minute read
Revisiting 100-year-old Research Plots
By Steve D’Eon, Renfrew and County Chapter • steve.deon@canada.ca
At the Canadian Forest Service’s Petawawa Research Forest (PRF) some of the 200+ Permanent Sample Plots (PSPs) have been continuously monitored and measured for 100 years. These centurions have recorded a century of forest processes, growth, mortality, and management impacts. PSP001 is the oldest continuously monitored forest research plot in Canada (Figure 1).
Advertisement
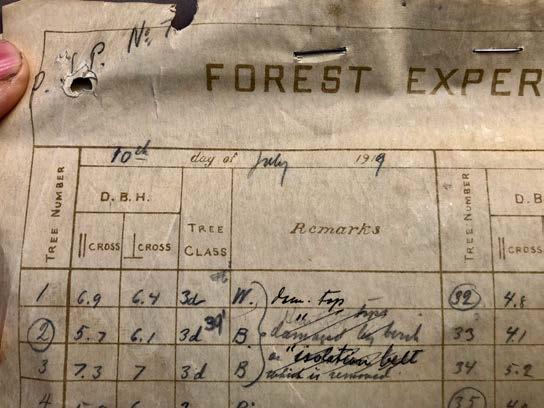
Figure 1: PSP001, established in 1918, was part of the Canadian Institute of Forestry 2019 Annual General Meeting field tour. Figure 3: PSP007 tally sheet dated July 10, 1919.
Pencils and paper were the tools of the trade during this era. The original tally sheets, the paper now brittle and showing its age, have survived multiple trips out to the bush (Figure 3). As the PSP series grew upkeep of plot infrastructure, as well as periodic measurements, became a right-of-passage for students at Petawawa each summer.
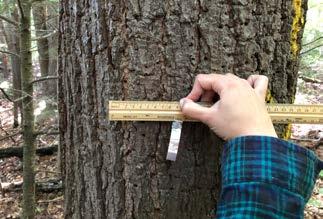
Thinking back, one realizes measurements made in 1918 and 1919 took place during the Spanish flu pandemic. It was a bit ironic for me to join the PRF’s Melissa Vekeman and Céline Lafrance measuring some centurions this fall; 2020 being during the COVID 19 pandemic. Pandemic aside, it was exciting as we socially distanced our way across a couple of plots using the data to track 100 years of growth and survival of individual trees (Figure 4).

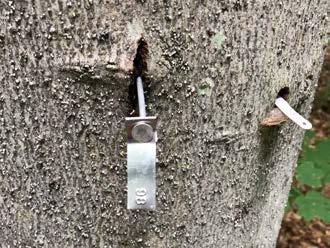
Since 1918 the methodology to establish a PSP has remained the same. A plot is carefully laid out on the forest floor, corner posts are hammered in, and each tree is tagged, measured, and mapped (Figure 2).
b

d Figure 2: a) corner post for PSP010. b) Tree 098’s new tag with the older tag grown over. c) Map of PSP016, 1920. d) numbering trees on a PSP, 1919. Figure 4: Left) measuring the current diameter of PSP016 tree number 410. Right) indicating the 1926 diameter (9.1 cm dbh) of PSP016 tree number 140.

continued next page ...
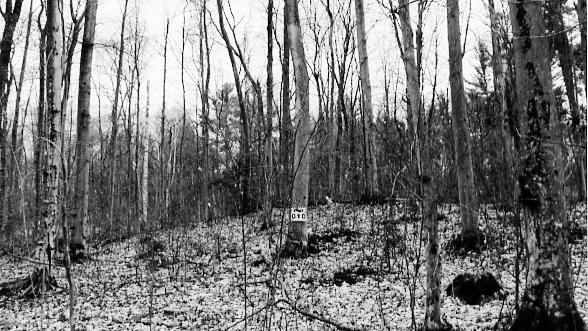
The PSP database consists of thousands of measurements of individual trees spread over several hundred plots. The repeated measurements draw your focus to review each tree’s growth and survival over time. For example, on PSP010 only 70 of the original 372 living trees were still alive in 2020. Ingrowth, new trees that have grown to 3.5” dbh since the plot was established, replace those that passed on. The beech, now 160 years old, are showing signs of decline. Beech bark disease is an approaching threat. One should not forget the true value of PSPs is the sum of the individuals. The diary for PSP010 reads, “plot established in 60-year-old (1859) beech-maple-birch with 165-year-old (1754) maple overstory. Stand had been highgraded and grazed by cattle.” The original large low-quality maple are visible in Figure 5(a).


Figure 5: Views of PSP010 a) 1919 (upper left), b) 1936 (upper right after overcutting), c) 1951 (lower left), d) 2003 (lower right).


The plot scale metrics for PSP010 show the impact of time on species composition (transition to mostly beech), stem density (decreasing), and average diameter (increasing since the 1933 cut) (Table 1). The diary described the 1933 harvest as “overcut due to lack of supervision”. The long-term data indicate it has taken many years to recover from this overcutting with the basal area stabilizing and maximum tree size returning to the original values after 1998.
As I slipped my COVID-19 mask off and prepared to leave the PRF, I was reminded of how diligent our predecessors had to be for a plot to survive 100 years. The corner post to PSP019 had been knocked over in a recent harvest. I notified Melissa’s crew so they could re-establish the post. These plots are part of a working research forest so diligence in measurement and plot maintenance is important. Forest processes take place over periods longer than most humans live. These centurion plots give us a glimpse into what has been happening from before our parents were born. Table 1.
year Ave DBH
(inches) Max DBH
(inches) stems/ ha Beech Sugar maple White birch Other
Basal area (m2/ha) 1919 7.5 20.3 716 40% 21% 19% 19% 34 1929 8.1 21.9 698 44% 24% 16% 16% 39 1939 7.0 15.5 607 56% 13% 15% 16% 23 1951 7.2 16.1 455 70% 12% 6% 12% 18 1962 8.2 17.6 484 66% 14% 5% 14% 25 1973 9.0 19.6 473 72% 14% 5% 9% 29 1983 10.0 20.1 415 74% 14% 5% 7% 31 1993 11.1 20.6 360 77% 14% 3% 6% 32 1998 11.1 21.1 360 78% 14% 2% 6% 33 2016 11.9 24.8 335 83% 13% 0% 4% 36 2020 11.3 26.0 360 80% 16% 0% 4% 36
Table 1: PSP010 metrics 1919 to 2020 for stems over 3.5” (8.89 cm) dbh. Overcutting took place in 1933. Diameter limit harvesting took place in 1951 further impacting stand dynamics. ❧


