1 minute read
B. Supplementary Figures
B. Supplementary Figures
Figure 1.
Image:Toaldo, Mattia. “A Quick Guide to Libya’s Main Players.” European Council on Foreign Affairs,EU, 2018. Web, accessed 15Feb. 2019.https://www.ecfr.eu/mena/mapping_libya_conflict
Figure 2.
Historical regions and ethnic areas of Libya.

Image: Kaplan, Seth. “Reversing Course in Libya: Starting From Where the Real Power Lies.” Fragile States.org, featured in Foreign Policy, USA. 26 June 2016. Web, accessed 14 Jan. 2018. https://www.fragilestates.org/2016/06/26/reversing-course-libya-starting-real-power-lies/
Figure 3.
Approximate Territorial Control of Libya in July 2018.

Image: Adams, Koen, modified by Centanni, Evan. “Libyan Civil War Map & Timeline - July 2018.” PolGeoNow, 20 July 2018. Web, accessed 14 Jan. 2019.https://www.polgeonow.com/search/label/libya
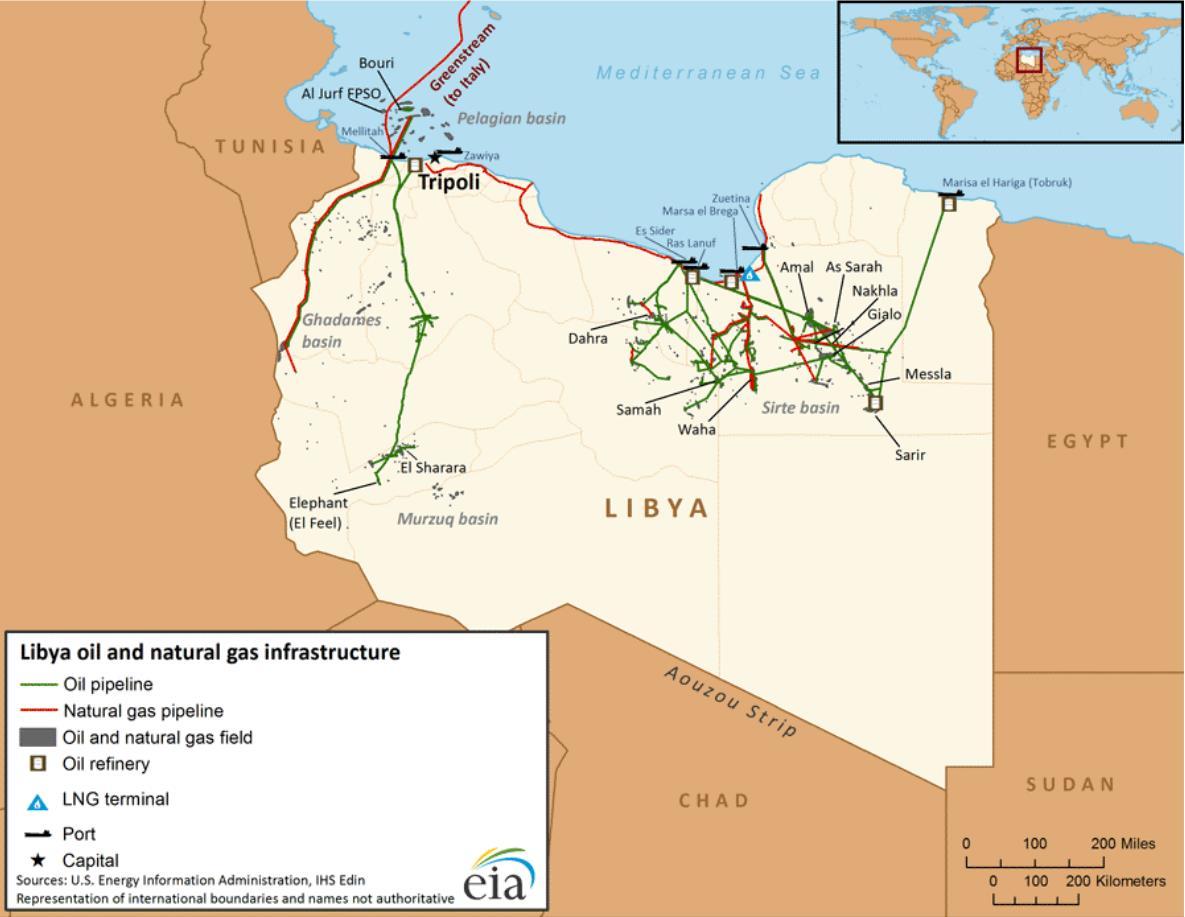
Figure 4.
Oil and Natural Gas Pipelines in Libya

Image: “Libya – International – Analysis – U.S. Energy Information Administration (EIA).” Energy Information Administration, USA. Not dated. Web, accessed 14 Jan. 2019.
https://www.eia.gov/beta/international/analysis.php?iso=LBY


