31 minute read
5. The Intervention


5
The Intervention
Understanding the characteristics and behavior of TLYCS’s potential donors, preliminary assessments of the behavioral bottlenecks they encounter, and the literature review, this section proposes several interventions. These interventions rely upon The Life You Can Save’s main touchpoints with the community: social media, their website, and the newsletter. Together, these interventions represent our suggestions for the most promising tests to start a long-term learning agenda.
Our team sought to test the proposed interventions by measuring the performance of a specific series of posts on TLYCS’s major social media platforms. This testing structure was designed within strict time constraints, which proved incompatible with conducting randomized controlled trials (RCTs) or A/B testing over a longer period of time . Therefore, our team developed a testing strategy over social media, which could provide nearterm, useful data on which to base more robust future social media RCTs or A/B testing, while operating within the confines of our compressed time window.
We also propose several interventions using the website and newsletter. A donation quiz will simplify the difficult choice for potential donors among the curated effective charities. Current newsletter subscribers can be leveraged to build The Life You Can Save’s community by inviting them to share the book. And focusing content at the top of the homepage on specific impacts will promote website engagement, especially among new users.
Social Media Testing
Structure
Our testing structure was composed of a series of test posts on Facebook, Twitter, and Instagram, posted from November 16 to 30, 2020. These test posts consisted of posts with a broad charity framing, with specific cause framing, donor testimonials, and a post centered around Peter Singer’s TED Talk on effective altruism. To remain consistent, the posts were all uploaded to the social media platforms around 12pm ET each day. The test posts were randomly rotated between the various components, and interspersed with a few exogenous control posts that TLYCS conducted as normal, for example a November 24 post for a virtual live crowdfunding event to be held December 7, a post about gratitude on November 25 (Thanksgiving) and a November 28 post about how to download Singer’s book.
Strategy
Given tight timelines, our team had to manage competing demands for broader insights on different types of framings and content, while attempting to maintain a degree of statistical power. Traditional RCT or A/B testing proved challenging over social media, and would probably best be conducted through social media advertising, to allow for small, specific tweaks that could be tested among
large populations. However, our team developed a next-best testing strategy for the near-term. The initial test posts should provide a launching point for further research and discussion, and lead to more robust testing strategies for the future as discussed in the final section of the report.
Our testing strategy was to maximize the compressed testing window by proposing four sets of two to five posts, so that we could compare across as well as within the categories. This would allow us to test a number of different framings and concepts, while still maintaining a degree of internal comparison, albeit largely qualitative. Because more than a single attribute varies across these posts, we could not directly target and test a specific behavioral insight without creating highly repetitive content, which itself risks confounding results. However, the content within a set of test posts was varied, providing us a glimpse into potential mechanisms to explain variation in post performance.
Post performance was measured by an array of engagement metrics on Hootsuite, against a baseline post performance. Baseline post performance was measured in three ways, by average post performance during the same window last November, controlling for number of followers, average post performance over the last three months, and other posts from TLYCS over the testing period.
Data and Interpretation
The social media test posts ran over a period of two weeks, from November 16 to 30, 2020. These tests included four posts on Instagram, nine posts on Twitter, and eleven posts on Facebook. To analyze the relative performance of these posts we utilized post performance data from Hootsuite to calculate social media metrics for the test posts, which we compared to the average metrics for control posts TLYCS made during the testing window, averages from the previous three months (August 1 to October 31, 2020), and from the same two-week window last year (November 11 to 25, 2019), to control for seasonal patterns of giving.
As shown in Figure 5.1, Panels A and B, test posts on Twitter and Instagram performed similarly to control posts during the same window, averages from posts in the previous three months, and averages from posts in the same two-week window last year.
However, one notable difference (though not statistically significant, given the small sample sizes) was with reactions on Facebook. The test posts had nearly double the average reactions than the other posts TLYCS made during the twoweek testing window (averaging 10.8 average reactions per post, versus the 5.8 for the controls), and above the average Facebook reactions per post for the previous three months (8.0) and from this two-week period in November 2019 (7.5), as shown in Figure 5.1 Panel C.
This higher average was largely driven by elevated engagement with two of the donor testimonials (10 and 23 reactions per post, see Figure 5.2 Panels A and B, respectively) and a post about Singer’s TED Talk (30 reactions), as shown in Figure 5.2 Panel C.
Figure 5.1 Average Engagement per Post by Social Media Platform
Panel A: Twitter Panel B: Instagram Panel C: Facebook
Nov. 2020 (tests) Nov. 2020 (controls) Aug. to Sep. 2020 Nov. 2019
Likes
Retweets 1.9
2.3 3.0 3.5 Likes
0.7
1.3 1.5 1.1 Comments 0.0 0.8 0.4 * 26.3 24.6 32.3 Reactions
Shares
Comments 5.8
8.0 7.5 10.8
2.3 0.9 2.8 3.0
0.4 0.7 0.4 0.2
Note: November 2019 data not available for Instagram.
These three posts were the reason for higher Facebook metrics in the test posts, relative to the average test post performance on Twitter and Instagram. Of these three high performing posts, only the first donor testimonial (Figure 5.2 Panel A) was posted on another platform, Twitter, where it performed above average, as well. These findings do not represent robust quantitative evaluation but rather a good starting point for further testing. In sum, donor stories performed well and appeared to drive social media engagement. They are likely a good starting point for building community and leveraging the “social” aspect of social media. Additionally, the TED Talk post with an impact framing performed well, notably because the post was not actually a video post. Its strong performance speaks to the power of video among social media supporters. It is also worth exploring how to splice and distribute clips of Singer, which could drive higher social media engagement.
Proposed Website and Newsletter Tests
It would be valuable for The Life You Can Save to use behavioral science interventions beyond just their social media accounts. Their website and newsletter offer possibilities for several highly-promising interventions to achieve the organization’s goals that could not be achieved using social media alone.
Simplifying Donation Decision Bottlenecks Through a Quiz
The Life You Can Save has taken the approach of providing as much information as possible about its partner charities on the website. For current adherents to the effective altruism approach, particularly those from the tech community, maximizing data and information is likely the best way to increase their participation. However, in order to expand its appeal
Figure 5.2 Most Popular Test Facebook Posts
Panel A: Donor Testimonial 1 Panel B: Donor Testimonial 2

Panel C: Singer’s TED Talk

to a broader audience, The Life You Can Save will need to develop tools that help potential donors sort through donation options and charities more quickly and easily. We suggest that one of these tools be a decision-tree quiz, which will carefully guide prospective donors through a series of questions before creating a custom recommendation of donation amount, frequency, and charity type for each donor. This will reduce decision fatigue and give busy new donors an easier way to get involved.
Description of Behavioral Bottlenecks
As mentioned above, the most visited page on The Life You Can Save’s website is the section entitled “Best Charities.” This page lists all 23 partner charities, with a brief description of their work and links to learn more. Also, the page features a filtering tool, in which donors can sort by tax deductible status, broad categories describing the charities, and the country in which each charity operates.
However, unless potential donors are used to sorting through large quantities of information, the information presented on the “Best Charities” page can be incredibly daunting.
First, the donor has to browse through the information presented on the crowded “Best Charities” page. Then, they have to decide which charity is their preferred donation vehicle, or if they would like to give some amount to split between all of the partner charities. Finally, the donor has to decide on the amount to give, as well as the frequency. Clearly, this is a lengthy process, and at multiple points, it’s easy to see where a donor might choose to close the website (which contributes to the high bounce rate) rather than donating. The identified bottlenecks are as follows:
Limited cognitive bandwidth. Behavioral science and common sense both tell us that the average person has many different topics occupying their thoughts at any given point in time. Given all of this mental noise, it’s important to make choices clear and easy for donors, who might otherwise be overwhelmed by the amount of information presented and leave the website without committing to a donation.
Choice architecture. Even if a prospective donor is excited about The Life You Can Save, the website doesn’t simplify the decision-making context for donors. For example, there are no clear nudges to donors to choose one donation option over another, and there doesn’t seem to be a good default option. Using the filters is somewhat helpful, but it’s not clear how donors should shift from understanding the purposes of each charity to actually making a donation.
Anchoring. The website also misses out on a good opportunity to anchor prospective donors to a specific donation quantity or a set frequency of giving. For example, the website could set the default donation option at $50/month, rather than having donors choose the amount and frequency themselves without guidelines.
Proposed Intervention and How It Addresses Bottleneck
The Life You Can Save’s current website design is predicated on two assumptions; donors prefer to have more information
than not, and donors require little guidance in making their decisions about which charities to support. While these assumptions may hold if the donor pool remains similar to its current composition (tech workers who are comfortable with cost/benefit analysis and like to see numbers and statistics), adhering to these established design principles may hamper long-term growth if potential new donors with different preferences are not reflected in an updated website design.
In place of the current system, we propose to guide prospective donors using a decision-tree quiz similar to Buzzfeed. Using no more than ten questions, the quiz will ask prospective donors about the topics they’re interested in, their annual budget for charity donation, and ways they prefer to connect with The Life You Can Save’s donor community. The quiz should be highlighted prominently on the “Best Charities” page with simple language, such as “Take a quick quiz to figure out the right charity for you!”
This quiz will address the bottlenecks discussed above in several ways. First, it will allow busy people who may not have time to read through the particularities of each charity to get a sense of which charity best matches their interests and priorities with regards to charitable giving. This will eliminate the need for donors to spend a long time on the website as well –- they can quickly view the charitable page, take the quiz, donate, and leave, a streamlined process that will appeal to busy professionals.
Second, the quiz will give prospective donors an actionable way to get involved, with parameters set up beforehand. Rather than repeatedly urging donors to donate, but not providing advice on how much to give, the quiz can recommend a donation amount and frequency that works for the donor’s lifestyle.
Finally, the quiz can also be made shareable on various social media platforms, such as Facebook, Instagram, and Twitter. By encouraging donors to share their results, we can leverage social norms to encourage a set donation, which behavioral science has shown can be helpful for people in maintaining their commitment level. Sharing the quiz results would also attract other donors to The Life You Can Save, who will see the social norms of charitable donations promoted online by their friends and family. This may spark an interest in donating themselves and create a sense of fun around the process of donation.
A sample quiz is included in the appendix (see Appendix Figure A.6).
How to Test Intervention Effectiveness
Assessing the success of this intervention in increasing donations will depend on several workarounds and the types of questions offered towards the end of the quiz.
First, the Google Analytics of the “Best Charities” page can be compared before the quiz is available on the website, and after the quiz is launched. If time spent on this section increases, and more people navigate from this section towards the donation page, that will be an important finding.
Second, the quiz can be designed with an explicit request for a donation at the end. After making the recommendation of which charity the donor should select and with what frequency the donation should be made, the final question can simply ask, “Are you ready to donate now?” Rather than assuming that donors will immediately move from finishing the quiz to making the donation, making this the default as part of the quiz’s choice architecture will hopefully make the donation process as seamless as possible. This can be measured by assessing donations before and after the creation of the quiz, and also measuring if more donations were made by new donors than before.
Finally, the quiz should ask potential donors how they found out about The Life You Can Save. While this might not be directly pertinent to simplifying donations decisions, it would provide valuable insight to The Life You Can Save on which messaging strategies are most effective at reaching the broadest group of donors. We can also monitor how many people choose to share their results on social media, which is a good proxy for seeing how many new people are being exposed to the concepts of effective altruism and The Life You Can Save.
Since creating a quiz can be done for free through Google or very cheaply with external software, even a small increase in donations from this intervention can be considered cost-effective.
Leveraging Social Referents and Gifting to Build the TLYCS Community
One of The Life You Can Save’s goals is to raise awareness of Singer’s ideas and build the effective altruism community. The Life You Can Save already has a burgeoning community surrounding it, comprising thousands of followers on social media and around 25,000 newsletter subscribers. All have expressed interest in Singer’s ideas and effective altruism. However, there are only limited and cognitively-taxing ways for individual users to build the movement, meaning that The Life You Can Save has to do all of the work. making it easier for current followers to bring new people into the community is an easy and cost-effective way to build the movement.
Description of Behavioral Bottlenecks
The Life You Can Save has a page on its website dedicated to sharing Singer’s book. This page has shortcuts to sharing the book on Twitter, Facebook, LinkedIn, WhatsApp, and via email. Users can also copy a link to the book download page and share using any other medium.
Several of the sharing shortcuts provide suggested content written by The Life You Can Save staff along with the website link. The content currently suggested by The Life You Can Save by platform is summarized in Table 5.1.
On Facebook and LinkedIn, the link is shared as an article, which automatically shows a short preview text similar to the suggested content for Twitter, WhatsApp, and email.
Figure 5.3 is a journey map tracing the process from a member of The Live You Can Save’s current community deciding they want to share the book to the invitee downloading the book. The bottlenecks targeted by this intervention are circled.
Table 5.1 Currently Suggested Content by TLYCS for Sharing the Book by Platform Platform
TLYCS’ suggested Content
People struggle to live on less than you spend on a bottle of water. The new edition of #TheLifeYouCanSave by @PeterSinger shows how you can help change that - download it here for FREE today! #SmartGivingSimplified https://www.thelifeyoucansave.org/the-book Read a book, Save lives. The new edition of The Life You Can Save by Peter Singer shows how you can actually save lives - download it for FREE today https://www.thelifeyoucansave.org/the-book Subject: The Book - The Life You Can Save Body: Get your free copy of #TheLifeYouCanSave and learn how you can help end world poverty. https://www.thelifeyoucansave.org/the-book #SmartGivingSimplified
This is a cognitively taxing process for potential sharers. First, they need to decide they want to share the book. Then, they have to find out how to do so: by going to the website and finding the “Share the Book” page. This seems to be a significant bottleneck for potential
Figure 5.3 Journey Map for Sharing the Book

sharers; the “Share the Book” page had only about 1,900 visitors in the last year, compared with over 58,400 to the main book download page.
There are also bottlenecks for the people who receive the message. An invitee needs to see the recommendation to download the book. This involves both being on the same platform that the invitee is as well as competing with all of the other content the invitee is seeing for their attention.
Next, the invitee needs to decide that the book recommendation is useful to them. This is a significant bottleneck for invitees that differs by platform. Although the available sharing options are presented together, they accomplish fundamentally different goals. The Twitter, Facebook, and LinkedIn options are all for public posts that function more as signals than as a personal recommendation. Everyone associated with the user will see the same message. It is unlikely they will consider it a recommendation made personally to them and feel a strong connection with it, even if sent by someone they know.
Additionally, the suggested content does not imply any kind of personal recommendation, even on platforms that are person-to-person (WhatsApp, email). None of the suggested content includes a first-person pronoun, and the uses of second-person pronouns (“you”) are all abstract – not meant for the recipient to interpret it as a conversation between the recommender and them. This limits the effectiveness of the recommendation.
Proposed Intervention and How It Addresses Bottlenecks
The Life You Can Save currently has about 25,000 email newsletter subscribers, all of whom have expressed interest in Singer’s ideas. Additionally, about 10,000 of those subscribers did so through the process for downloading the book. Therefore, they are a promising target population for encouraging peer-topeer sharing of the book.
To overcome the bottleneck requiring potential sharers to independently think of sharing the book, The Live You Can Save would send a one-time email to current newsletter subscribers, inviting them to share the book with their friends. Several sample emails, using different framing, are provided in the Appendix (see Appendix Figures A.7 and A.8). Subscribers interested in sharing the book can copy suggested content to simplify composing the email and send it to their friends using their own email address.
In addition to “nudging” current subscribers to share the book by reminding them of the option to do so, the email frames it as an unexpected gift. As shown in this report’s literature review, unexpected gifts often make the receiver feel an obligation for reciprocity. The email will remind subscribers of the impact that the book and Singer’s ideas made in their life and encourage them to share that gift with their friends.
Additionally, suggesting a limit on the number of people they can share the book is advantageous for several reasons. First, it makes the task of deciding who to share the book with easier – the
recommender only needs to think of one or two people who would enjoy the book. Additionally, it increases the perceived value of recommending the book. Because recommendations are portrayed as a limited resource, recommenders will try to maximize their value by only recommending the book to the people they think will get the most from it.
This intervention also improves the process for the people who are invited to download the book. Invitees will receive an email from someone they know with a personal message suggesting the book. This method is more likely to cause people to download the book because it comes as personally recommended by someone the invitee trusts (giving it a higher perceived benefit) and because of the power of free.
How to Test Intervention Effectiveness
Determining if these one-off email invitations are effective at leveraging the existing connections to build the community requires a careful testing strategy with several parts.
The first step is determining if the email invitation to current subscribers is effective at encouraging subscribers to share the book. It will be challenging to determine exactly how many times the book is shared given legal restrictions against The Life You Can Save sending emails without receiving permission from the address’s owner. Due to this consideration, the test has subscribers invite friends using suggested content through their own email. While this gets around the legal restriction, we lose the ability to accurately track the number of times the book is shared. There are several indirect measures we can use instead. Through The Life You Can Save’s email vendor, we know if the email was opened. This is certainly an imperfect measure, as it is likely that only a small share of the people who open the email will share the book. We can also track how many people unsubscribe through the invitation email. This is a fairly drastic measure that lets us know that something about the invite (or the broader frequency of contact) is not what the recipient preferred.
Other options, each with advantages and downsides, include: asking senders to blind-copy The Life You Can Save on the email(s) they send, asking senders to share that they send a book invitation on social media while tagging The Life You Can Save in return for some prize (perhaps a thank-you email from Singer), and conducting polls of a random sample of newsletter subscribers about whether they’ve shared the book or not before and after they are invited to do so.
The main issue with all of the methods previously mentioned is that reporting that someone shared the book requires an extra step, that will likely have high-drop off – meaning measures derived from it are not accurate. Ideally, there would be some way that we can track interaction with the email without requiring a separate step from the sender. For example, we might include a button that automatically copies the suggested email – giving recipients an incentive to use it – while also reporting that it was clicked – giving us a fairly accurate measure of at least how many people shared the book (if not how many times it was shared).
We can track the success of encouraging people to download the book in several ways. The most accurate is to include a unique link in the suggested content email. This means that only people who receive that email will follow that link. The unique link doesn’t necessarily need to take users to a new page, requiring the web developer’s time. Instead, it could be a simple redirect to the main book download page. An alternative option that is less accurate but easier to implement is to include the main book download page link in the invitation, as with all current share materials. This method won’t require any of the web developer’s time, but we won’t be able to precisely attribute changes in traffic to the book download page to the invitation campaign. Statistical methods can help us estimate a convincing counterfactual, but we cannot isolate the effect of the invitations from the effect of anything else happening at the same time (for example, a book club chooses to read the book for their next meeting).
Since this intervention is effectively costless to The Life You Can Save, even a small increase in book shares and downloads is cost-effective. If successful, The Life You Can Save can leverage similar campaigns to continue building the movement using community and giftgiving frames. Some examples include encouraging people to donate on behalf of a friend’s birthday or other special occasion, “gifting yourself” by donating on your own birthday, donating enough to cover the cost of sending the book to a “penpal” or reading group somewhere.
Impact-Focused Messages on Website Homepage
Behavioral and marketing researchers frequently find that messages focused on clear, concrete impacts are more effective than abstract messages. User experience designers also know that people are more likely to see and interact with content near the top of a webpage, especially if it is on the first screen that users see.
Optimizing the top screen of the homepage can improve the user experience for both new and returning users. Having impact-focused messages first will entice first-time users to stay while they are making a split-second, partially subconscious decision about whether to stay on the website or not. Impactfocused messages will also encourage returning users to interact with the website – by clicking through to another page or donating – by reminding them of the impact their donation will have.
Description of Behavioral Bottlenecks
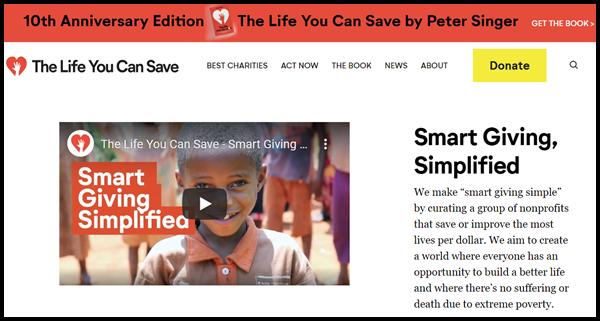
Figure 5.4 shows The Life You Can Save’s website homepage for both desktop and mobile on November 27, 2020. The top of the page features a video on “Smart Giving Simplified,” which is echoed by the text accompanying the video. Below the bolded title of “Smart Giving, Simplified” is two sentences about The Life You Can Save’s mission.
Figure 5.5 shows the journey map that a new user follows when arriving at the website. The proposed intervention focuses on new users that arrive at the website without a set intention (ex. coming
Figure 5.4 The Life You Can Save Website Homepage on Desktop and Mobile
Panel A: Desktop Panel B: Mobile

to the website to download Singer’s book). The specific behavioral bottlenecks targeted are circled in red.
most people who have not yet been to The Life You Can Save’s website, here called “new users,” will know if they arrived at the website with a specific intention. For example, a new user might be looking to download Singer’s book, or heard about a specific charity from a friend and now wants to learn more. The primary behavioral bottleneck to these users achieving their goal is if they are unable to navigate the website. The Life You Can Save’s website is well organized, with intuitive navigation across the top bar and a search function. It is unlikely that many new users fail in their search for specific content.
A key group to target is new users who arrive at the website without a specific intention. These users are more likely to come from social media links or organic Google searches for keywords such as “effective altruism,” “Peter Singer,” or “best charities.” Upon arriving at the website, these new users do not have a specific goal. Perhaps they want to learn more about The Life You Can Save, or read about effective charities, etc., but there are many ways to achieve these less specific goals.
These new users often make a splitsecond, partially subconscious decision about whether to stay on the website or not. According to Google Analytics data, 73% of homepage visitors are first-time visitors, while more than half (53%) of homepage visitors leave the website without visiting another page. Optimizing the website’s design, especially the top of the homepage – the first thing visitors see, and the only thing many visitors will see
Figure 5.5 Journey Map for New Users Interacting With Website

– is key to better capturing the attention of new users and increasing website engagement.
The first behavioral bottleneck for new users without a specific reason for reaching the website is deciding whether the website applies to them. The key drivers for this are their personal identity (whether they identify with The Life You Can Save’s mission) and cognitive load (whether it is easy to find and understand information on the website). After deciding that the website applies to them, new users need to decide if they want to stay on the website.43 This is where it is key to capture the new user’s attention. Their decision to stay or leave will largely be based on cognitive load (whether it is easy to find and understand information on the website), salience (whether the content feels applicable to them at that moment), and empathy (whether they care about the potential ultimate recipients of their donation).
Returning users follow a similar process. Returning users who know what they want will navigate to that information. Returning users who do not know what they want will, like new users, decide if the website applies to them and if they want to stay. Creating content that encourages returning users to stay on the website is both easier and more challenging than for new users. Given that they chose to return to the website, it is likely that returning users believe the website applies to them. However, content needs to be changed periodically to maintain its effect on returning users.
The current content at the top of the homepage is not focused on concrete impacts. The phrase “Smart Giving, Simplified” is potentially confusing to a new user unfamiliar with Singer’s ideas or effective altruism – what is “smart giving”? The first line of the paragraph below the title explains, but it is likely that many visitors will not read that content. Additionally, saying that “[w]e aim to create a world where…” is abstract and risks triggering a visitor’s incredulity that it is ever possible to eliminate suffering and extreme poverty.
Figure 5.6 Impact-Focused Redesign Website Homepage on Desktop and Mobile
Panel A: Desktop Panel B: Mobile


Proposed Intervention and How It Addresses Bottlenecks
The Life You Can Save can increase user engagement with the website homepage by focusing content at the top of the page on concrete impacts. Using a rotating feature of images and examples from the impact calculator is likely to maximize its effectiveness.
One possible implementation of this idea is shown in Figure 5.6. This proposal uses examples from the impact calculator to provide concrete examples of the impact people can have. It also frames donations in terms of what people can give up (here, a latte a week for a year). The illustrated example shows giving up a $4 latte each week for a year ($208), which the impact calculator shows will buy 104 bednets for the Against malaria Foundation, each of which protects two people (a total of 208 recipients) for up to three years. The impact calculator is a unique and impressive asset that can be readily leveraged for providing examples of impacts. Although Figure 5.6 is static, the website version should cycle to a new “card” every five seconds or so. Each card will illustrate the impact of giving up something for different charities. Cycling cards will grab the visitor’s attention, as humans are naturally drawn to movement. It also makes the feature more appealing to returning visitors by providing new content. It is also easy to update the feature with new impact cards periodically to refresh the website.
There are other behavioral advantages to this design. The dropdown offering different items to sacrifice gets the user to ask, what else can I give up? The cycling cards begs the question, who else can I protect? The whole feature is set up to be partially interactive (the user chooses
what to sacrifice), drawing them in and starting their relationship with The Life You Can Save by thinking about Singer’s ideas in a way that does not require any prior knowledge.
The “Learn More” button could go either to the “Best Charities” page, the page of the individual charity featured, the impact calculator, or any other applicable page. It could also be changed to a “Donate” button.
Figure 5.6 demonstrates the design on desktop as well as mobile. Recall that mobile uses are 31% of website users, and an even higher share during the high-traffic, high-donation giving season. Therefore, it is imperative that the design works on mobile as well.
The proposed design removes the “Smarter Giving, Simplified” branding from the top of the homepage. This is unlikely to significantly harm The Life You Can Save’s branding efforts, but several actions can be taken to mitigate this effect. The feature just below the cycling impact cards can be changed to “Smart Giving, Simplified” with links to an “About Us” page and social media accounts. Also, the “Smart Giving, Simplified” branding could be worked into the impact cards.
The attention-grabbing design of the impact cards addresses users’ cognitive load, while the relatable items to sacrifice are highly salient and the protection framing appeals to users’ identity and empathy.
How to Test Intervention Effectiveness
It is best to use an A/B test to evaluate the effectiveness of this intervention. In the A/B test, two versions of the website homepage would be live at the same time: one with the then-current homepage design, and the other with the cycling impact cards. Users would be randomized to see one version of the page or the other when navigating to the website. Since both pages are live at the same time, and users are randomly assigned to a homepage version, any observed differences (beyond sampling error) in website interaction are due to the different designs.
The key outcome to measure is engagement with the website. Google Analytics offers several useful metrics for this, but time spent on the website and the share of visitors that visit multiple pages are probably the most important. The evaluation should also consider subgroups of users, with the most relevant subgroup comparison being between first-time visitors and returning visitors.
If an A/B test is not possible, then an interrupted time series design could be used to estimate the effectiveness of the intervention. An interrupted time series design requires a long period of trend data for the key outcomes. It assumes that any deviation from the trend that is contemporaneous with the intervention is because of the intervention. The main drawback of this method is that it is impossible to separate the effect of the intervention with any other chance time effects (ex. Increased interest following Singer being interviewed on a podcast).
This intervention is low-cost to The Life You Can Save, requiring only web developer time. The research for the impacts is already done, and The Life You Can Save already has pictures they can use for the cards. This intervention will require fairly substantial up-front web development, but maintenance costs should be very low (only requiring changing out the cards periodically).
Why These Tests Are the Most Promising
As an operating charity with an important mission, it is important that The Life You Can Save can both learn to improve processes while devoting resources to only the most promising interventions. This chapter summarized several highlypromising interventions on social media and through the website. These tests should only be seen as a starting point for a behavioral science-inspired research and design agenda.
Our initial social media testing identified several promising strategies for The Life You Can Save. Posts highlighting donor stories did well, including two of the highest reaction posts on Facebook. The Facebook post about Singer’s TED talk also performed well. Together, the social media testing showed the power of highlighting personal stories and interactive content that leverages the unique strengths of social media platforms. We also proposed three tests using two of The Life You Can Save’s most prominent other touchpoints with the community: the website and newsletter. The donation quiz optimizes the complicated choice architecture of choosing between the many curated effective charities. The invitation to share the book to newsletter subscribers crowdsources expanding The Life You Can Save’s community by leveraging reciprocity and social norms. And changing the top of the homepage to a cycling feature of impact-focused cards will increase engagement with the website by creating an engaging feature that aligns with visitors’ identity, is salient, and encourages empathy.
Broadly, we believe that these interventions are the most promising starting point for a long-term learning agenda. Each of these interventions is supported by original data collected by the team or by our review of the literature on behavioral science. Implementing and evaluating these interventions is the first step to actively leveraging behavioral science to increase donations and build The Life You Can Save’s community. Lessons learned from evaluating the effectiveness of these interventions should be used to improve them and for informing future interventions. Fully integrating behavioral science into The Life You Can Save’s operations requires a comprehensive learning agenda, the subject of Section 6.