4 minute read
Figure 3.2 Episodes of natural disaster
G L O B A L P R O D U C T I V I T Y C H A P T E R 3 149
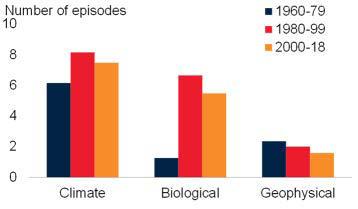
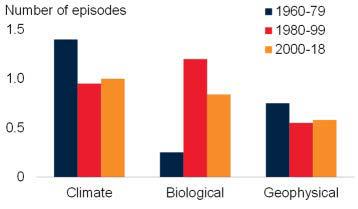
FIGURE 3.2 Episodes of natural disaster
Climate disasters were the most frequent type of natural disaster in the full sample period. The annual frequency of climate-related episodes nearly doubled after 2000, and the frequency of biological and geophysical disaster episodes increased by 40 and 10 percent, respectively. Since 2000, the frequency of big and severe natural disasters has leveled off. After 2000, a natural disaster was 80 percent more likely to occur in an LIC and 35 percent more likely in an EMDE than in an advanced economy. Among EMDE regions, SSA experienced the steepest increase in the frequency of natural disasters after 2000 relative to 1980-99.
A. Average number of natural disaster episodes per year, by type B. Average number of natural disaster episodes per country per year

C. Average number of big natural disaster episodes per year, by type D. Average number of severe natural disaster episodes per year, by type


E. Share of natural disasters, by region
Percent of total 100 EAP ECA LAC MNA SAR SSA
75
50
25
0 1962 1970 1978 1986 1994 2002 2010 2018
F. Average number of natural disaster episodes per year, by region

Sources: Emergency Events Database (EM-DAT); World Bank. Note: Natural disasters include climate, biological, and geophysical disasters (EM-DAT). An episode dummy for a specific type of event is 1 if the event occurs at least once (≥1) in a country-year pair and 0 otherwise. Big natural disasters and big wars are events that led to at least 10 deaths per million population. Severe natural disasters and severe wars are events that led to at least 100 deaths per million population. The sample includes 170 economies: 35 advanced economies and 135 EMDEs, of which 27 are LICs. AEs=advanced economies; EMDEs=emerging market and developing economies (including LICs); LICs = low-income countries; EAP = East Asia and Pacific; ECA = Europe and Central Asia; LAC = Latin America and the Caribbean; MNA = Middle East and North Africa; SAR = South Asia; SSA = Sub-Saharan Africa.
150 C H A P T E R 3 G L O B A L P R O D U C T I V I T Y
Pandemics. Global pandemics such as COVID-19 (2019-21) are rare events. There were only a few pandemics in the twentieth century, including the Spanish flu (191819), Asian flu (1957-58), Hong Kong flu (1968-69), and HIV/AIDS (1980s). Since the 2000s, the major epidemics were SARS (2002-03), swine flu (2009-10), MERS (2012), Ebola (2014-15), and Zika (2015-16), which affected over 115 EMDEs and advanced economies (box 3.1). The COVID-19 (2019-21) outbreak has affected virtually all countries around the world and led to a sudden stop of the global economy. Regional distribution. SSA seems to be more exposed to natural disasters than other EMDE regions. In both 1980-99 and 2000-18, SSA had the highest frequency of natural disasters among EMDE regions. And, in 2000-18, SSA experienced the largest increase in the frequency of natural disaster episodes relative to 1980-99. East Asia and Pacific (EAP) and Latin America and the Caribbean (LAC) were hit by at least 20 natural disaster episodes per year over 2000-18 (figure 3.3). Although climate events were relatively more frequent in EAP, LAC, and SSA, historically, the largest number of biological disasters such as epidemic outbreaks occurred in SSA. The region least frequently affected by natural disasters was the Middle East and North Africa (MNA).11 Exposure to frequent natural disasters is correlated with lower productivity. While the number of natural disaster episodes tripled between 1960-89 and 1990-2018, labor productivity growth halved in advanced economies and slowed in EMDEs other than LICs. Thus, more frequent natural disasters were correlated in this period with weaker labor productivity growth. The annual frequency of natural disasters and TFP growth are also negatively correlated in advanced economies. Moreover, severe natural disasters, especially severe biological disasters, are associated with weaker labor productivity and TFP in EMDEs. Three years into a severe natural disaster episode, median labor productivity was about 8 percent lower in the countries affected, and TFP was 7 percent lower than in unaffected countries (figure 3.3). Wars
Apart from their direct toll on human life and welfare, wars can have major adverse effects on output and productivity (Abadie and Gardeazabal 2003; Cerra and Saxena 2008). Two types of wars are considered: intrastate and external armed conflicts (which include extrastate and interstate wars).12 The destruction, disruption, and diversion effects of wars can cause sharp reductions in the labor force and physical capital, and dampen productive investment and innovation (Becker and Mauro 2006; Collier 1999; Easterly et al. 1993; Field 2008; Raddatz 2007; Rodrik 1999).
• Reduced and disrupted labor forces. Conflict-related losses of lives, coupled with population displacements, dampen output directly and disrupt the functioning of
11 Regions with large geographical areas can be exposed to more natural disasters than regions with small geographical areas. 12 Intrastate wars are conducted between a state and a group within its borders. Extrastate wars take place between a system member and a nonstate entity (not a system member). Interstate wars are conducted between members of the interstate system.


