
4 minute read
Figure 5.1 Evolution of regional productivity in EMDE regions


262 C H A P T E R 5 G L O B A L P R O D U C T I V I T Y
FIGURE 5.1 Evolution of regional productivity in EMDE regions
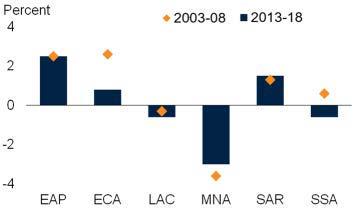
The slowdown in productivity growth following the GFC affected all regions but was particularly severe in EAP, ECA, and SSA. Productivity levels fell further behind advanced economy levels in some regions during the post-GFC period. In all regions, TFP contributed less to productivity growth in the post-GFC period.
A. Productivity growth B. Share of economies with faster productivity growth than the average advanced economy
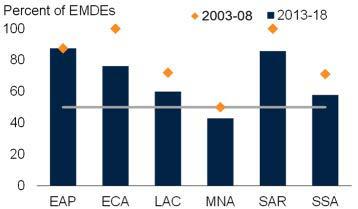
C. Rate of convergence to advanced economy productivity levels D. Productivity levels

E. Factor contributions to regional productivity growth: EAP, ECA, and LAC
Percentage points Percent
10 8 6 TFP Capital deepening Human capital Productivity (RHS) 10 8 6
4 4
2 0 -2
2003-08 2013-18 2003-08 2013-18 2003-08 2013-18 2 0 -2
EAP ECA LAC
F. Factor contributions to regional productivity growth: MNA, SAR, and SSA
Percentage points Percent
10 8 TFP Capital deepening Human capital Productivity (RHS) 10 8
6 4 6 4
2 2
0 -2
2003-08 2013-18 2003-08 2013-18 2003-08 2013-18 0 -2
MNA SAR SSA
Sources: Barro and Lee (2015); The Conference Board; Groningen Growth Development Center database; Haver Analytics; International Labour Organization, ILOSTAT; International Monetary Fund; Organisation for Economic Co-operation and Development, Structural Analysis Database; Penn World Table; United Nations (Human Development Reports); Wittgenstein Centre for Demography and Global Human Capital; World KLEMS; World Bank (World Development Indicators). Note: Productivity is defined as real GDP per worker (at 2010 market prices and exchange rates). Country group aggregates for a given year are calculated using constant 2010 U.S. dollar GDP weights. Data for multiyear spans show simple averages of the annual data. EMDEs = emerging market and developing economies; GFC = global financial crisis; TFP = total factor productivity; EAP = East Asia and Pacific; ECA = Europe and Central Asia; LAC = Latin America and the Caribbean; MNA = Middle East and North Africa; SAR = South Asia; SSA = Sub-Saharan Africa. A-D. Sample includes 35 advanced economies and 129 EMDEs. B. Horizontal line indicates 50 percent. C. Rate of convergence is calculated as the difference in productivity growth rates with the average advanced economy divided by the log difference in productivity levels with the average advanced economy. E.F. Productivity growth is computed as log changes. Sample includes 93 EMDEs, including 8 in EAP, 21 in ECA, 20 in LAC, 12 in MNA, 2 in SAR, and 30 in SSA.
G L O B A L P R O D U C T I V I T Y C H A P T E R 5 263
by European Union structural funds. In SSA, productivity growth accelerated in agricultural commodity exporters.
Productivity growth in LAC and MNA was sluggish even before the GFC, and slowed further in the post-GFC period as investment collapsed amid political uncertainty, episodes of financial stress in major economies, and falling commodity prices. The slowdown was mildest in MNA, where productivity in energy exporters was contracting in the pre-GFC period and productivity picked up moderately in energy importers. The South Asia (SAR) region experienced the second-mildest slowdown, in part because the region is the least open EMDE region to global trade and finance, has urbanized rapidly, and, as a commodity-importing region, benefited from the commodity price slide in 2014-16.
Slower convergence to advanced economy levels in most regions. As a result of the slide in productivity growth during the post-GFC period, the pace of catch-up to advanced economy productivity levels slowed in ECA, and productivity fell further behind advanced economy levels in LAC, MNA, and SSA. The COVID-19 crisis is likely to further weaken productivity growth as the crisis delivers a decisive blow to regions grappling with large domestic outbreaks (ECA, LAC, and SAR), the dual shock of the pandemic and collapse in industrial commodity prices (ECA, LAC, MNA, and SSA), and severe disruptions to international trade, particularly for those dependent on global value chains (EAP and ECA) and tourism (ECA and LAC; World Bank 2020a).
Among EMDE regions, productivity was highest in MNA (40 percent of the advanced economy average), followed by ECA and LAC (29 and 22 percent, respectively), and lowest in EAP and SSA (both 12 percent) and SAR (5 percent). However, there was wide disparity within some regions, especially MNA, ECA, and SSA. In some Gulf Cooperation Council (GCC) countries, for example, productivity was 60 percent or more of the advanced economy average in 2013-18, whereas, in heavily agricultural economies such as the Arab Republic of Egypt and Morocco, it amounted to less than 9 percent of the advanced economy average. Within ECA, deepening global trade integration and major reforms after the collapse of the Soviet Union helped raise the productivity level to the second highest among EMDE regions. Yet, whereas productivity in Poland was 36 percent of the advanced economy average in 2013-18, in some agricultural economies in Central Asia, it was just 3 or 4 percent. Low-income countries (LICs), most of which are in SSA, had productivity of less than 2 percent of the advanced economy average in 2013-18; however, Gabon, an oil exporter, reached 36 percent.
Progress on convergence in productivity levels is likely to be interrupted by the COVID19 pandemic as attempts to limit the spread of the virus disrupt activity around the world. The pandemic is projected to push 71 million to 100 million people into extreme poverty in 2020, with a large share of the new extreme poor expected to be concentrated in SAR and SSA, the regions that already accounted for the majority of extreme poverty (Lakner et al. 2020).

