12 minute read
WINDOW INSTALLATION POSITION
ACTA FACULTATIS XYLOLOGIAE ZVOLEN, 64(2): 49−56, 2022 Zvolen, Technická univerzita vo Zvolene DOI: 10.17423/afx.2022.64.2.05
ANALYSIS OF THE THERMAL BRIDGE OF WOOD WINDOW INSTALLATION POSITION
Advertisement
Roman Nôta
ABSTRACT
The paper is focused on assessing the impact of wood window installation position in terms of wall thickness. The thermal bridge created this way is defined as a linear thermal transmittance [Ψ] of the construction. In this particular case, the thermal bridge is created by the wall and window constructions. For the purpose of this study, one wood window construction was used and compared when installed in various wall constructions. Emphasis was placed mainly on composed walls, which are used mostly in wood panel constructions.
Model walls of various compositions, however, having the same thermal performance were evaluated in the study. In order to achieve the same values of thermal resistance of walls, various theoretical materials were used. Following the performed analyses, the course of the dependence between the development of wall temperatures was evaluated. Reference values were represented by a temperature of 0°C and window positions where the system window-wall reaches the minimum value of the linear thermal transmittance of the window installation Ψi,min.
The hypothesis that the position of Ψi,min depends on the steepness of the temperature gradient (represented by the temperature curve direction) was not confirmed. Results presented in this study can be used for estimating the window position with Ψi,min at the level of 7 – 11 % of the wall thickness measured from the place in the construction with a temperature of 0°C. Key words: thermal bridges, linear thermal transmittance, window, wood panel structures.
INTRODUCTION
Thermal bridge can be defined as a place where a decrease in the construction surface temperature occurs. It occurs in places where the thermal transmittance differs from the rest of the construction (HALAHYJA et al. 1985). One such place is an opening in the building envelope with installed e.g., window.
Previous studies focused on thermal performance of window installation compared the impact of installation position of a wood-aluminium window on the deformation of the thermal field in the place of installation. These analyses worked with the hypothesis that there is a dependence between the magnitude of the temperature gradient, deformation of the 2D thermal field and the best position of window installation, i.e. the place where the values of the linear thermal transmittance of window installation is the lowest Ψi,min (NÔTA andDANIHELOVÁ 2021).
The development of the values of linear thermal transmittance of the window installation (Ψi) depending on the position of the window in the wall is parabolic (MISIOPECKI et al, 2017; HØYDAL 2019) and depends primarily on the thermal performance of window, wall and the installation details (MISIOPECKI et al. 2017; HØYDAL 2019). This is also reflected in the respective equation for calculating the linear thermal transmittance of the window installation (Ψi):
Ψi = L2D - Uwall.bwall - Uw.bw (1)
L2D - two-dimensional thermal conductance [W/(m.K)]; Uwall - thermal transmittance of wall according to EN ISO 6946 [W/(m2 .K)]; bwall - projected width of the wall element [m]; Uw - thermal transmittance of the window according to EN ISO 10077-1 [W/(m2 .K)]; b - projected width of the element analysed [m].
The position withthe minimum value of Ψi is individual for every building, thus for every wall or window construction, as well as for carrying out the installation. Therefore, it is important to consider all of these factors prior to installation and subsequently select the most suitable position. In practice it would mean to make a series of calculations for every window, considering various window positions and corresponding installation detail, and subsequently determine the position with the minimum value Ψi.However, this is demanding and complicated due to time and economic reasons.
MATERIALS AND METHODS
We decided to compare the development of Ψi for the model wall construction with the thermal resistance of the wall construction (Rwall)at the level of 3.67 (m2.K)/Wcorresponding to the heat transfer coefficient (Uwall) 0.27 W/(m2.K), and the equivalent thermal conductivity coefficient is ca. 0.1 W/(m.K). Five experimental wall constructions with the width of 0.350 m were studied, whereas one of them was homogenous (HW) and four were inhomogeneous –composite walls (IHW).
Tab. 1. Number of layers and thermophysical properties of the experimental walls.
Marking of walls HW IHW1 IHW2 IHW4 IHW4
Number of layers of the walls 1 2 3 4 7
Rwall resp. Uwall λeq,wall 3.67 (m2 .K)/W resp. 0.272 W/(m2 .K) 0.1 W/(m.K)
For individual wall variants, theoretical materials with the following values of the linear thermal transmittance were considered.
Tab. 2. Linear thermal transmittance for the theoretical materials and equivalent materials.
Theoretical Materials λ [W/(m.K)] Similar to the Materials λ*[W/(m.K)]
Material No. 01 0.0462 Stone Wool (85 kg/m3) 0.046
Material N Material N o. 02 o. 03 0.0668 0.0727 Mineral Wool Boards 0.06 – 0.07
Material No. 04 0.1000 Aerated Concrete 0.096 – 0.204
Material No. 05 0.2000 Plasterboard 0.220
Material No. 06 0.2930 Slightly Ventilated Air Cavity 0.220 – 0.320
Material N Material N o. 07 o. 08 0.3050 0.4500 Ceramsite Concrete 0.28 – 0.70
Material N Material N o. 09 o. 10 0.5000 0.6000 Brick Concrete 0.52 – 0.89
Material No. 11 0.8000 Lime Plaster 0.880 * By STN 73 05040-3/2012
Individual wall compositions are provided in Table 3.
Tab. 3. The composition of the model walls introduced into the interior to the exterior.
Model Wall
Materials (from interior to exterior)
Thickness [m]
HW Material No . 04 0.350
IHW1 Material No . 11 0.200 Material No . 01 0.150
IHW2 Material No . 05 0.100 Material No . 03 0.200 Material No . 05 0.050
IHW3 Material No . 05 0.025 Material No . 10 0.075 Material No . 03 0.225 Material No . 05 0.025
IHW4 Material No . 08 0.0125 Material No . 06 0.050 Material No . 08 0.0125 Material No . 02 0.205 Material No . 08 0.015 Material No . 07 0.050 Material No . 09 0.005
For carrying out the calculation, an insulated triple pane wood window designated for energy passive houses with construction depth of 125 mm was used. The thermal performance of the window and its parts was as follows: thermal transmittance of window frame Uf = 0.784 W/(m2.K); thermal transmittance of glassing Ug = 0.600 W/( m2.K); linear thermal transmittance of glassing Ψg = 0.033 W/(m.K) and thermal transmittance of window Uw = 0.659 W/( m2.K).
Calculation of Ψi-value was carried out according to the methodology B.C. Reference Procedure for Using THERM to Determine Window Performance Values for Use with the Passive House Planning Package. The “BC Reference Procedure” published in September 2019 is the first methodology using LBL THERM software to be recognized by the Passive House Institute for use in certifying Passive Houses to the International Passive House
Standard” (FENESTRATION ASSOCIATION OF BC,2019).
It was conducted by modelling in computer programme THERM 7.8 (HUIZENGA et al. 2017). Boundary conditions for the calculation were according to the standard STN 73 0540. Reference temperature: internal θi = 20.0 °C (293.15 K), external θe = -12.0 °C (261.15 K).
Reference surface resistance: internal external Rsi = 0.13 (m2 .K)/W, Rse = 0.040 (m2 .K)/W.
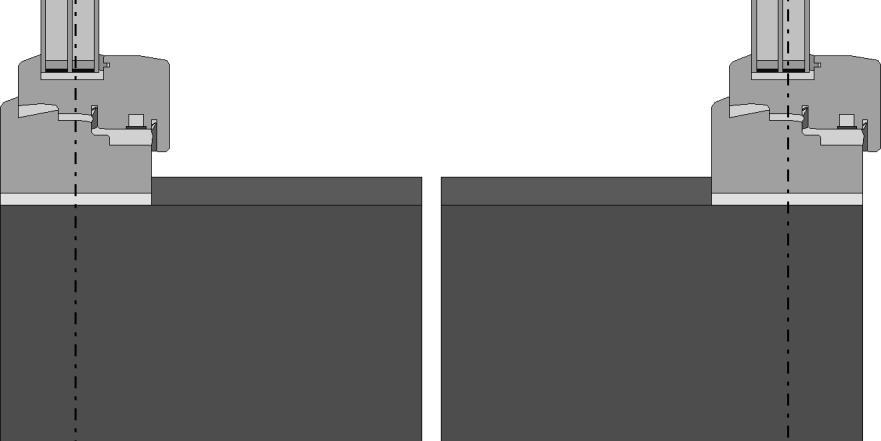
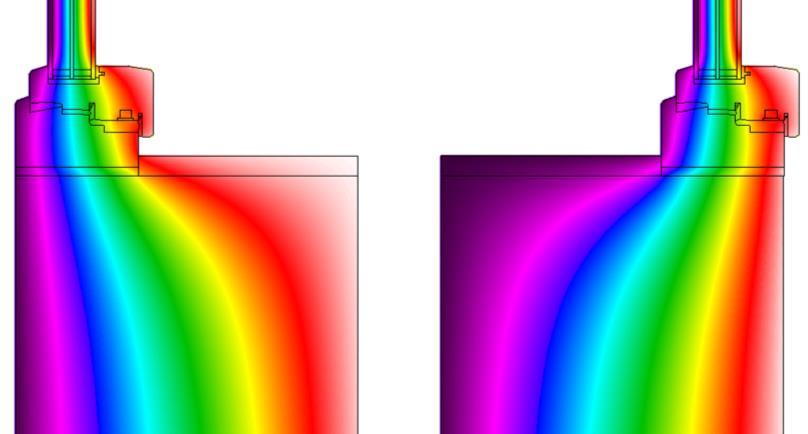
Calculations were carried out using data from various positions of window installation within the window opening in the wall, and the positions were gradually moved by 5 mm. The first extreme position was in the place where the window was aligned with the exterior surface and the other extreme position was aligned with the interior surface. The first extreme position was determined by the window frame axis being in the distance of 62.75 mm from the exterior surface (Fig. 1 – A); in the other extreme position the window frame axis was 287.75 mm from the exterior surface (Fig. 1 – B).
exterior interior exterior interior
A) B)
Fig. 1. Representation of the extreme positions of the window in the structure A) exterior position – 62.75 mm, B) interior position – 287.75 mm.
Fig. 2. Temperature field 2D model (HW) A) exterior position – 62.75 mm, B) interior position – 287.75 mm.
A) B)
C
RESULTS AND DISCUSSION
Individual models of window installation position in the wall construction were used to create a graphic illustration of the course of linear thermal transmittance of window installation. The graphic illustration of the Ψi development also includes the temperature development in the construction. This enables us to compare the window position with the minimum value Ψi,min and the position with the temperature 0°C.
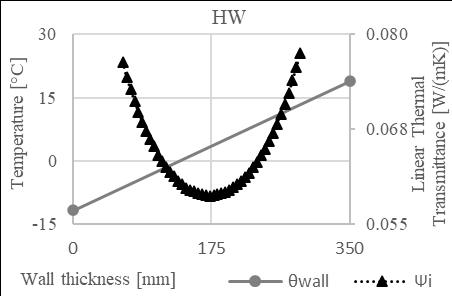
Fig. 3. Course of temperature and linear thermal transmittance for HW construction.
Fig. 4. Course of temperature and linear thermal transmittance for IHW1 and IHW2 constructions.
Fig. 5. Course of temperature and linear thermal transmittance for IHW1 and IHW2 constructions.
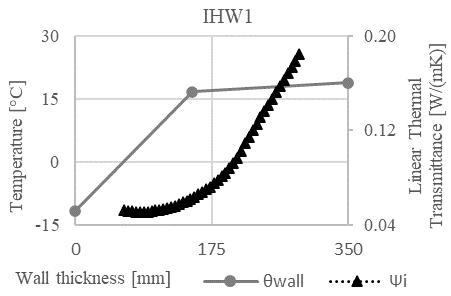
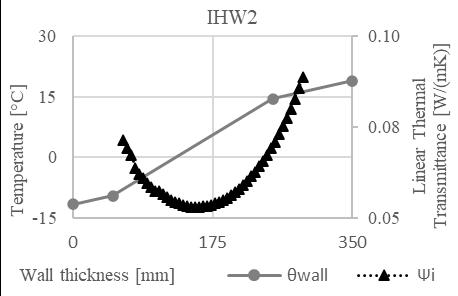
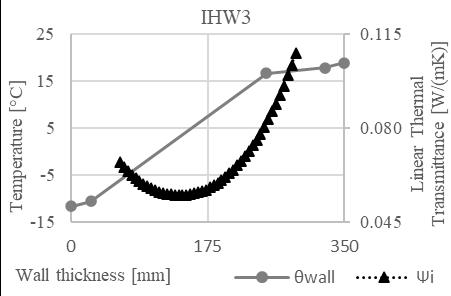
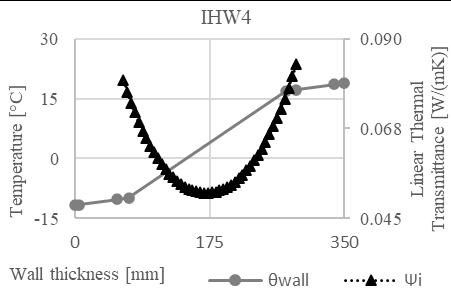
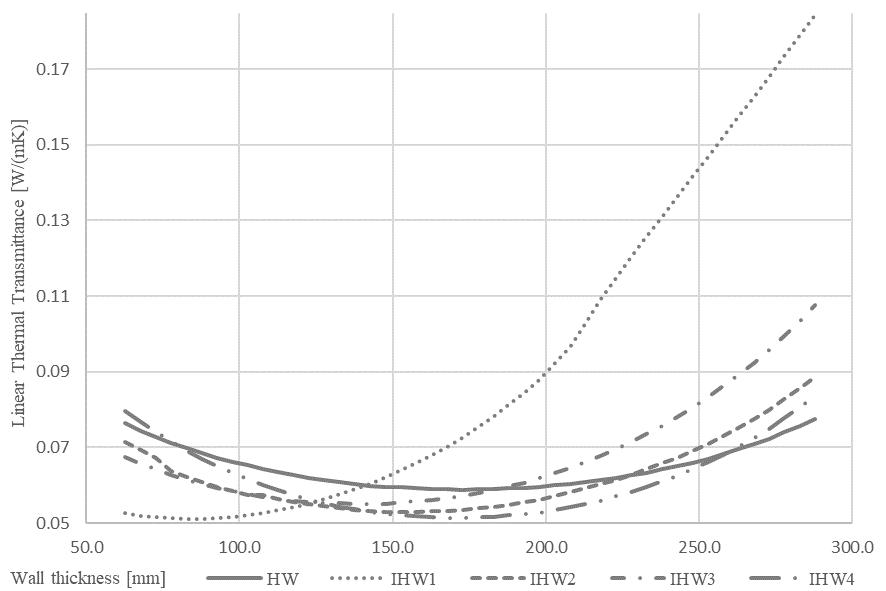
Fig. 6. Course of linear thermal transmittance for modelled constructions.
After establishing the equation for trend line of the Ψi values, the values of Ψi,min were calculated, and the line position (d Ψi,min) in individual wall constructions was established. Subsequently, the curve direction (m) of the temperature development was calculated in these construction parts. For a precise comparison the position of 0°C isotherm (d θ0) was determined in the wall construction, as well as the curve direction of the temperature development at that point (m θ0). See Tab. 4.
Tab. 4. Values of minimal linear thermal transmittance, position of Ψi,min, and temperature 0°C, and curve direction (m) of temperature distribution at Ψi,min, and 0°C place.
Experintal wall Ψi-min [W/m.K]
d (Ψi,min) [mm] (from exterior side) d (θ0) [mm] (from exterior side)
m (Ψi,min) [-]
m (θ0) [-] HW 0.0585 173.22 133.63 87.19 87.19 IHW1 0.0507 91.90 61.67 188.92 188.92 IHW2 0.0526 155.80 129.00 119.89 119.89 IHW3 0.0543 139.68 112.21 121.10 121.10 IHW4 0.0510 171.41 145.47 130.43 130.43
A) B) C) D) E)
C
Fig. 7. Course of Temperature field 2D models, position of Ψi,min A) HW, B) IHW1, C) IHW2, D) IHW3, E) IHW4.
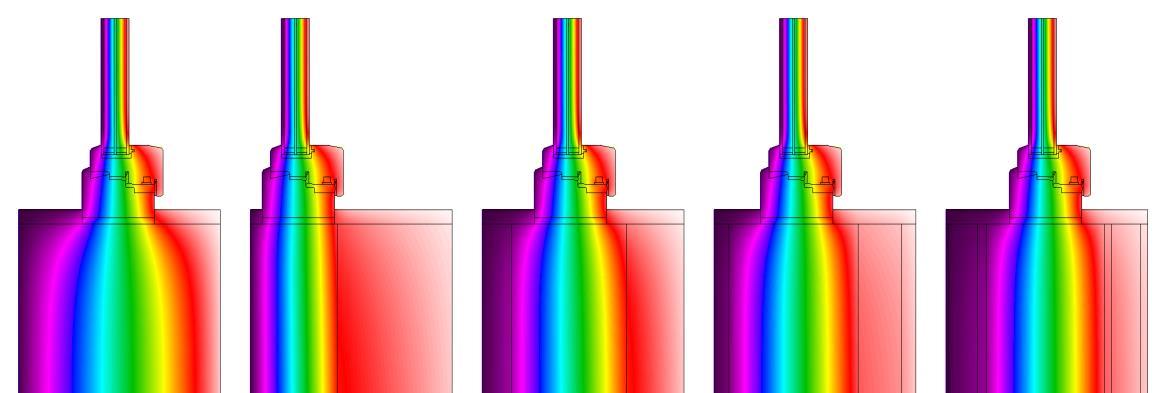
When comparing the zero temperatures and the position of the Ψi,min value, it can be seen that they are placed in the same segment of the construction temperature development. This segment can be, with all constructions, characterised by the steepest course of the temperature change. This implies that the construction parts have the biggest thermal resistance, i.e., it is the location of the main thermo-insulation component of the composition. When comparing the positions of dΨi,min and dθ0, their dependence represented by the linear correlation coefficient (r = 0.986) can be seen. This can lead to a conclusion that the position of Ψi,min shows almost perfect direct proportion relative to the position of the zero temperature in the wall construction. Their positions vary in the range between of 7 – 12 % when the temperature gradient is 32°C, whereas a composite wall has slighter difference, and a homogeneous wall shows a more prominent difference. See Tab. 5.
Tab. 5. Distance between temperature 0°C and minimum linear thermal transmittance, and curve direction of temperature distribution at place 0°C.
Experintal wall Δd (θ0 -Ψmin) [mm] Δd (θ0 -Ψmin) [%] m (θ0) [-] HW 39.60 11.31 87.19 IHW1 30.22 8.64 188.92 IHW2 26.80 7.66 119.89 IHW3 27.47 7.85 121.10 IHW4 25.93 7.41 130.43
When comparing only composite walls, the position of the minimum value Ψi,min and the curve direction of the temperature development in the position of this value shows linear correlation at the level of r = 0.89. This indicates a great direct proportion of the temperature change and linear thermal transmittance. However, the higher the number of layers is the less accurate the correlation is. In addition, when adding the homogeneous wall, the linear correlation indicates a mean inverse proportion of the values (r = -4.415).
CONCLUSIONS
The hypothesis that the position of Ψi,min depends on the steepness and the course of temperature development in the construction, which was set in the study of NÔTA and DANIHELOVÁ (2021) cannot be confirmed, based on these data. On the contrary, the direct proportion can be rejected. Nevertheless, it can be concluded that with the steady-state border conditions and overall temperature gradient of 32°C, the best place for window installation is located at 7 – 12 % of the overall wall thickness towards the interior, measured from the position of the 0°C temperature in the studied construction. The data are conditioned by the fact that the window installation detail is not modified in any way, e.g., by overlying the window frame by exterior insulation. Such modifications change the conditions and must be assessed individually.
REFERENCES
ZÁKLADNÉ ŠTATISTICKÉ METÓDY. 2022. AMOS Projekt elektronického vzdelávania na UKF, 202206-04, on line: <https://amos.ukf.sk/mod/book/view.php?id=8452&chapterid =3191>, Univerzita Konštantína Filozofa v Nitre. BARNES, B., PAGÁN-VÁZQUEZ, A., LIESEN, R., YU, J., ALEXANDER, N. 2013. Window related thermal bridges. In Thermal Performance of the Exterior Envelopes of Whole Buildings XII International Conference, Proceedings of a meeting held 1-5 December 2013, Clearwater, Florida, USA, ISBN 9781510827837.
BUNDESVERBAND FLACHGLAS E.V.2018.Data sheetPsi values for windows,based on determination of the equivalent thermal conductivity of spacers by measurement, for the Chromatech ultra F (Nr. W 16 3-10/2018C, 2019, B.C. Reference Procedure for Using THERM to Determine Window Performance Values for Use with the Passive House Planning Package. 2022-06-04, On-line: <https://www.fen-bc.org/resource_details.php?id_resource=3>, Fenestration Association of BC, 2019. HALAHYJA,M, ET AL.,1985.Stavebá tepelná technika, akustika a osvetlenie, ALFA – vydavateľstvo technickej a ekonomickej literatúry, Bratislava, 1985. HØYDAL, G. H., AURLIEN, T., ZAMRZYCKI, T. 2019. Kuldebroer ved vindusinnsetting - Termal Bridges for Window-to-Wall Connections, Masteroppgave, Norwegian University of Life Sciencest.
HUIZENGA, CH., ARASTECH, D., CURCIJA, CH., MITCHEL, R., KOHLER, CH., FINLAYSON, E., et al. 2021.THERM Fine Element Simulator v7.8.16.0: Program description. A PC program for analyzing the two-dimensional heat transfer through building products. Berkeley. California: University of California 2021. MISIOPECKY, C., BOUQUIN, M., GUSTAVSEN, A., JELLE, B.P. 2017. Thermal modeling and investigation of the most energy-efficient window position, in: Energy & Buildings, vol. 158, pp. 1079-1086, Elsevier B.V. DOI: 10.1016/j.enbuild.2017.10.021 NÔTA, R., DANIHELOVÁ, Z. 2021. Analysis of the thermal bridge of wood-aluminum window installation position. In Acta Facultatis Xylologiae Zvolen, 63(2): 93−102 ISSN 1336-3824. DOI: 10.17423/afx.2021.63.2.08 O´GRADY, M., LECHOWSKA, A. A., HARTE, A. M. 2018. Application of infrared thermography technique to the thermal assessment of multiple thermal bridges and windows. In Energy & Buildings, vol. 168, pp. 347-362, Elsevier B.V, 2018, ISSN 0378-7788, DOI: 10.1016/j.enbuild.2018.03.034 STN 73 0540-2/2012, Thermal protection of buildings. Thermal performance of buildings and components. Part 2: Functional requirements, ÚNMS SR, 2012. STN 73 0540-3/2012, Thermal protection of buildings. Thermal performance of buildings and components. Part 3: Properties of environments and building products, ÚNMS SR, 2012. STN EN ISO 10077-1/2019, Thermal performance of windows, doors and shutters – Calculation of thermal transmittance – Part 1: General, ÚNMS SR, 2019. TERENTJEVAS, J., ŠADAUSKAITE, M., ŠADAUSKIENE. 2021. Numerical investigation of buildings point thermal bridges observed on window-thermal insulation interface. In Case Studies in Construction Materials, vol. 15, e00768, Elsevier B.V, 2021, ISSN 2214-5095, DOI: 10.1016/j.cscm.2021.e00768
AUTHOR ADDRESS
Ing. Roman Nôta, PhD. Technical University in Zvolen Department of Furniture and Interior Design T.G. Masaryka 24 960 53 Zvolen nota@tuzvo.sk


