15 minute read
INSTALLATION POSITION


ACTA FACULTATIS XYLOLOGIAE ZVOLEN, 63(2): 93−102, 2021 Zvolen, Technická univerzita vo Zvolene DOI: 10.17423/afx.2021.63.2.08
ANALYSIS OF THE THERMAL BRIDGE OF WOOD-ALUMINUM WINDOW INSTALLATION POSITION
Advertisement
Roman Nôta – Zuzana Danihelová
ABSTRACT
Low-energy houses and passive houses are characterised by having building envelopes with low thermal resistance. Windows of such buildings are required to meet higher demands in terms of heat thermal as well. The window installed in the wall creates a structural thermal bridge, whose size is strongly affected by the thermal performance of the structural components as well as by the position of the window within the opening in the envelope. The objective of the paper was to analyse the impact of the window installation position in the envelope with various construction types and to determine the best possible place for installing the window. Mainly the position of the lower edge is discussed since this part demonstrates the worst values in terms of thermal performance. Due to the presence of the metal windowsill, the window frame is protected to a minimum extent by the outside insulation of the envelope. Therefore, the lower edge indicates the most significant thermal bridge. It was assumed that the most effective position of the window lower edge within the window opening, which has the lowest value of the linear thermal transmittance of the thermal bridge, is in places of the smallest deformation of the thermal field caused by window installation. The calculations showed that the proportion of the deformation size of the thermal field and the value of the linear thermal transmittance of window installation (Ψinstall.), in other words, their position in the structure, depend also on the curve direction of the temperature distribution in the envelope construction. Key words: thermal bridges, linear thermal transmittance, window, envelope structure.
INTRODUCTION
Energy efficiency of buildings is closely associated with the number and size of thermal bridges. Currently, the thermal bridges in the building envelope can be avoided by proper insulation of a hight quality. In the case of building envelopes based on wood, this can be achieved also by creating a sufficiently tight envelope preventing humid air from penetrating into the layer of thermal insulation, which would subsequently cause a decrease in the efficiency of thermal insulation. OSB4 boards as the airtight layer are considered the best replacement of foils with high diffusion resistance (SEDLÁK et al.2020).Outside walls based on silicate building materials do not require the airtightness to such extent. If the building envelope does not contain any significant thermal bridges in terms of geometry (corners) or material (e.g. load-bearing elements made of sandwich constructions), or the thermal bridges are sufficiently eliminated, the building indicates a good energy efficiency without the occurrence of adverse water vapour condensation on its interior surface.
The installation of windows and doors is the most significant combined thermal bridge (geometry and material), which virtually cannot be eliminated (O´GRADY et al.2018,BARNES et al. 2013). The size of the thermal bridge depends on various factors, e.g. construction (NÔTA 2016) and material for the window production or the type of wood in case of wood windows (AHN,PARK 2020). When installing the windows, the most suitable method of eliminating the thermal bridge is to sufficiently overlay the window frame by thermal insulation used for the outside of the envelope (IGELI et al.2014,CAPPELLETTI et al.2011).
The weakest point in the entire window system is the sill. Overlaying of the window frame at this point is difficult due to the need of creating a construction system for draining the water, either rainwater or condensed water, in the decompression cavity of the window construction. Water most often flows down on the metal (aluminium) overlaying of the envelope – outside windowsill, which is partially connected with the construction of the window and thus creates a thermal conductor. The thermal performance of wood-aluminium windows is partially balanced by the aluminium window parts, and in the case of windows designated for passive houses with lower value of Uf, the impact on the window thermal performance is low.
For determining the thermal performance of installed window, compared to the window itself, the relation for calculating the Uw value (EN ISO 10077-1:2019) is modified by adding the linear thermal transmittance of window installation Ψi [W/(m.K)]and relation for calculating the thermal transmission through installed window Uwi is created:
Uwi= Uw∙Aw+ ∑ li∙Ψ i
Aw
(1) where Aw is the overall window surface and li is the length of window groove for sill installation (AUTHORS 2020).
THEORETICAL – EXPERIMENTAL PART
The value of Ψi was determined for 5 various wall constructions and one window construction. The wall thickness was constant. The wall constructions were divided as follows: 2x wooden construction: sandwich construction (WC1) a log cabin construction (WC2), 2x brick construction: aerated concrete blocks (BC1) a brick wall with insulation (BC2), 1x polystyrene construction system with reinforced concrete (PCS).
Wood-aluminium window with additional insulation designated for passive buildings was used in all models.
Calculation of Ψi-value was carried out according to the methodology “B.C. Reference Procedure for Using THERM to Determine Window Performance Values for Use with the Passive House Planning Package. The “BC Reference Procedure” published in September 2019 is the first methodology using LBL THERM software to be recognized by the Passive House Institute for use in certifying Passive Houses to the International Passive House Standard“ (AUTHORS 2019).
It was conducted by modelling in computer programme THERM 7.6 (HUIZENGA et al. 2017). Boundary conditions for the calculation were according to the standard STN 73 0540.
Reference temperature: internal external Reference surface resistance: internal external θi = 20.0 °C (293.15 K) θe = -12.0 °C (261.15 K) Rsi = 0.13 (m2 .K) /W Rse = 0.04 (m2 .K)/W
Tab. 1 Wall compositions, Coefficient of thermal conductivity of wall materials and U-value of walls. Layers Thickness [m] λ [W/(m.K)] Uwall [W/(m2 .K)]
WC1 – sandwich construction
Exterior mineral plaster 0.008 0.800 Fiberboard 0.060 0.050
Mineral Fiber insulation I beam (OSB+ Picea Abies (L.)) OSB Fame Cavity – simplified + Wooden grate (Picea Abies (L.)) SDK 0.300 0.045 * 0.018 0.130 0.040 0.208 ** 0.0125 0.150 0.118
WC2 – log cabin construction
Log Cabin (Picea Abies (L.)) Mineral Fiber insulation Wooden grate (Picea Abies (L.)) Frame Cavity Slightly Ventilated + Wooden grate (Picea Abies (L.)) Wooden siding (Picea Abies (L.))
BC1 – aerated concrete blocks
Exterior mineral plaster Aerated concrete blocks Interior mineral plaster
BC2 – brick wall with insulation
Exterior mineral plaster Mineral fiber insulation Bricks 0.191
0.110 0.200 0.043 * 0.028 0.306 ** 0.019 0.110
0.008 0.420 0.010 0.800 0.130 0.700
0.008 0.120 0.300 0.800 0.034 0.155 0.146
0.293
0.175
Interior mineral plaster
PCS – polystyrene construction system
Exterior mineral plaster Polystyrene EPS 70Z Reinforced concrete 0.010 0.008 0.210 0.140 0.700 0.800 0.039 1.430 0.134
Polystyrene EPS 70Z 0.070
0.039 Interior mineral plaster 0.010 0.700 * Wooden supporting grate (wooden beam λ=0.11 or I beam: OSB 9mm and wood 40x60 mm) 2pieces per meter and mineral fibre insulation λ=0.034. ** Equivalent thermal conductivity (λeq) of air cavities was determined according to the algorithms in the software program THERM, modelled using the ISO 15099 (Thermal performance of windows, doors and shading devices – Detailed calculations) cavity Model
Calculations were carried out using data from various positions of window installation within the window opening in the wall, and the positions were gradually moved by 10 mm. The first selected interior position was a place where the distance of the 0°C isotherm of glazing was 268 mm from the exterior (the overall thickness of the walls was ca. 438 mm). Altogether, 21 positions of window installation in the window opening were used in the model calculations (24 with BC2 and PCS). In modelling, the impact of the hardware used for fitting the window, especially for attaching to the insulation, was neglected. The exterior windowsill was modelled from 2 mm sheet aluminium (λ = 160W/(m.K)), the insulation in the groove for sill installation from polyurethane foam (λ = 0.024W/(m.K)) and the interior sill was from particleboard (λ = 0.11W/(m.K)).
The Uf = 0.7 W/(m2.K) was adopted from NÔTA, 2020. The window labelled in the publication as ALP2 was used as the model window. It is a wood-aluminium window construction designated for passive buildings. The used model of insulation glazing (IGU) was three panes insulated glazing unit with the thickness of 48 mm (4-18-4-18-4) with Ug = 0.6W/m2K. The Ψg-value was 0.033 W/mK for 2Box Model of the spacer profile Chromatech Ultra F (BUNDESVERBAND FLACHGLAS E.V. 2016).
WW1-1 WW1-10 WW1-20
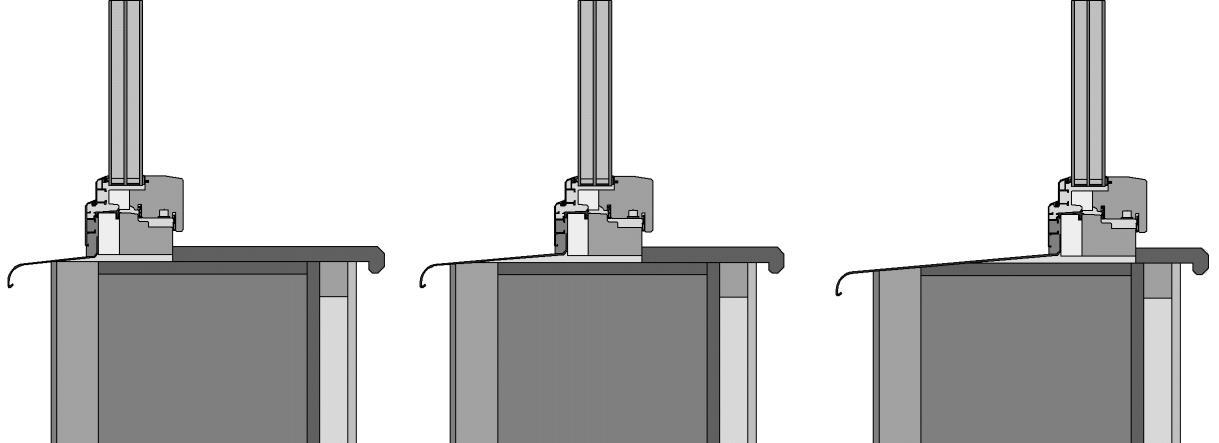
Fig. 1 Outside-end (WC1-1), central (WC1-10) and inside-end (WC1-20) window installation in the window opening of the wall WC1.
For each of the model situations the size of thermal field deformation caused by the window position was determined. The size of the deformation was expressed numerically using the 0°C isotherm deviation distance measured in the places of equal distribution of the thermal field in the construction of the envelope and in IGU. This value was labelled as Δbθ0 (Fig. 2).
θ0 Δ b
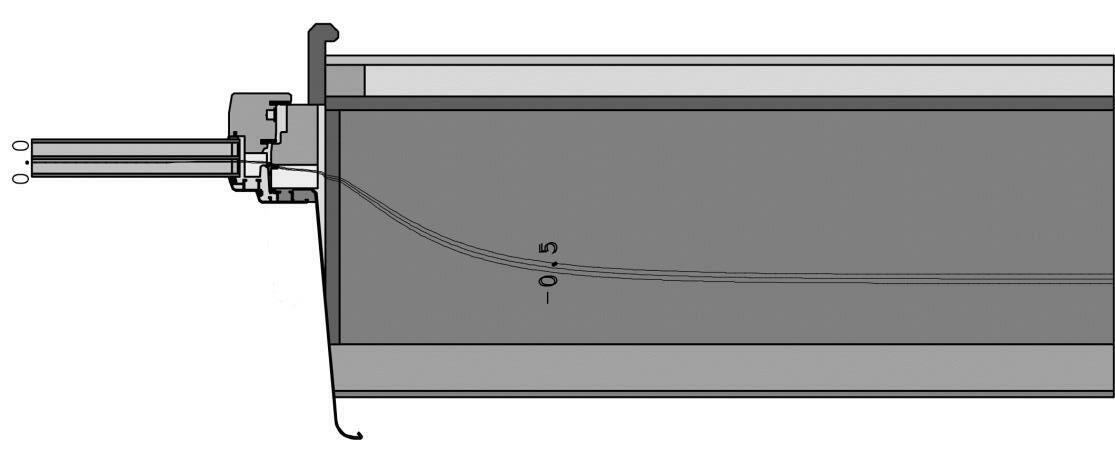
Fig. 2 Size of the thermal field deformation – 0°C isotherm deviation (Δbθ0)
RESULTS AND DISCUSSION
The individual calculated Ψi values from models of window installations were used to plot a graph illustrating the change in terms of the widow position within the window opening (Fig. 3 –7). The course of Ψi was compared to the value of thermal field deformation in order to compare a possible dependence between this deformation and the size of the linear thermal transmittance. The course of Ψi illustrated graphically is in accordance with studies by e.g. MISIOPECKI et al. 2017 a HØYDAL 2019.
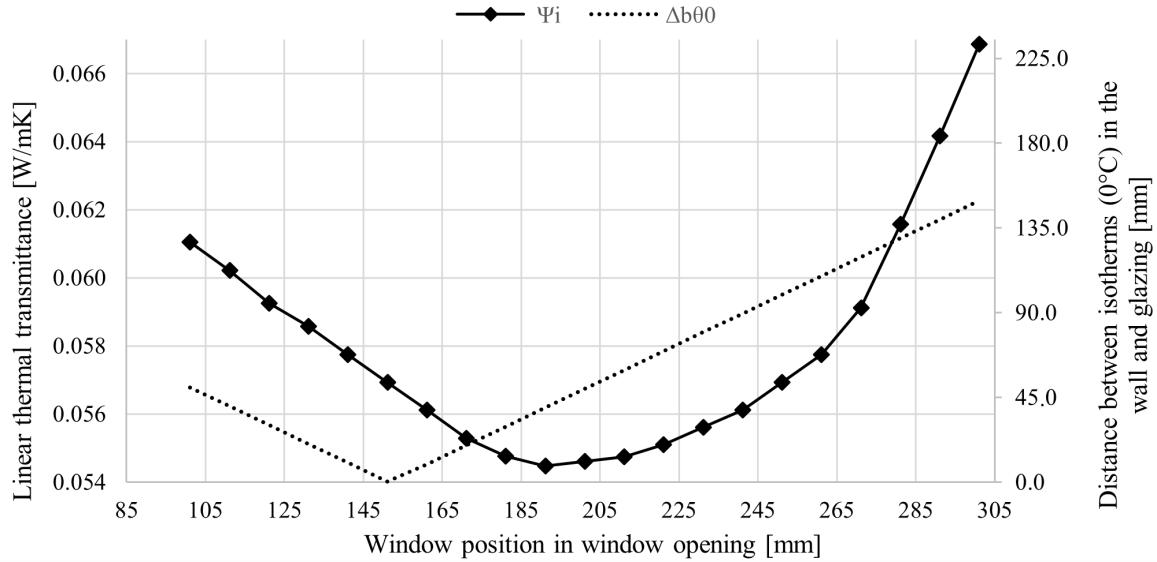
Fig. 3 Course of Ψi values and Δbθ0 in WC1.
Fig. 4 Course of Ψi values and Δbθ0 in WC2.
Fig. 5 Course of Ψi values and Δbθ0 in BC1.
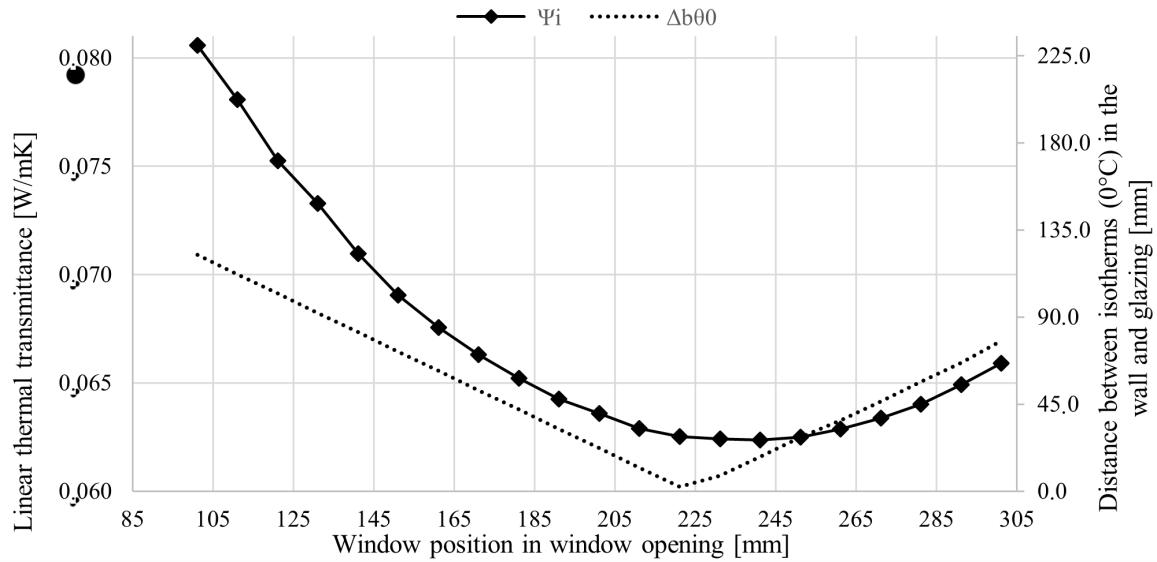
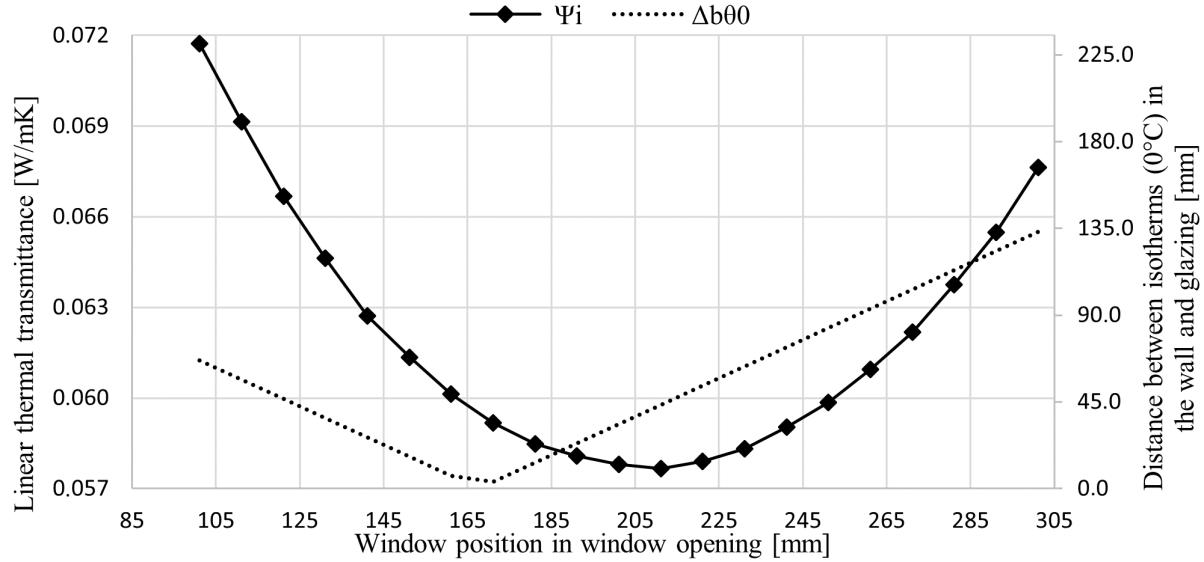
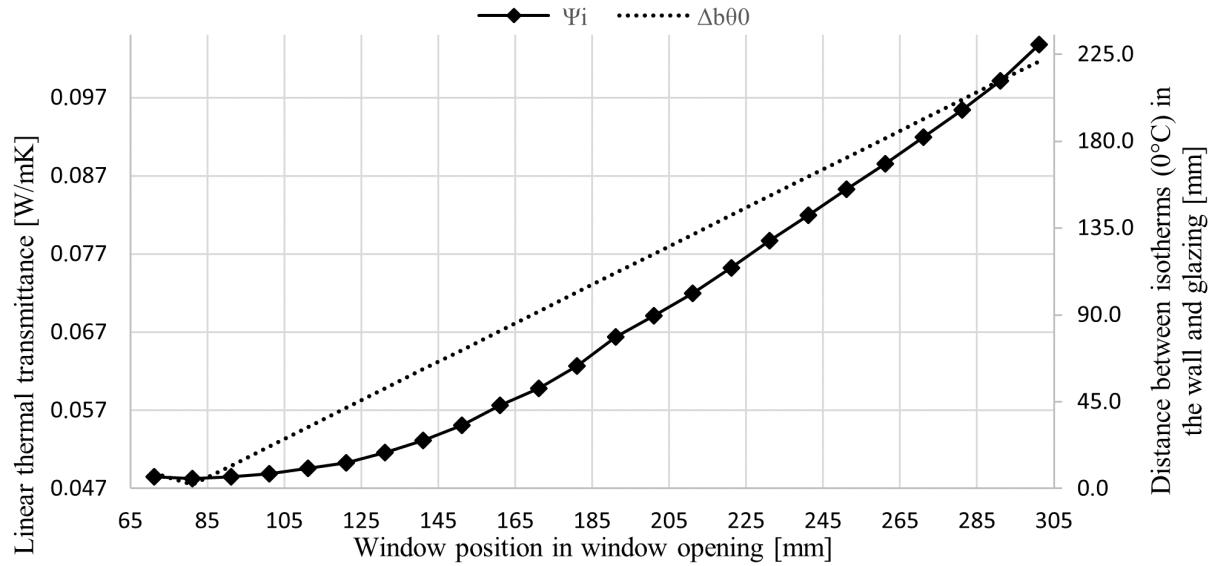
Fig. 6 Course of Ψi values and Δbθ0 in BC2.
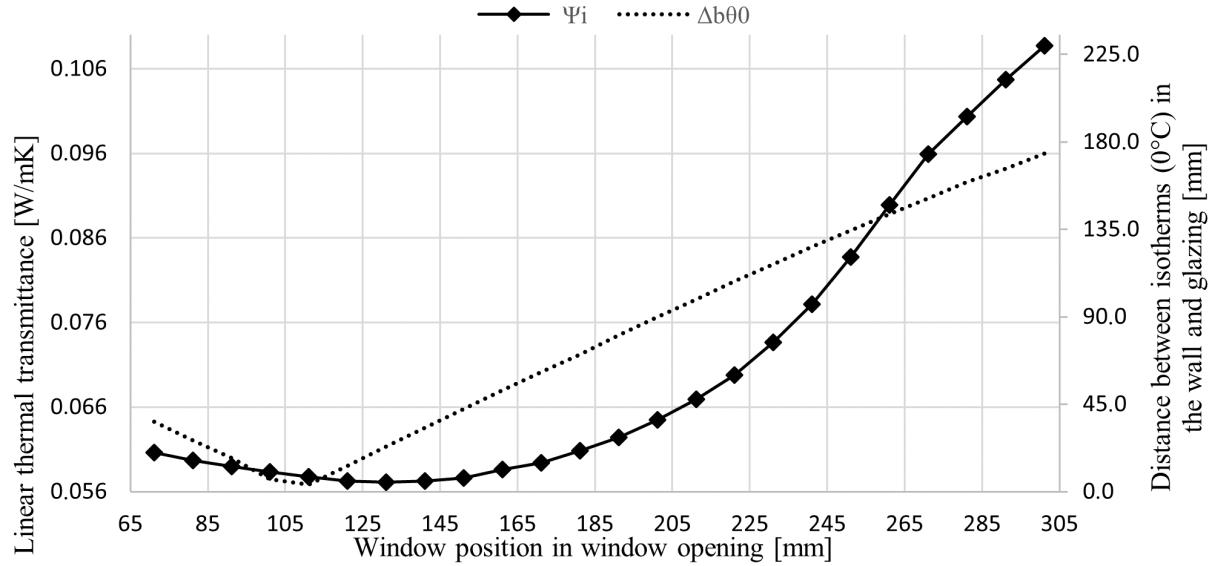
Fig. 7 Course of Ψi values and Δbθ0 in PSC.
The graphs indicate that the greater the thermal field deformation is, the higher the Ψi value is. Although it was assumed that if the thermal field deformation is minimal, the Ψi value will be minimal as well (Δbθ0 = 0 ꓥ Ψi = min), this assumption was confirmed only in the case of construction BC2. In other cases, the minimum values of Ψi, with the lowest value of Δbθ0, were shifted by 20 and 40 mm into the interior – see Tab. 2 and Fig. 8. It represents a relative shift of 5.75 % and 11.49 % respectively, regarding the thickness of the envelope. This shift was labelled as ΔbΨθ.
Tab. 2 ΔbΨθ for individual envelope constructions. Wall construction
WC1
WC2
BC1
BC2
PSC

ΔbΨθ [mm] [%] 40.0 11.49 20.0 5.75 40.0 11.49 0.0 0.00 20.0 5.75
Ψθ Δb
11.49% 11.49%
5.75%
0.00% 5.75%
WC1 WC2 BC1 BC2 PCS
Fig. 8 ΔbΨθ for individual envelope constructions.
When assessing the discrepancy between the assumption and results, the position of Δbθ0 = 0 and Ψi = min was shown graphically by the temperature distribution in the envelope construction. This procedure was selected due to the ability of analysing the temperatures and thermal field deformation, since the temperature of the construction or 0°C value was selected as the major parameter for assessment.
When comparing the temperature distribution in individual wall compositions, where the distances are the same as per the calculations, i.e. WC1 vs. BC1 and WC2 vs. PCS, where the ΔbΨθ is zero, it can be seen that the value of ΔbΨθ decreases with the increasing value of curve direction (m) of temperature development (Fig. 9, 10 and 11). This curve direction was determined at the point where the minimum value of Ψi and zero value of Δbθ0 intersect.
A) B)
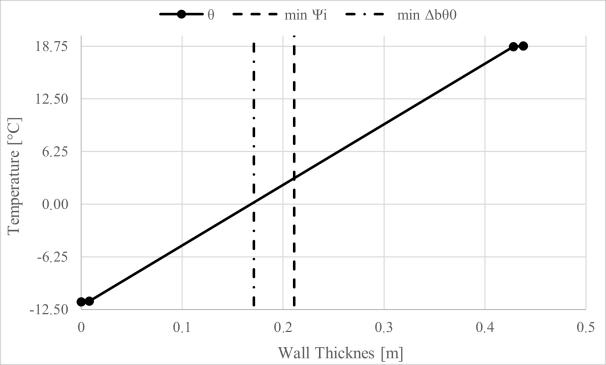
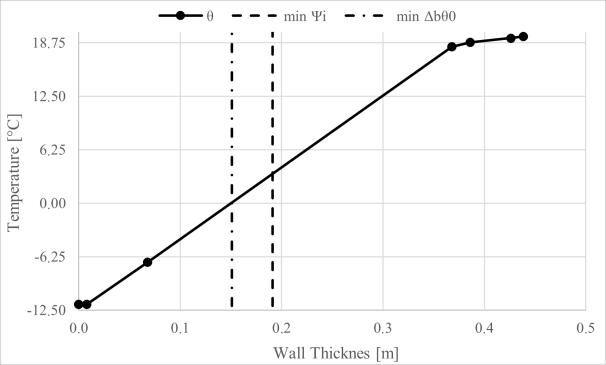
Fig. 9 Temperature distribution with marking min Ψi a min Δbθ0 (A) – WC1, B) – BC1)
A) A) B)B)
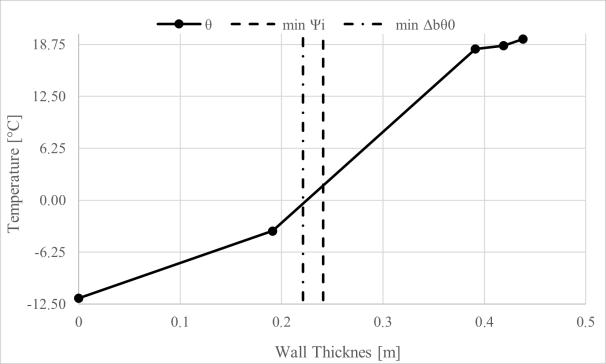
Fig. 10 Temperature distribution with marking min Ψi a min Δbθ0 (A) – WC2, B) – PCS)
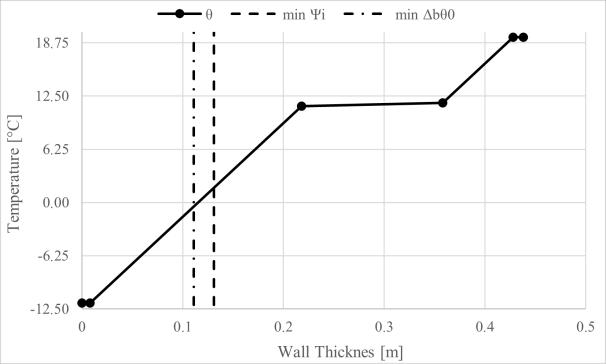
Fig. 11 Temperature distribution with marking min Ψi a min Δbθ0 (BC2)
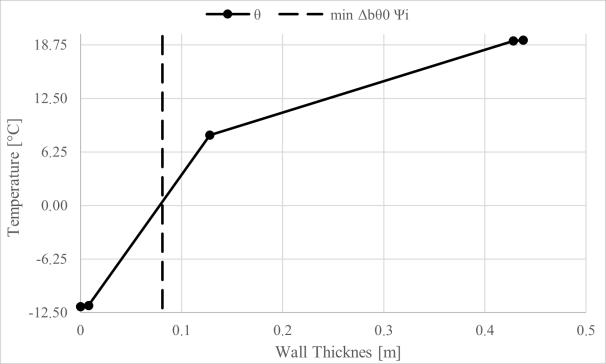
Thermal transmittance is the main way of thermal conduction in materials that the envelope consists of and values Δbθ0 = 0 and Ψi = min. are in solid substances. At the steady
state (at which the individual situations were modelled), the temperatures at individual points of a body are determined only by their position, and the temperature curve is represented by a straight line. The line direction can be derived from the density of the heat flow rate. For the steady state and θi(e) = θsi(se) conditions it can be expressed as: m =
∆θs d
(2) where Δθs the difference between the temperatures on the layer surfaces and d is the thickness of this layer (HALAHYJA et al. 1985).
In the present models, the minimum values of the linear thermal transmittance of window installation are located in the wall layer where the 0°C isotherm occurs. The values of directions in the curve parts where Δbθ0 = 0 and Ψi = min occurred are provided in Tab. 3 and Fig. 12.
Tab. 3 Values of curve direction of temperature distribution in the envelope vs. ΔbΨθ.
m WC1 84.00 WC2 109.20 BC1 71.90 BC2 165.80 PCS 110.00
ΔbΨθ [%] 11.49 5.57 11.49 0.00 5.57
12%
Ψθ Δb
8% 4% 0%
60 80 100 120 140 160 Slope Fig. 12 Dependence of m on ΔbΨθ
The course of curve direction dependence of the temperature distribution in the construction and the size of the thermal field deformation (ΔbΨθ) indicates a certain dependence between these two values. However, from already published and available studies and the present models, this dependence cannot be determined precisely.
CONCLUSIONS AND FUTURE WORK
The present models compared the dependence of window installation position in the window opening and the values of linear thermal transmittance of window installation. Subsequently, the course of transmittance values was compared with the size of the thermal field deformation in the detail of window installation in order to assess their dependence.
One widow construction and five wall constructions (two wood-based walls, two walls composed of brick components, one cast-in-place reinforced concrete wall) were used in the research. It was assumed that the minimum deformation of the thermal field caused by the thermal bridge of window installation will be accompanied by a lower value of linear thermal transmittance. However, this assumption was confirmed only in one of the five studied models. After plotting the minimum values of Ψi and thermal field deformation into the temperature distribution in the construction, a possible dependence between the lowest value of Ψi and thermal performance of the construction was indicated. The difference between the minimum value of Ψi and minimum thermal field deformation decreases with an increasing absolute value of the curve direction of the temperature distribution in the construction.
However, due to the low number of studied models, this dependence cannot be determined precisely. Therefore, it is inevitable to verify the dependence in a study with a higher number of models.
REFERENCES
AUTHORS 2020.Information, Criteria and Algorithms for Certified Passive House Components: Sun Protection and Window installation Systems, Version 2.0, 2020-07-03, on line: <https://passivehouse.com/03_certification/01_certification_components/02_certification_criteria/0 1_transparentcomponents/01_transparentcomponents.html>, Passive House Institute, Darmstadt, 2020 AUTHORS 2019, B.C. Reference Procedure for Using THERM to Determine Window Performance Values for Use with the Passive House Planning Package. On-line: <https://www.fenbc.org/resource_details.php?id_resource=3>, Fenestration Association of BC, 2019. AHN, N, PARK S, 2020. Heat transfer analysis of timber windows with different wood species and anatomical direction. In Energies, vol. 13, MDPI, Basel, Switzerland, 2020, ISSN 1996-1073 BARNES B., PAGÁN-VÁZQUEZ, A., LIESEN, R., YU, J., ALEXANDER, N., et al.2013. Window related thermal bridges. In Thermal Performance of the Exterior Envelopes of Whole Buildings XII International Conference, Proceedings of a meeting held 1-5 December 2013, Clearwater, Florida, USA, ISBN 9781510827837 BUNDESVERBAND FLACHGLAS E.V. Data sheet Psi values for windows, based on determination of the equivalent thermal conductivity of spacers by measurement, for the Chromatech ultra F (Nr. W 16 3-10/2018 CAPPELLETTI,F.,GASPARELLA,A.,ROMAGNONI,P.,BAGGIO,P.,.2011,Analysis of the influence of installation thermal bridges on windows performance: The case of clay block walls. In Energy and Buildings, 43: 14351442, Elsevier B.V, 2011, ISSN 0378-7788, DOI: 10.1016/j.enbuild.2011.02.004 IGELI,R.VAVROVIČ,B.,ČEKON,M.,PAULOVIČOVÁ, L., 2014.Thermal bridges minimizing through window jamb in low energy buildings. In Advanced Material Research, vol 899, pp 6669, Trans Tech Publications, Switzerland, ISSN 1662-8985, DOI: 10.4028/www.scientific.net/AMR.899.66 HALAHYJA, M. et al. 1985, Stavebná tepelná technika, akustika a osvetlenie, Bratislava ALFA, 2019, Kuldebroer ved vindusinnsetting - Termal Bridges for Window-to-Wall Connections, Masteroppgave, Norwegian University of Life Sciencest, 2019 HUIZENGA, CH. et al. 2017. THERM Fine Element Simulator v7.6.1.0: Program description. A PC program for analyzing the two-dimensional heat transfer through building products. Berkeley. California: University of California 2017. MISIOPECKY, C. , BOUQUIN, M., GUSTAVSEN, A., JELLE, B.P. 2017, Thermal modeling and investigation of the most energy-efficient window position. In Energy & Buildings, vol. 158, pp. 10791086, Elsevier B.V, 2018, ISSN 0378-7788, DOI: https://doi.org/10.1016/j.enbuild.2017.10.021 NÔTA, R. 2020, Okná na báze dreva: tvarové riešenie profilu vo vzťahu k tepelnotechnickým vlastnostiam (Wood-based windows: shape solution profile with respect to thermal properties) Zvolen: Technická univerzita vo Zvolene, 2020. ISBN 978-80-228-3228-1 NÔTA, R. 2016, Thermal performance of wood aluminum and wooden windows. In Acta Facultatis Xylologiae Zvolen, 58(1): 8394 ISSN 1336-3824. DOI: 10.17423/afx.2016.58.1.10 O´GRADY, M., LECHOWSKA, A. A., HARTE, A. M. 2018, Application of infrared thermography technique to the thermal assessment of multiple thermal bridges and windows. In Energy & Buildings, vol. 168, pp. 347362, Elsevier B.V, 2018, ISSN 0378-7788, DOI: https://doi.org/10.1016/j.enbuild.2018.03.034 SEDLÁK, P., BEDNÁR, J., BÚRYOVÁ. D. 2020. Air permeability of OSB and its influence to heating energy costs. In Sustainability of forest-based industries in the global economy: proceedings of scientific papers: Vinkovci, Croatia, September 28th-30th 2020, p. 279-284/; Zagreb: WoodEMA, i.a.: University of Zagreb, Faculty of Forestry, 2020. ISBN 978-953-57822-8-5 STN 73 0540-2/2012, Thermal protection of buildings. Thermal performance of buildings and components. Part 2: Functional requirements, ÚNMS SR, 2012 STN EN ISO 10077-1/2019, Thermal performance of windows, doors and shutters – Calculation of thermal transmittance – Part 1: General, ÚNMS SR, 2019
AUTHOR´S ADDRESS
Ing. Roman Nôta, PhD. Department of Furniture and Interior Design Technical University in Zvolen T.G. Masaryka 24 960 01 Zvolen nota@tuzvo.sk Mgr. Zuzana Danihelova, PhD. The Institute of Foreign Languages Technical University in Zvolen T.G. Masaryka 24 960 01 Zvolen


