4 minute read
of smart cities
Mapping the future of smart cities
Craig Evenden, a BIM specialist at mapping software company Esri UK, explains what geospatial information and visualisation can contribute to the planning, construction and management of more connected urban environments.
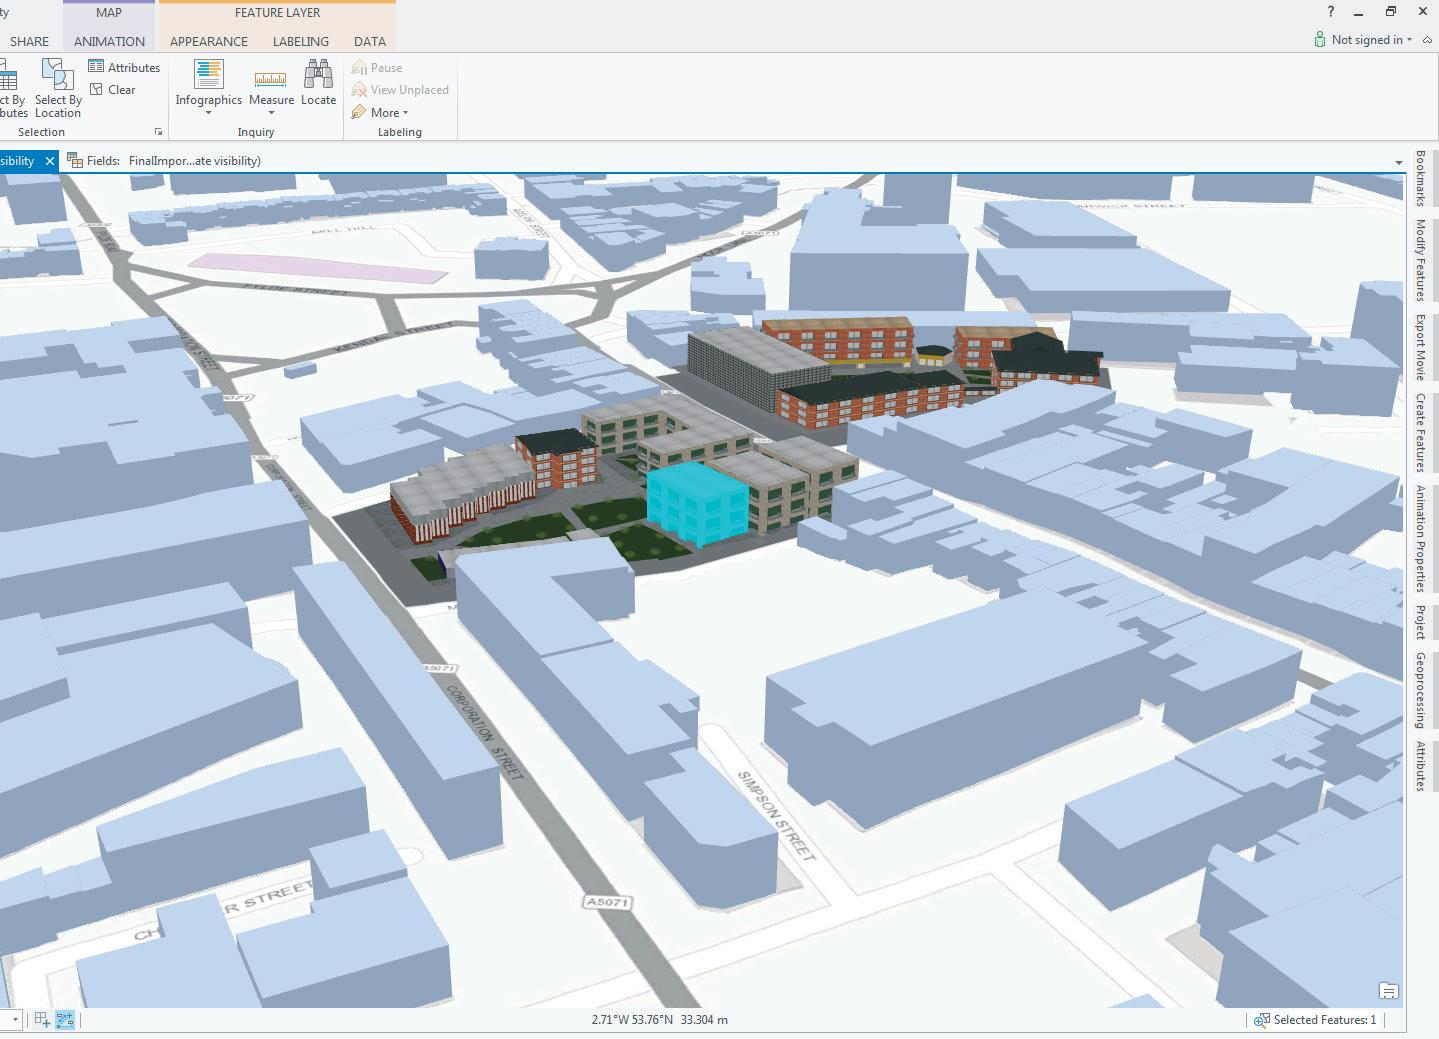
Using ArcGIS desktop tools to explore how a concept design for a urban redevelopment relates to its neighbourhood
Last year, charity Population As research company Trading Matters warned of the pressure Economics correctly identifies, there is that population growth is put- consistent growth in urban population ting on public services in the sizes in the UK, while rural populations UK. As a cautionary note, it’s not exactly decrease at a similar rate. news: we’ve heard it from plenty of public Increased demand for space isn’t the figures and govern- only issue. There is ment agencies, stressing that not only is the About the author also demand for a more connected size of the population As head of Esri UK’s world. The rise of soaring, but also that AEC sector business, the smart city puts there is a correspondCraig Evenden leads the company’s GIS and BIM further pressure on ing rise in urbanisation strategy. He has worked construction, posing and, with it, mounting with a range of major a threat to budgets pressure on building construction organisa- in the planning and and construction. Forecasts from most tions to help deliver greater project understanding through the use of geospatial technology. construction phases. Smart cities need parts of the world rare- smart planning. The ly paint a picture of use of data plays a population stagnation and, while huge role here. Those in the construction the numbers given can never be perfectly and architectural industries need tools accurate, the trend of population to be able to analyse and visualise data growth highlights the scale of planning in the design and planning that will be needed in future in order to of smart buildings. tackle its challenges. Designing in isolation, after all, is an impossible task in an age where there are so many different considerations and parties that need to be taken into account and involved in the process. It is critical that correct information is displayed in easy-to-view formats. Information visualisation is thus the most digestible method for all parties in the construction lifecycle.
Where GIS meets BIM Geographic Information Systems (GISs) are playing a pivotal role in the ecosystem of tools that enable the BIM process and, in particular, in facilitating the movement of data through the BIM lifecycle from planning and design to build and operate. Companies are adopting GIS as part of their BIM strategies, in order to drive efficiency and support digital handover processes. GIS software fulfils the BIM requirement for data to be shared between different contractors, working on different areas of the project, to streamline project
lifecycles right from the outset. The tech- jects, we see it being used for everything must plan, design, build and operate nology allows project managers to from CCTV planning to analysing the infrastructure within a much wider instantly visualise layers of each building potential impacts of flooding. framework that takes into consideration and call up relevant project information – As the technology matures, 3D map- not only structures already built, but also including from mobile devices they use ping has become more of a critical com- the natural environment and how this on site. Relevant and focused information ponent to planning, with huge benefits fits into the wider picture. can also be shared with all stakeholders for visualisation and analytics, because it The interactive visualisation of datathrough apps and dashboards. supports even more informed decision- sets has enormous benefits for AEC busi With both smart and conventional building structures, it isn’t just bricks and mortar that need to be considered. Transport infra‘‘ 3D mapping doesn’t just provide a nesses. It allows for a more holistic view of the information they have at hand and, perhaps most critically, it gives project managstructures, for instance, need to dumb visualisation, but also a layer of ers the opportunity to assess and be taken into account, too, because businesses will need to both data and intelligence deal with any issues in the planning phase, before construction determine whether proposed buildings will be accessible to the people that need to use them. making than was possible before. 3D ’’ gets underway. As ground-breaking work by organisations like Skanska, Crossrail 3D mapping is increasingly being used mapping doesn’t just provide a dumb vis- and Highways England demonstrates, a in a variety of innovative and interesting ualisation, but also a layer of both data coherent BIM strategy, incorporating ways, across numerous industries. The and intelligence. GIS digital mapping as an essential part smart city projects being undertaken GIS adds context to a building, while of the tools ecosystem, is now the standaround the globe all start from mapping understanding the surrounding geogra- ard for delivering cutting-edge construcexisting buildings, utilities and transport phy is crucial to connecting smart cities. tion projects. infrastructure, and in government pro- We can no longer build in isolation; we ■ esri.com


