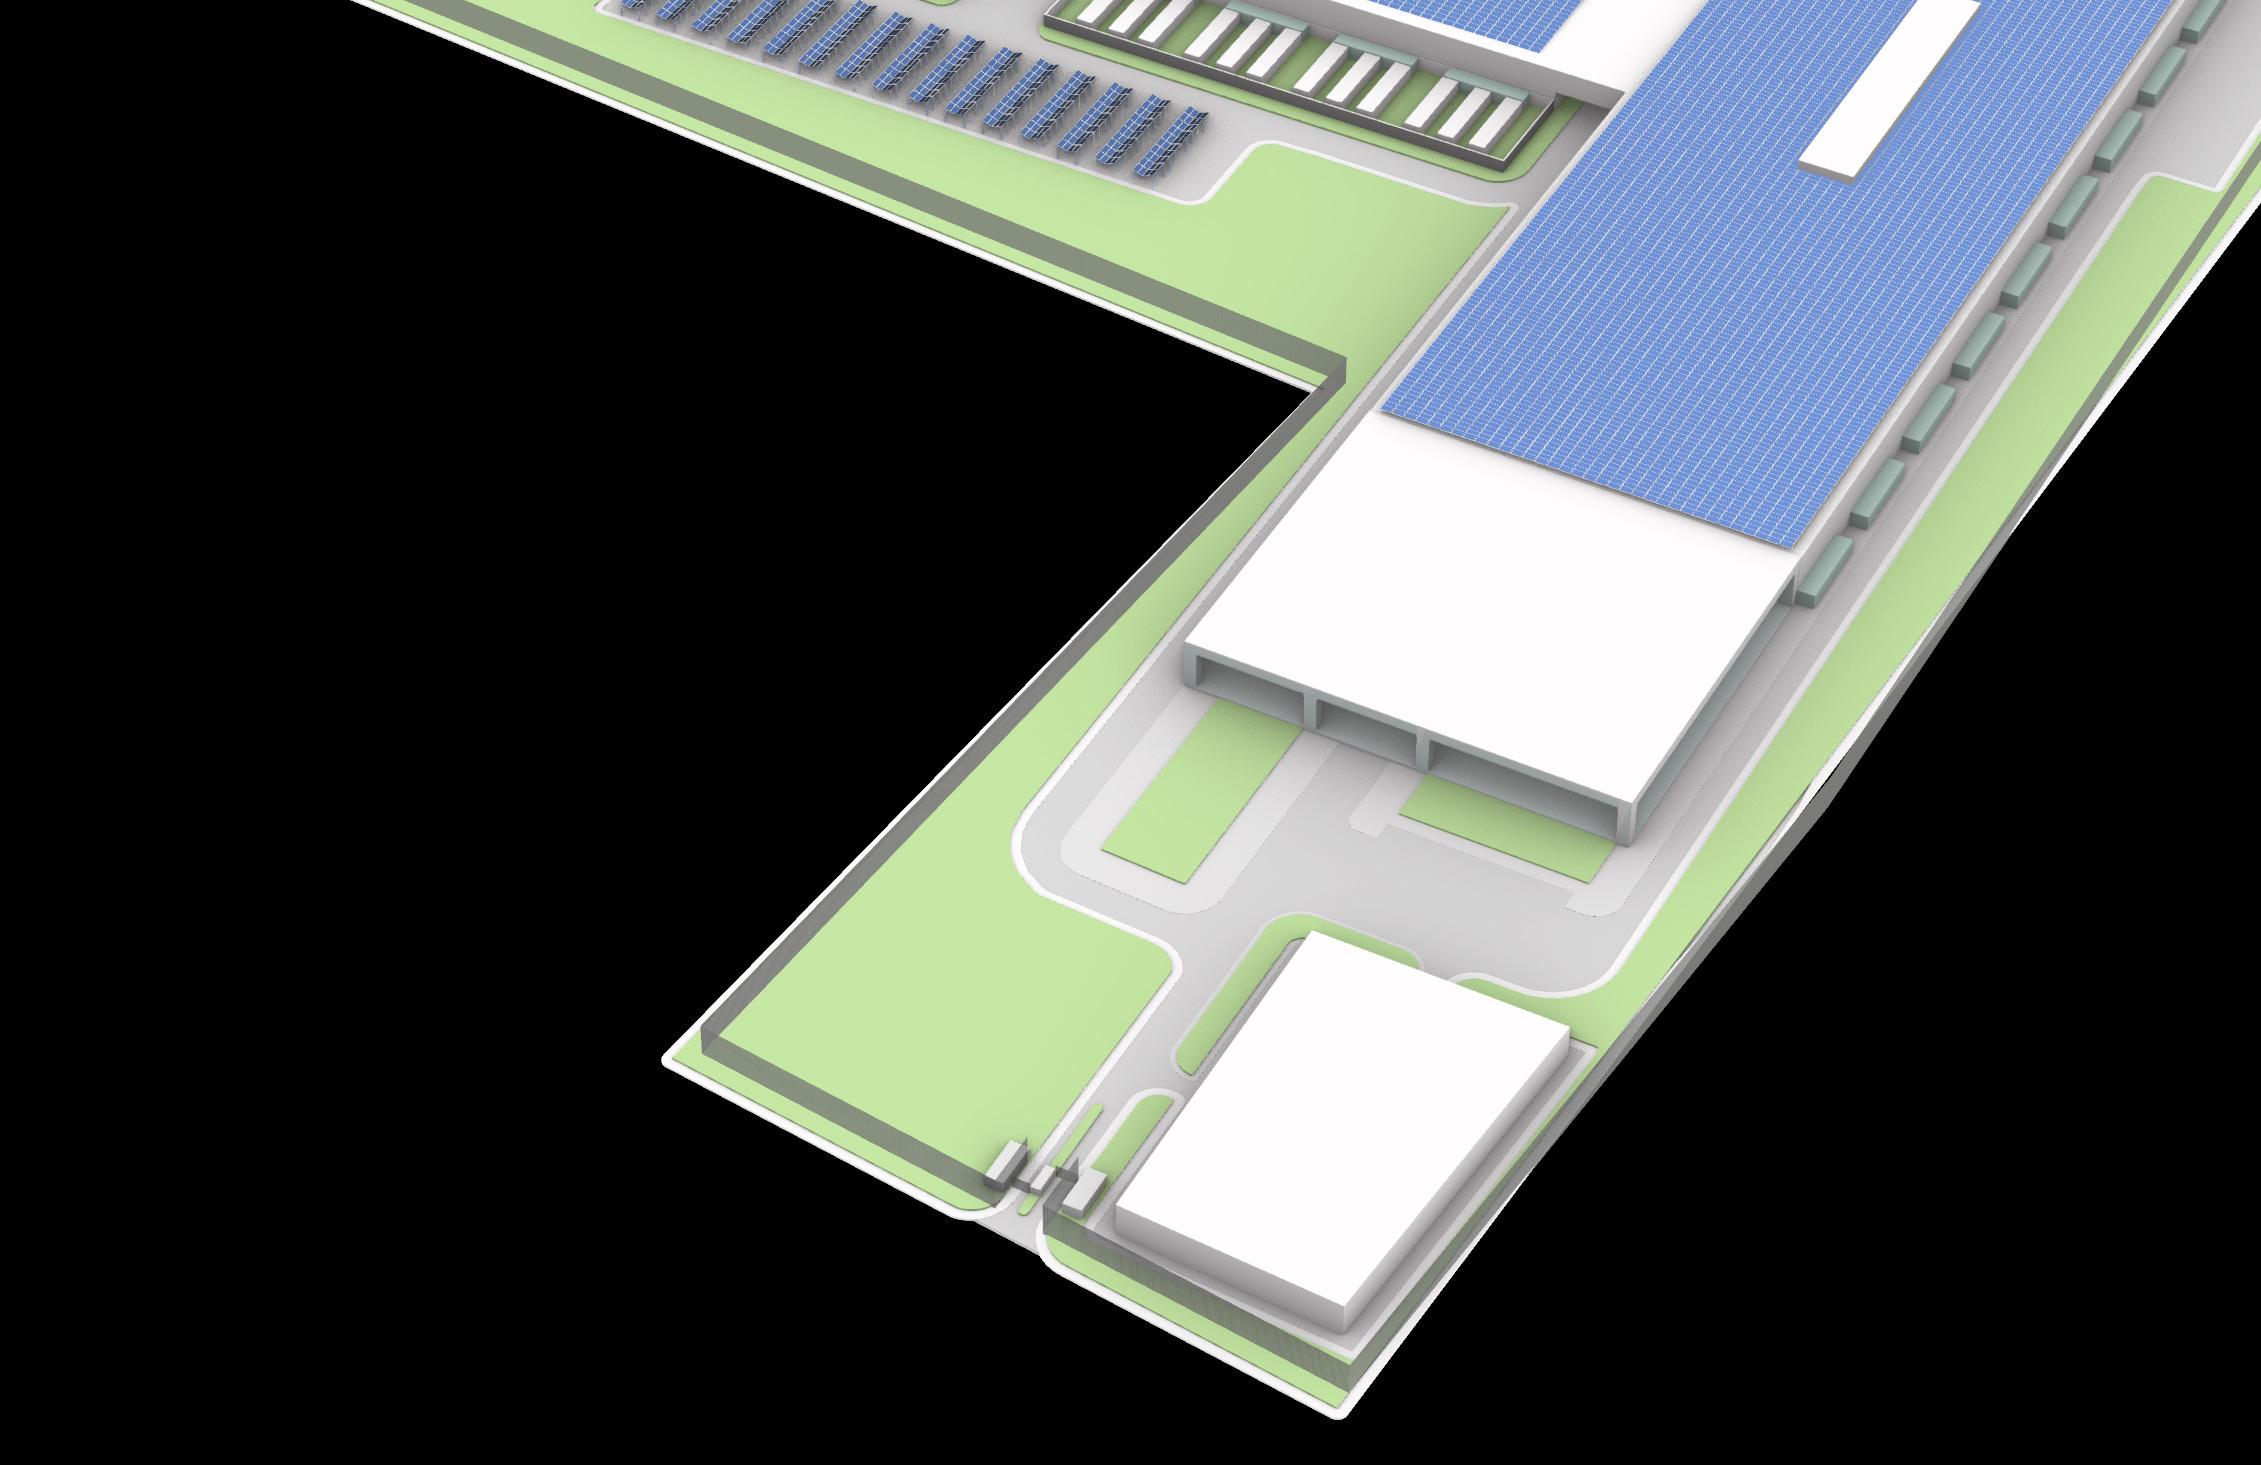
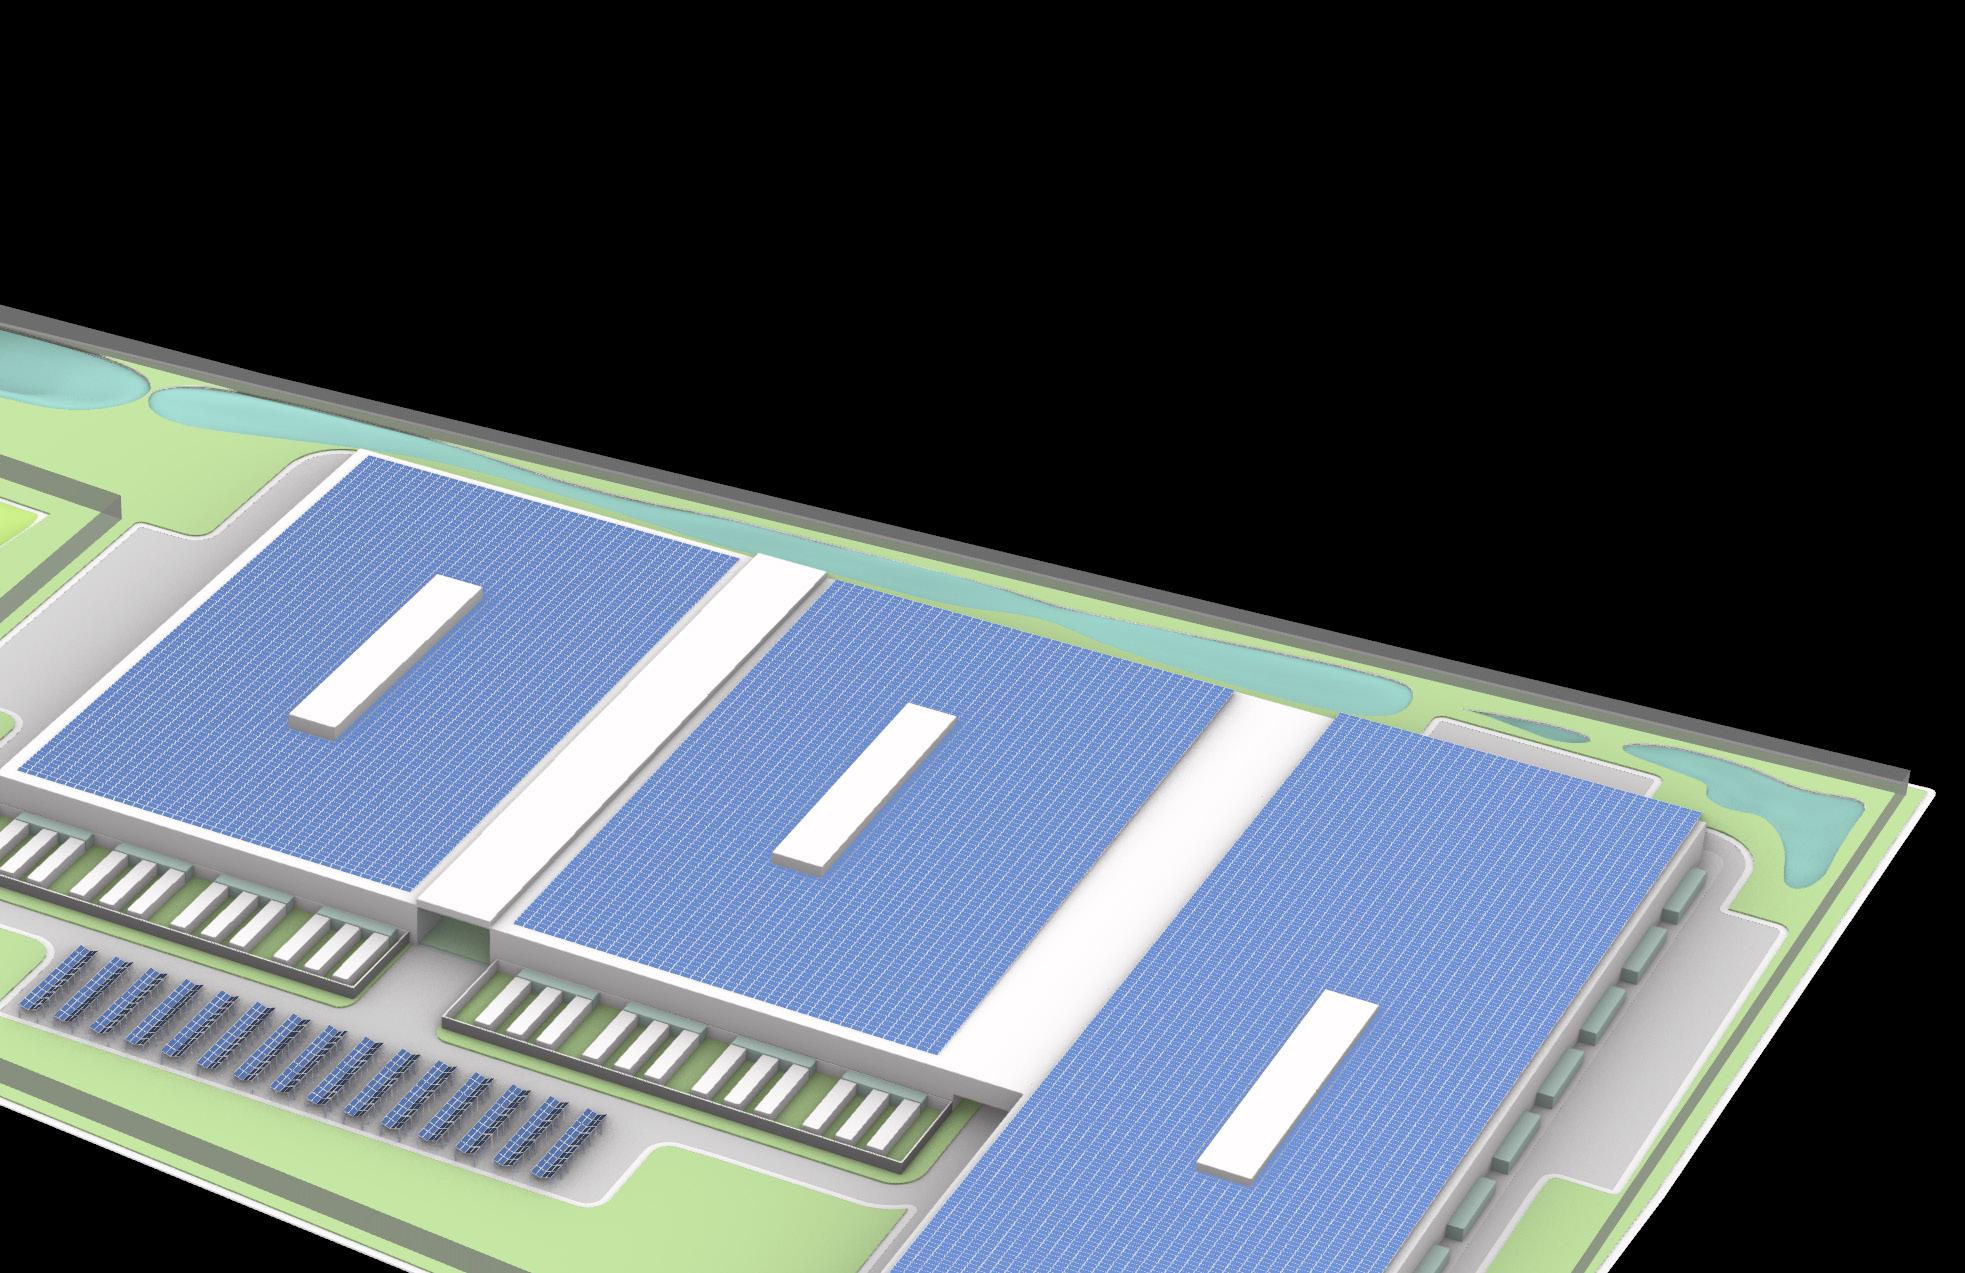
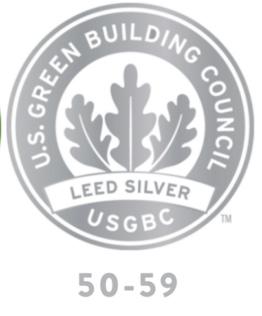
SITE MASTER PLAN
BIO SWALE/RETENTION POND
WETLAND PLANTING ZONE
PARKING
COMMUNITY PARK
PARK ENTRANCE
WHOLESALE UNIT ENTRANCE
SECURITY CHECKPOINT 2B
PARKING LOT WITH SOLAR SHADE +EV CHARGING
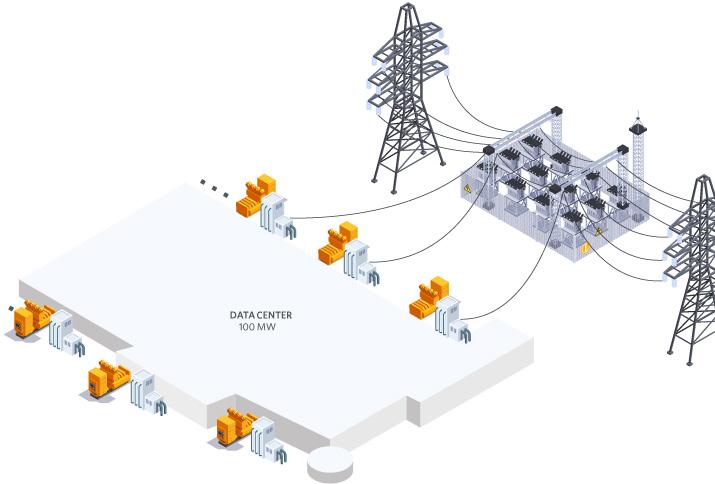
UPS
GENERATORS
RETAIL UNIT NETWORK ROOM
RETAIL UNIT DATA HALL SERVER


RETAIL UNIT OPERATION ROOM
COOLING SYSTEM + RAINWATER COLLECTION SECURITY FENCE + CCTV
RETAIL UNIT NETWORK ROOM
PARKING
RETAIL UNIT DATA HALL SERVER
RETAIL UNIT OPERATION ROOM
RETAIL UNIT ENTRANCE SECURITY CHECKPOINT 2A
PARKING
SUBSTATION
MAIN DATA
CENTER ENTRANCE
SECURITY CHECKPOINT 1
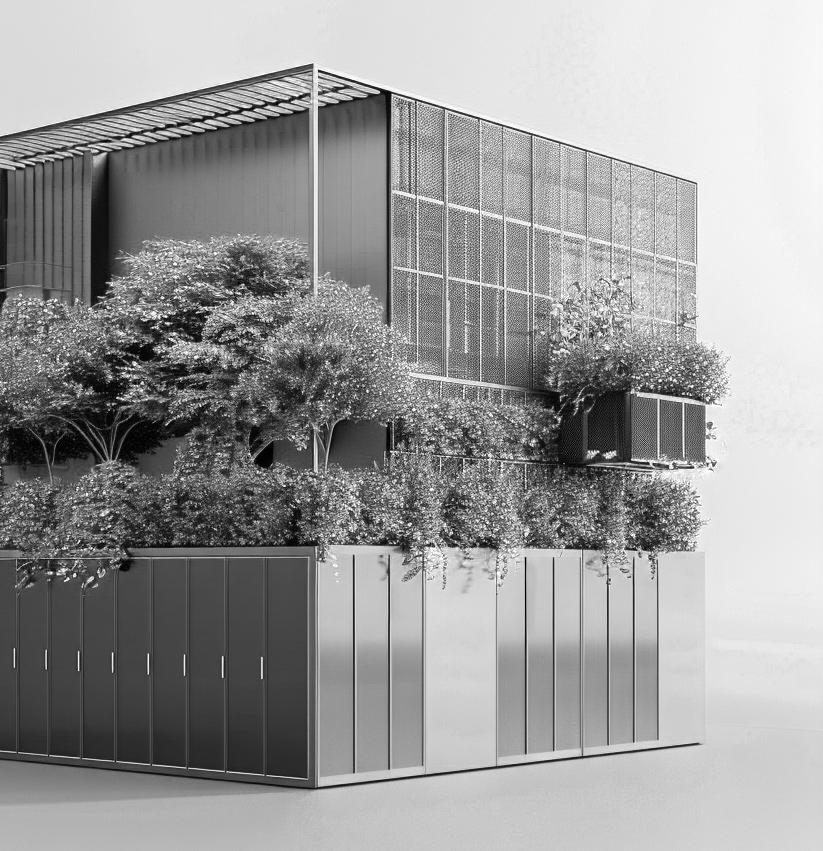
EcoLogic N


SOLAR -PRODUCTION (KWH MONTHLY) $2922895.36 E-PRODUCTION (KWH ANNUALLY) 35074744.32 TEMPLE SOLAR ENERGY PRICE $0.11 MONTHLY EST INCOME $321,518.49 ANNUALLY EST INCOME $3,858,221.88
GENERAL MARKETING STRATEGIES

Professional Website
Key for credibility and service details.
Showcase success stories and testimonials.
Foster direct relationships with visitors.
Billboards
Effective for capturing commuter attention. Strategically placed for maximum exposure. Highlight key selling points and include contact info.
Broker Partnerships
Utilize broker networks for market reach. Benefit from established relationships. Target Dallas market for expansion.
Google Ads
Capitalize on search engine visibility. Target keywords related to services. Drive targeted traffic and generate leads.
Influencer Sponsorship
Partner with industry influencers. Gain access to engaged audiences. Enhance brand credibility and visibility.
EcoLogic
POTENTIAL WHOLESALE CLENTS


EcoLogic
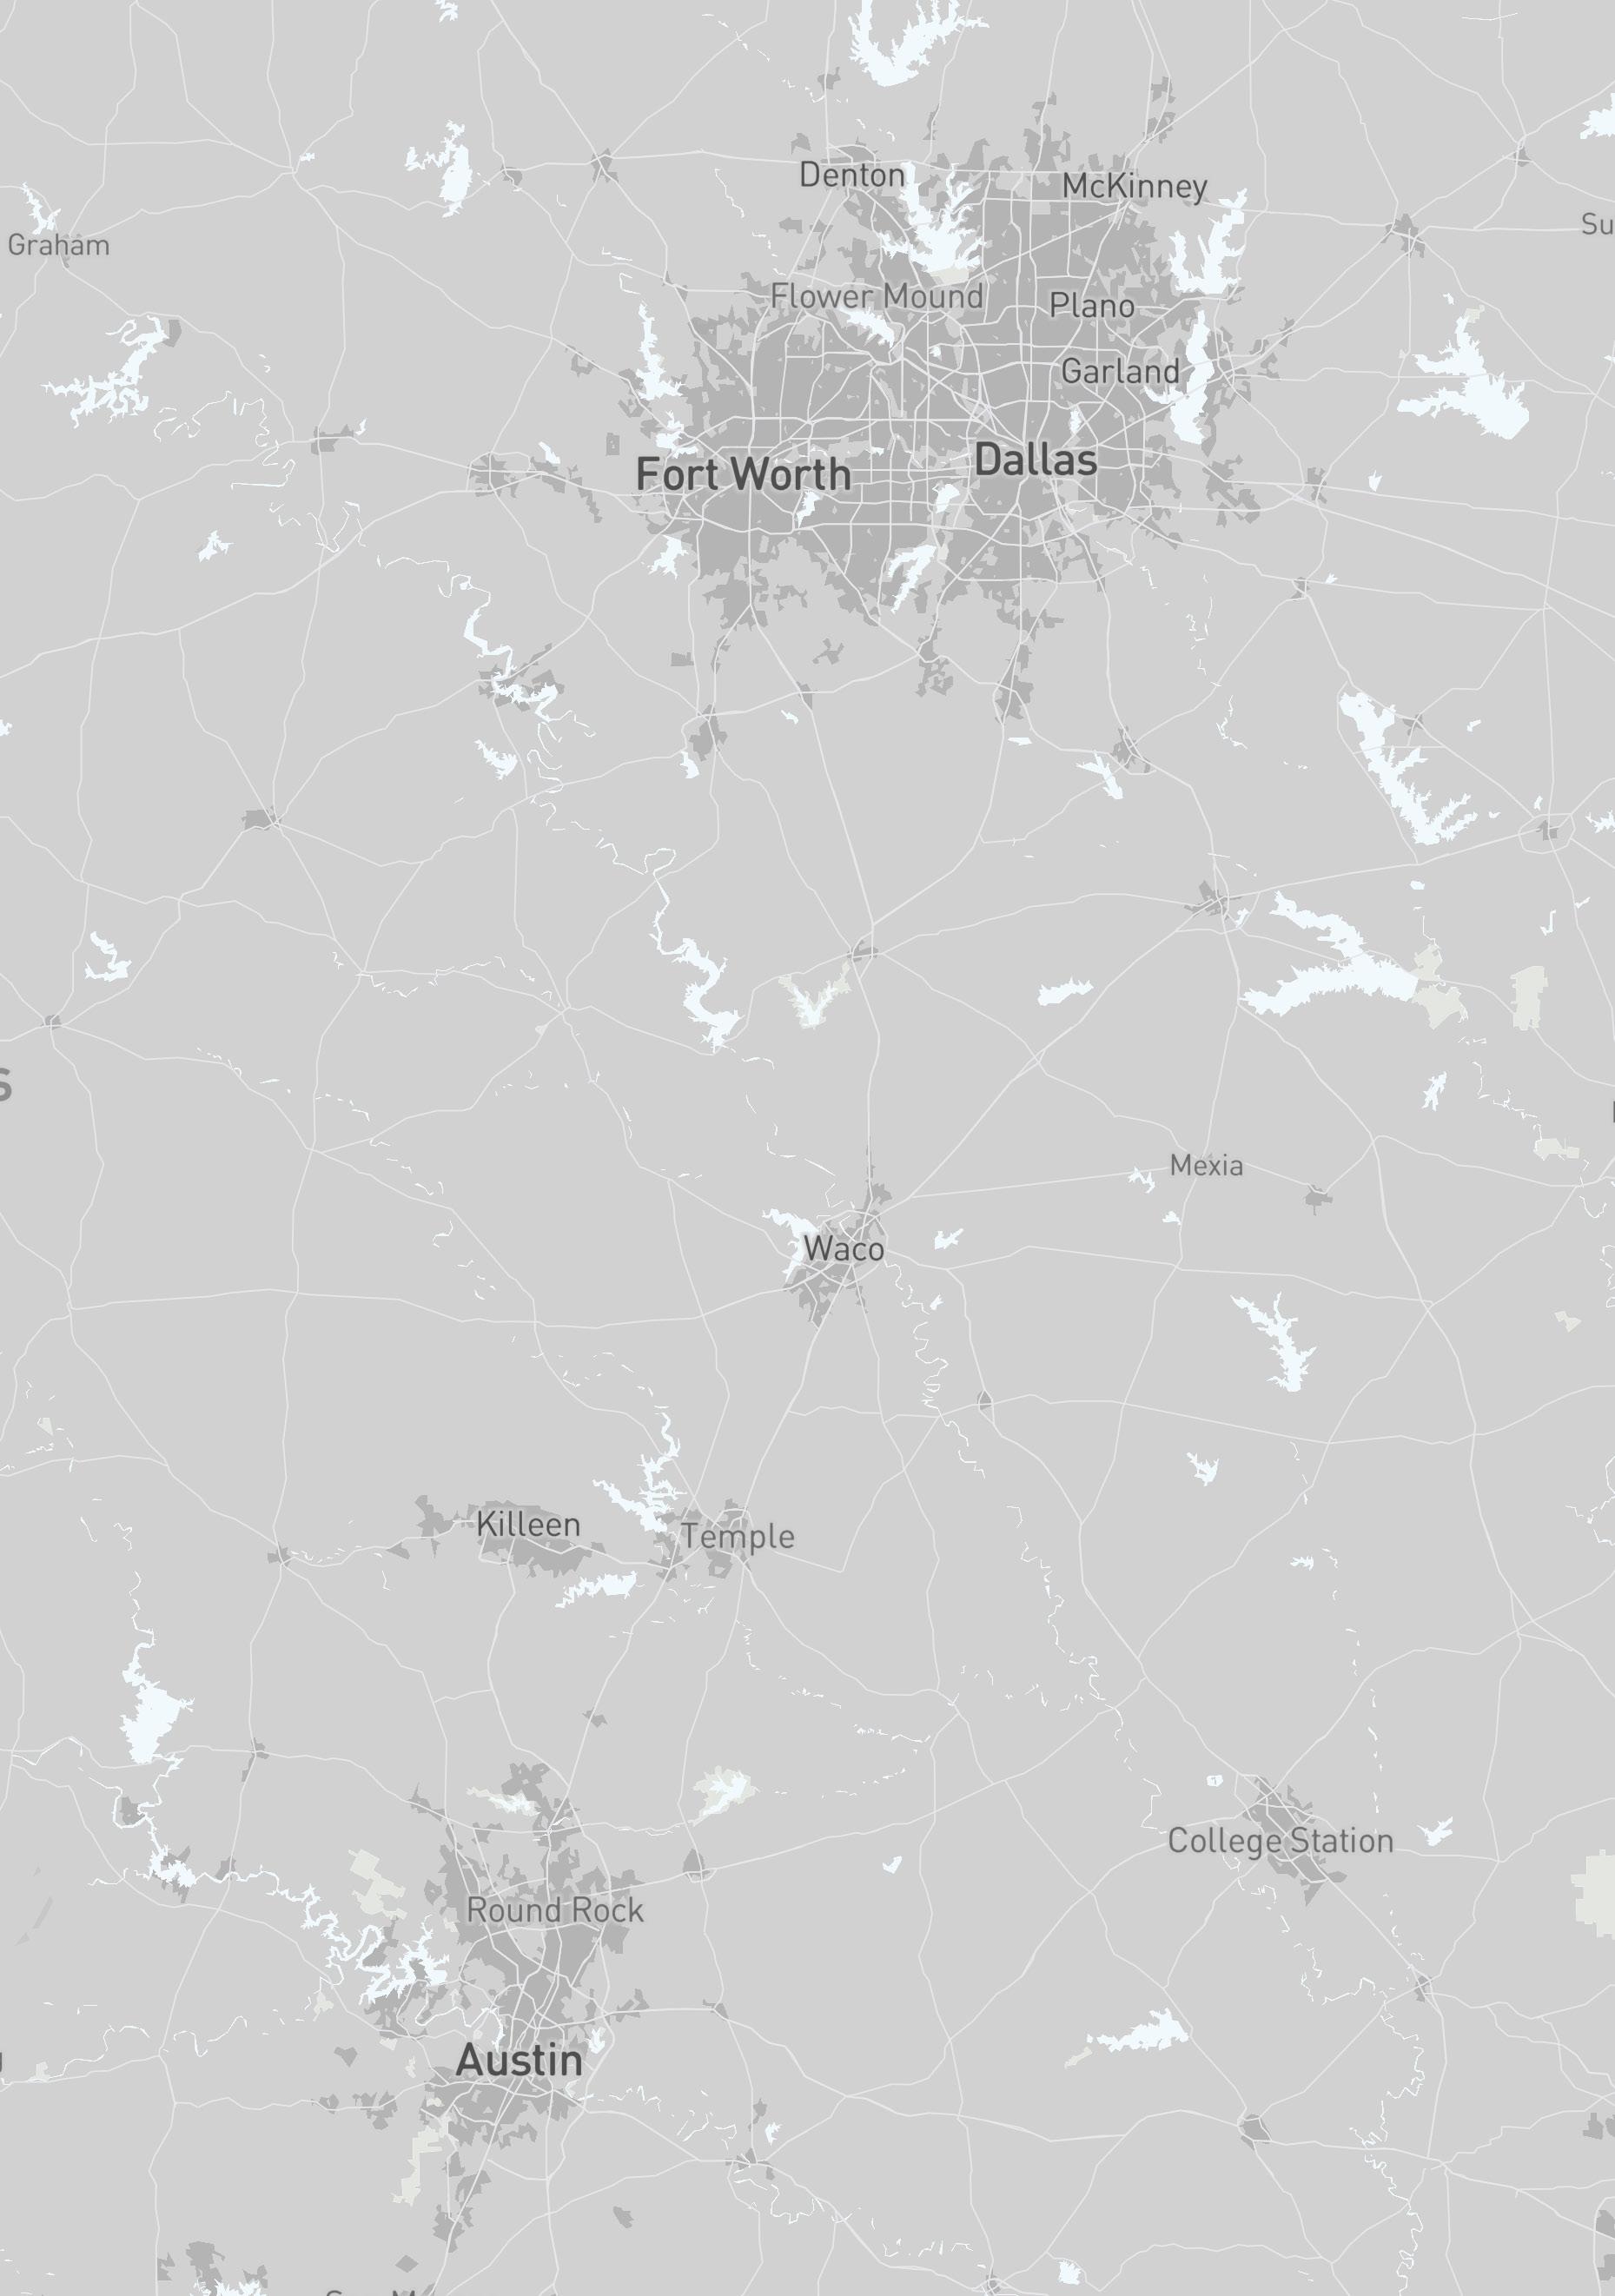
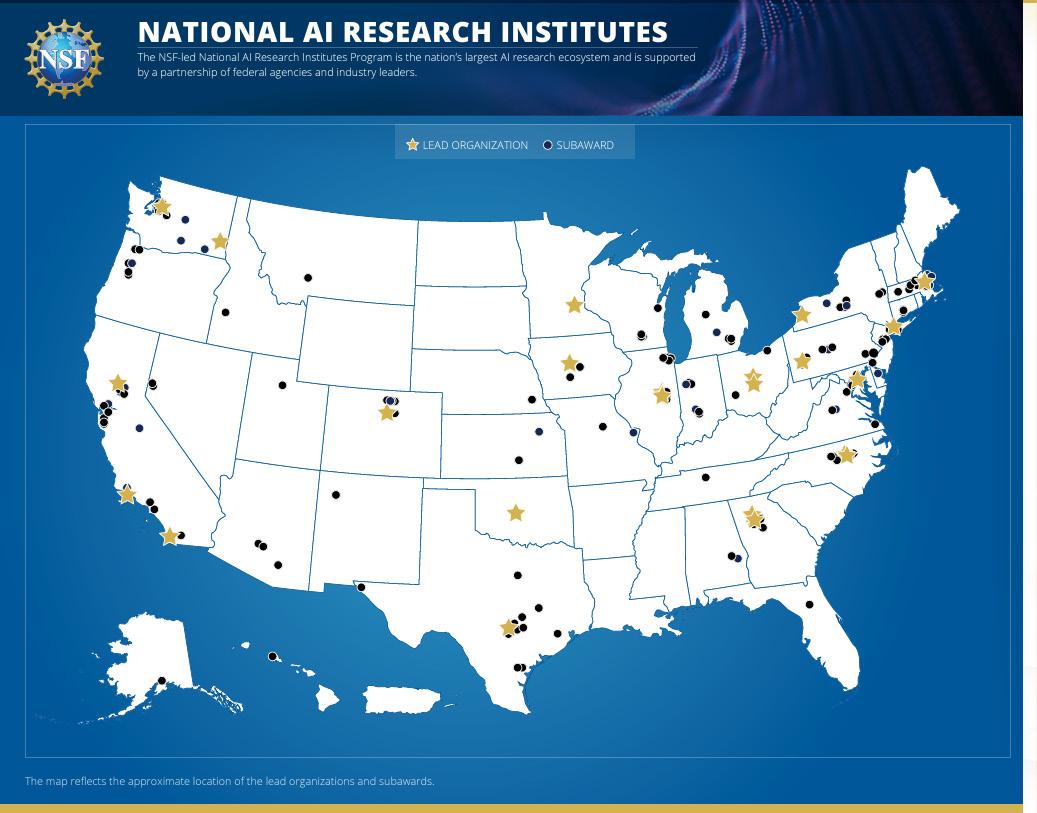
192 AI START-UP IN AUSTIN 87 AI START-UP IN DALLAS


TEXAS COASTAL OFFICES OF THE NATIONAL WEATHER SERVICE
TEXAS COMMISSION ON ENVIRONMENTAL QUALITY
TEXAS DEPARTMENT OF TRANSPORTATION
EcoLogic
POTENTIAL RETAIL CLENTS
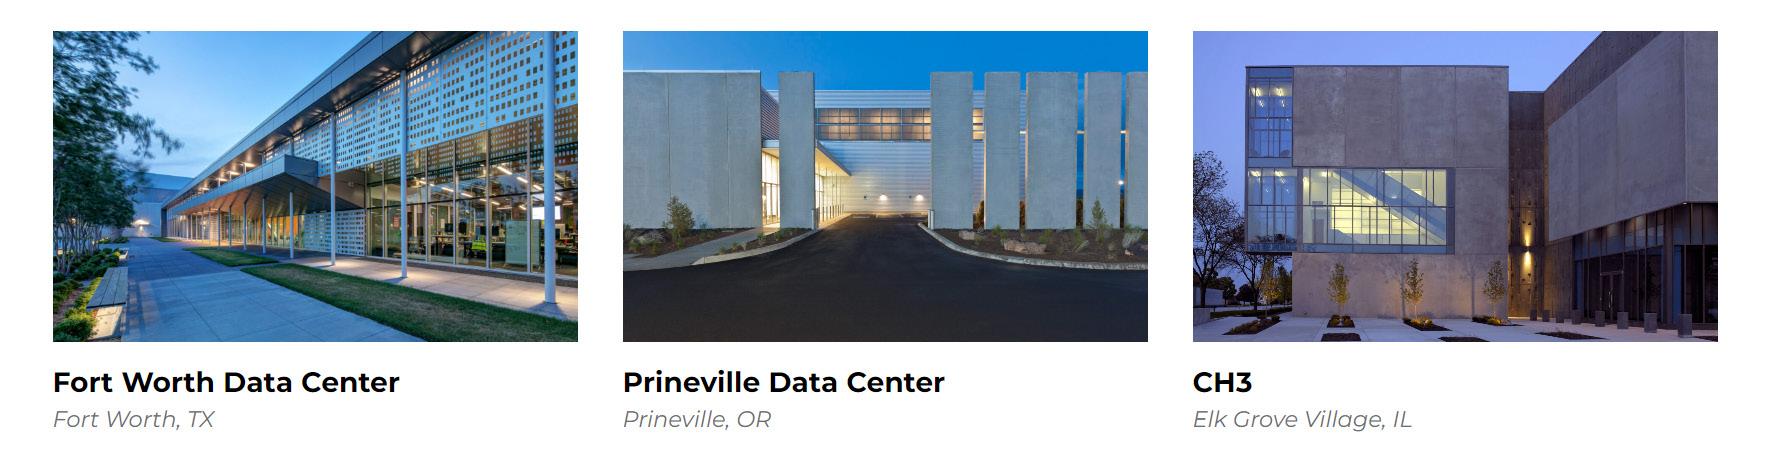
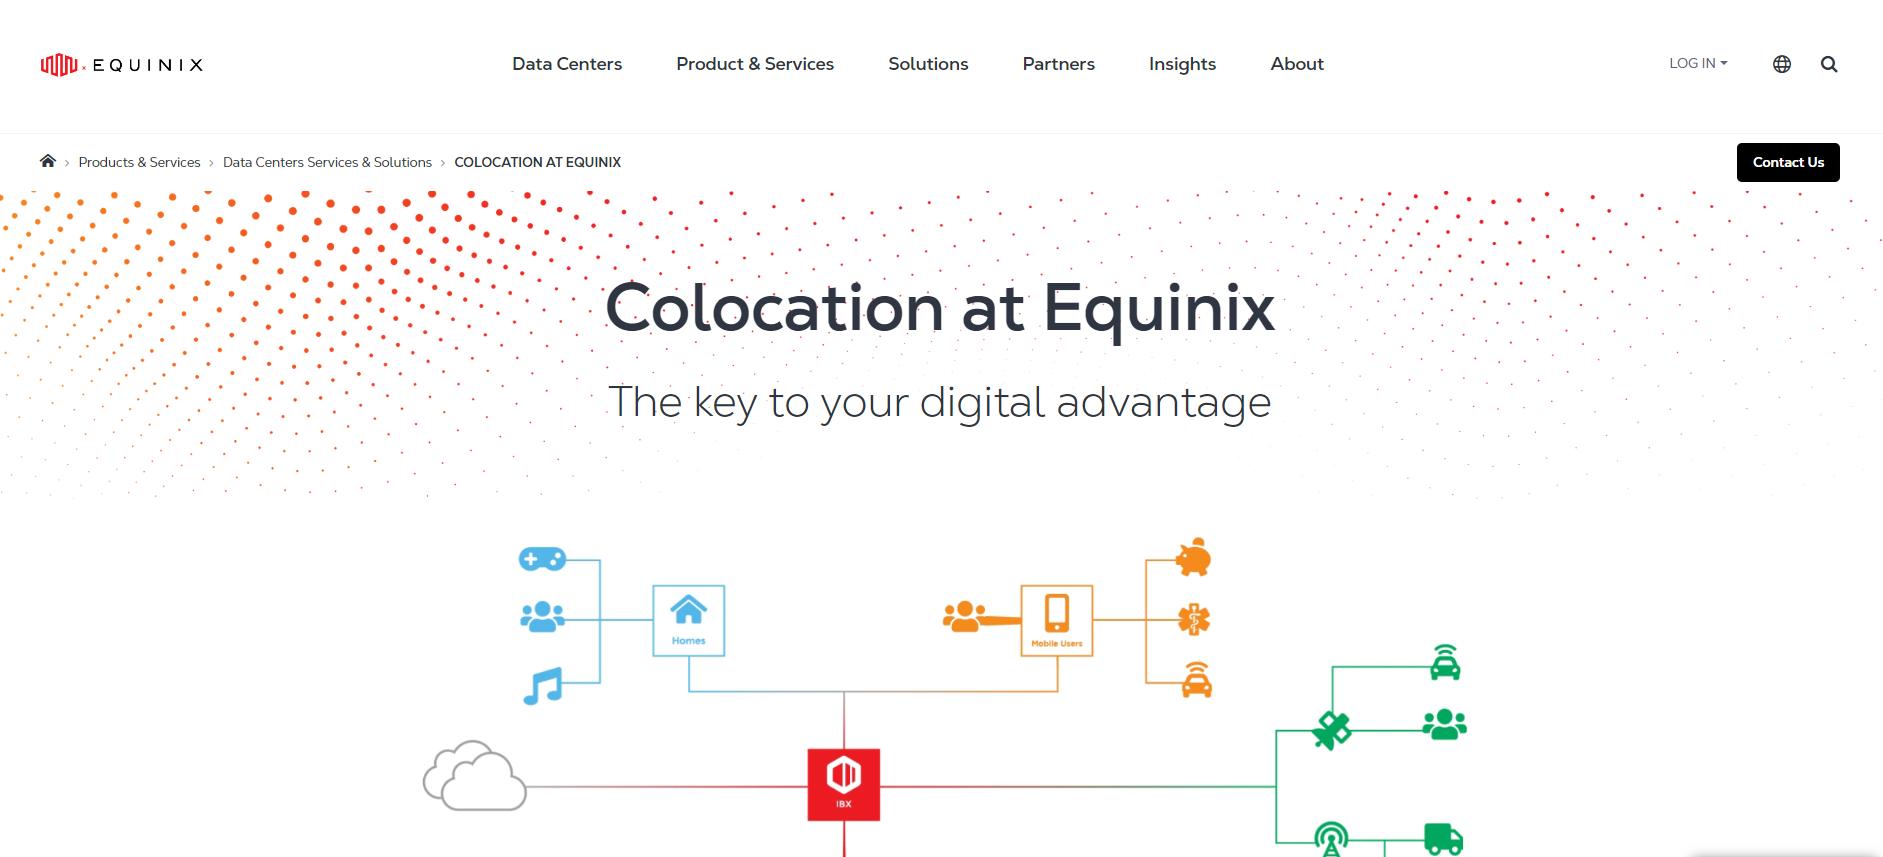
MARKET COMP


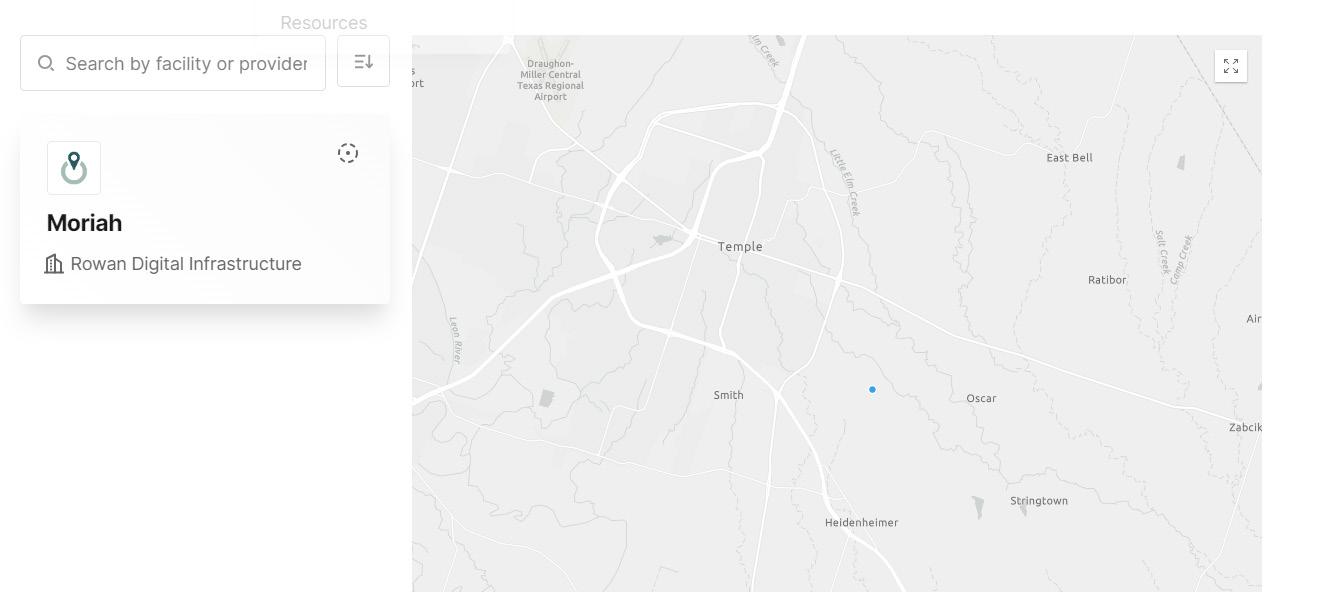
EcoLogic
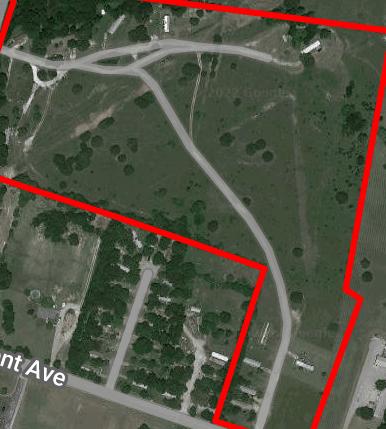
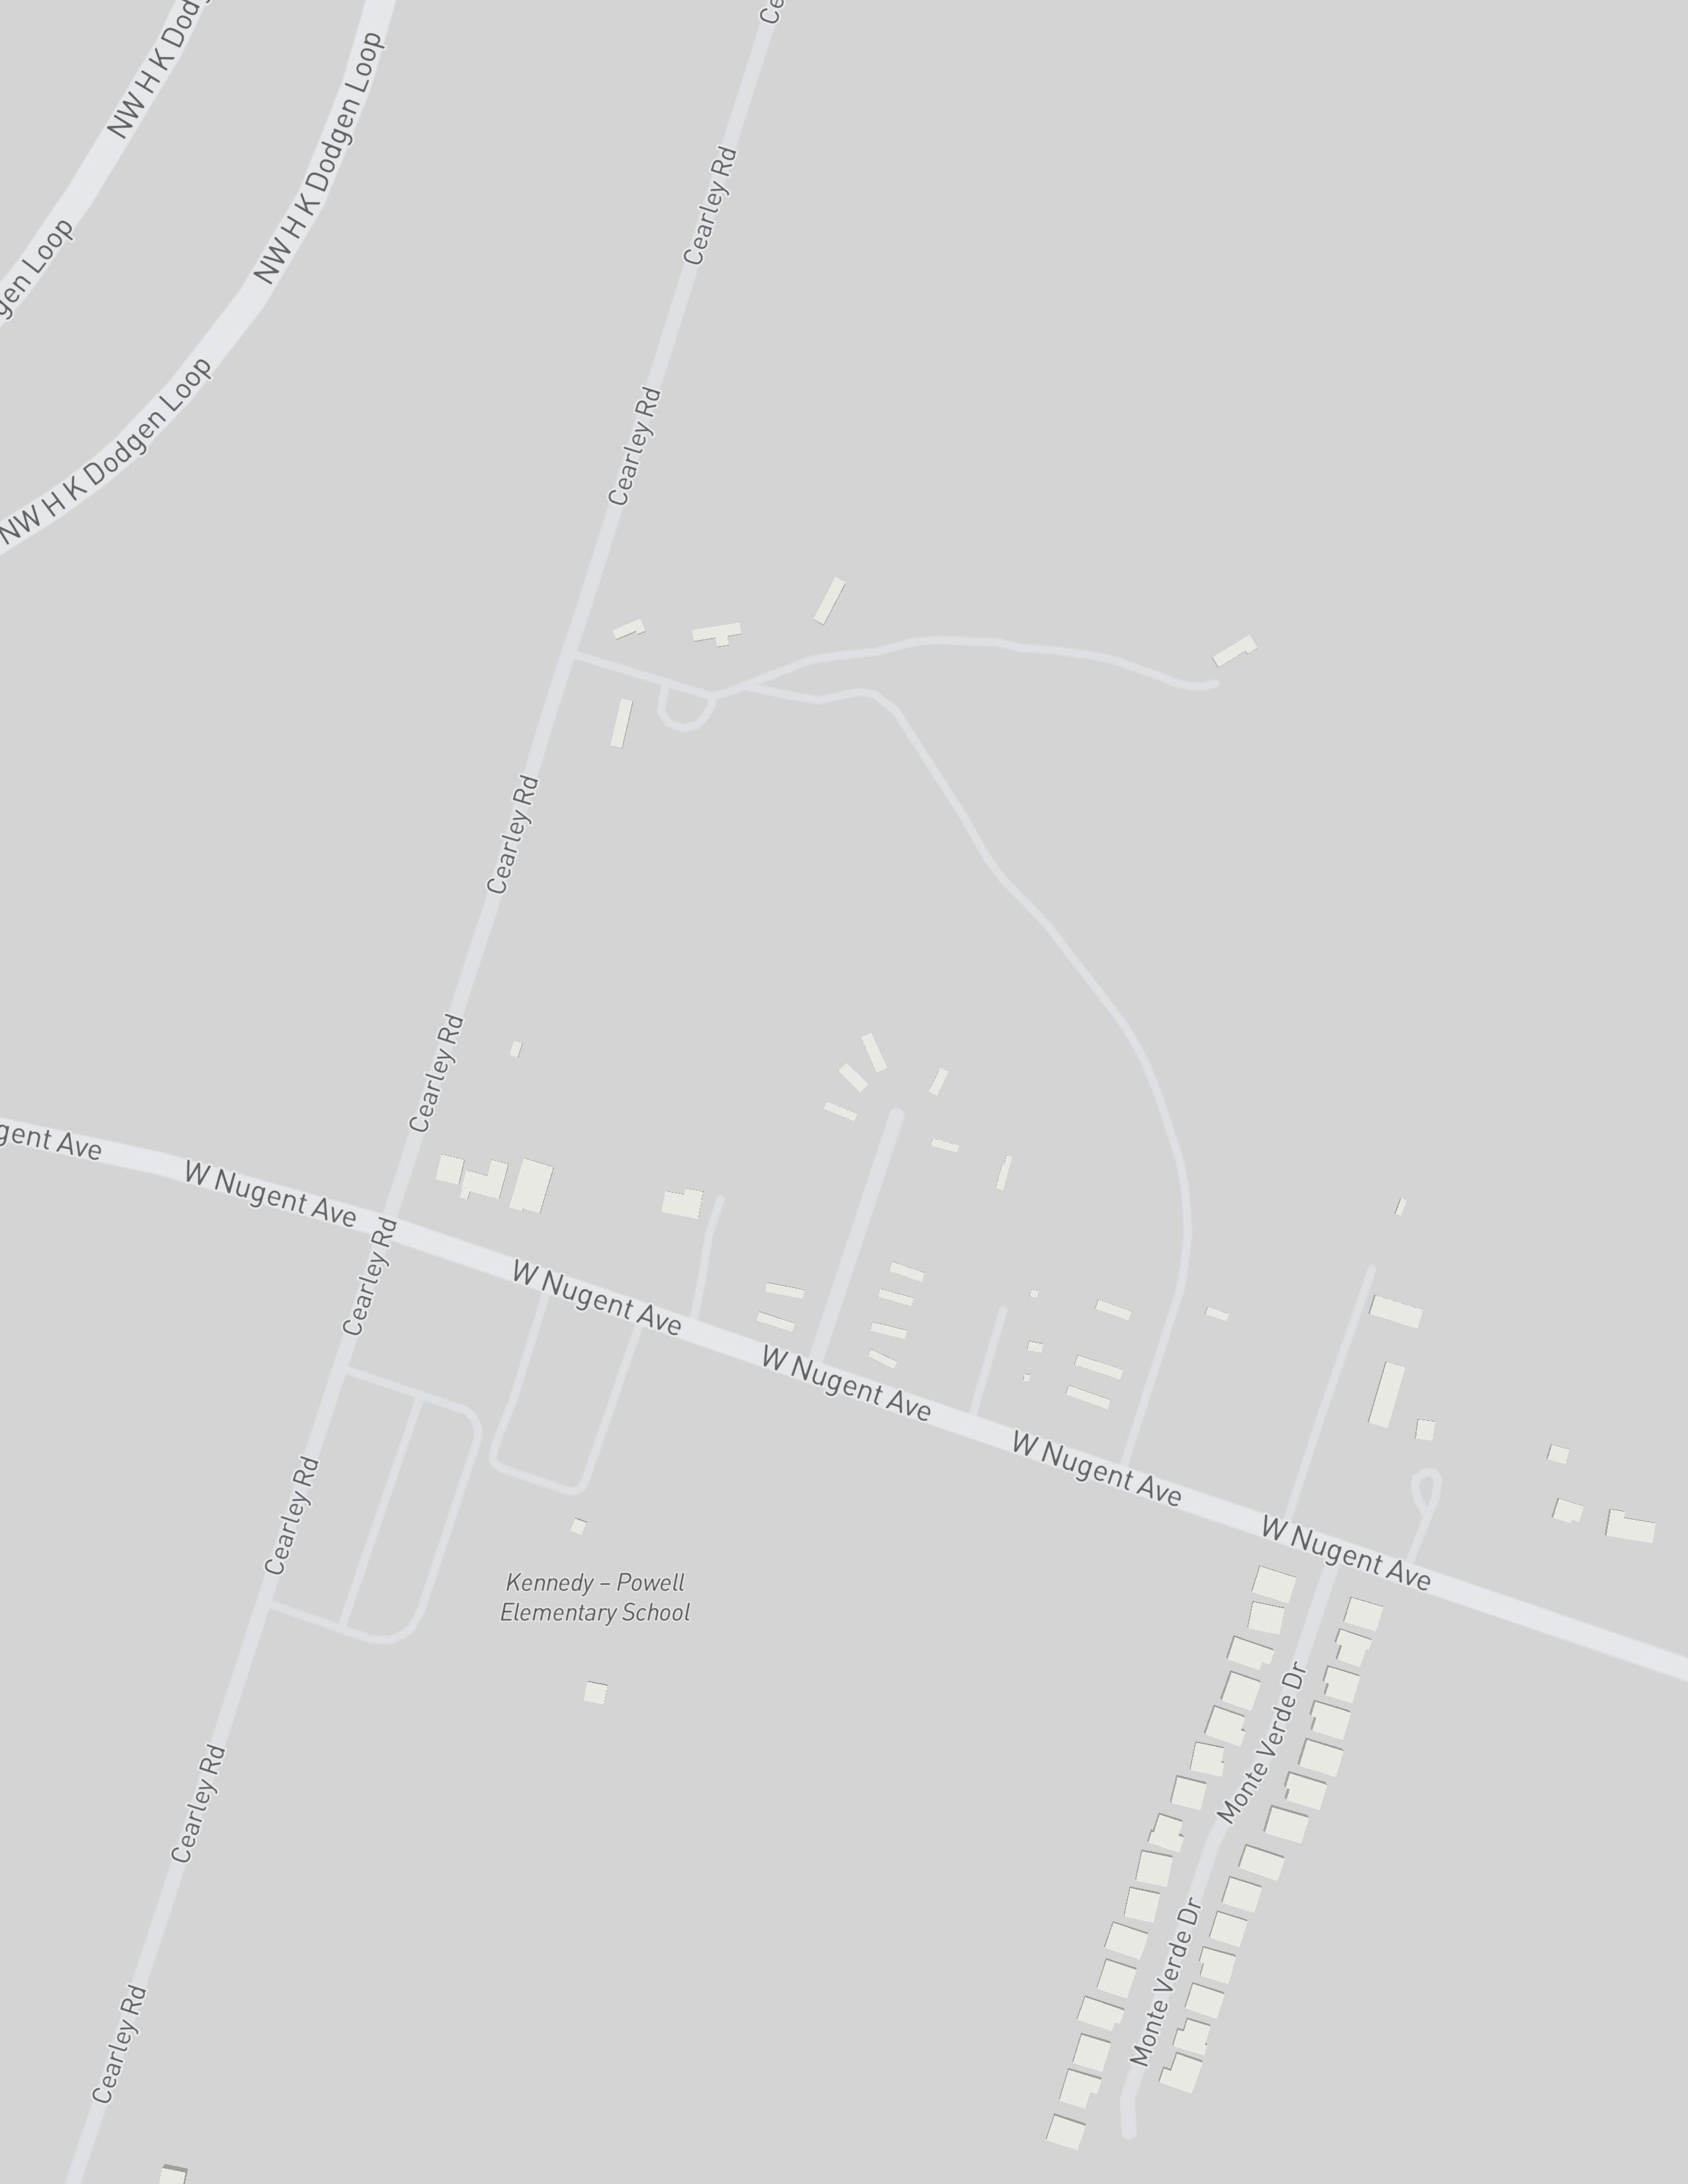
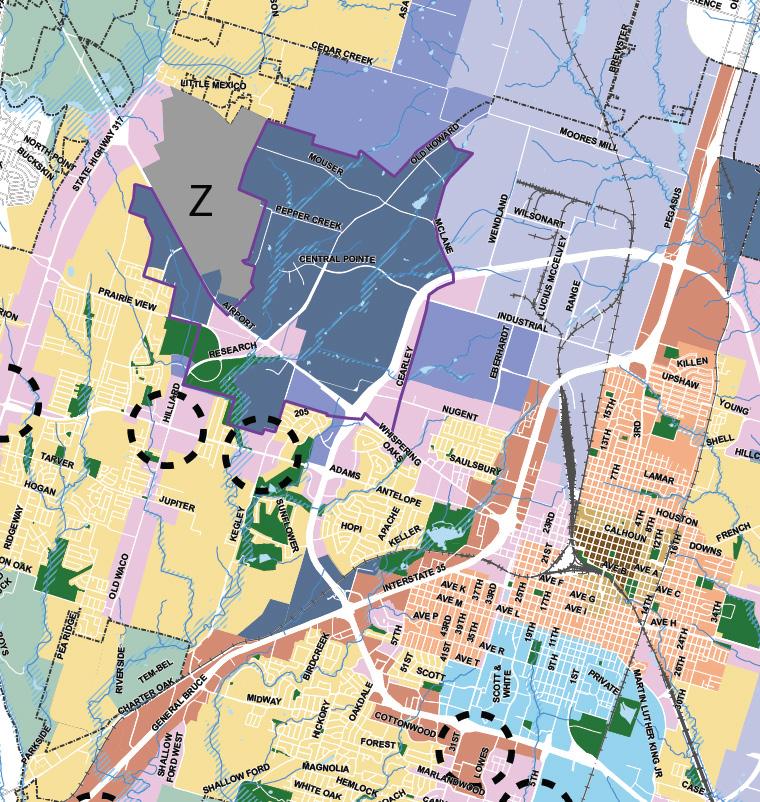
Site
EcoLogic Acquisition Cost PSF/% Total Cost Land Cost 3,523,394 $ Transfer Taxes 1% 35,233.94 $ Acquisition Fee 1% 35,233.94 $ Legal/Vehicle Expenses N/A 8,000 $ Other Acquisition Costs N/A - $ Total Acquisition Cost 3,601,862 $ Development Cost Hard Costs IT 496,402,021 $ Data Center Building 454,601,569 $ Onsite Energy Generation (Solar + Diesel ) 46,378,418 $ Site Work & Landscape 104,372,809 $ Hard Cost Contingency 7.5% 82,631,611 $ Total Hard Cost 1,184,386,428 $ Soft Cost Consultants (Arch+LA+EE) 12% 142,126,371 $ Construction Manager 15% 177,657,964 $ Feasibility studies and site Assessments/ Inspector 1% 11,843,864 $ Permits 1% 11,843,864 $ Insurance 5% 59,219,321 $ Green Building Certification Fee 1% 11,843,864 $ Financing Costs 7% 85,868,016 $ Legal Costs 5% 59,219,321 $ Miscellaneous Costs 3% 35,531,593 $ Soft Cost Contingency 5.0% 29,757,709 $ Total Soft Cost 624,911,889 $ Total Development + Acquisition Cost 1,812,900,179 $ Cost Reference Temple Commercial Factor 0.79 Data Center Unit Cost/SF Temple Price Architectural 237 187.23 $ Plumbing 12.95 10.23 $ Mechanical 33 26.07 $ Eletrical 31.5 24.89 $ Total 350 276.50 $ Event Beginning Duration Ending Year Closing 1/1/2024 0 Months 1/1/2024 0 Pre Constuction 1/1/2024 6 Months 7/31/2024 0 Construction 7/31/2024 16 Months 11/30/2025 1 Construction Misc (Certificate of 11/30/2025Occupancy) 2 Months 1/31/2026 2 Stablization 1/31/2026 24 Months 1/31/2028 4 Hold Period 1/31/2028 36 Months 1/31/2031 8 Exit 1/31/2031 0 Months 1/31/2031 8 Timing Assumptions
EcoLogic 0 1 2 3 4 5 6 7 8 2024 2025 2026 2027 2028 2029 2030 2031 2032 Investment Cash Flow TOTAL Land Acquisition Cost (3,601,861.88) $ (3,601,861.88) $ - $ Hard Cost (1,184,386,428.11) $ (197,397,738.02) $ (986,988,690.09) $ Soft Cost (624,911,889.13) $ (374,947,133.48) $ (249,964,755.65) $ Total Project Cost (1,812,900,179.12) $ (575,946,733.38) $ (1,236,953,445.74) $ Projected Revenue Wholesale Unit Rent - $ - $ 157,500,000.00 $ 162,225,000.00 $ 167,091,750.00 $ 172,104,502.50 $ 177,267,637.58 $ 182,585,666.70 $ 188,063,236.70 $ Retail Unit Rent - $ - $ 121,500,000.00 $ 125,145,000.00 $ 128,899,350.00 $ 132,766,330.50 $ 136,749,320.42 $ 140,851,800.03 $ 145,077,354.03 $ Solar Energy Reimbursement - $ - $ 35,074,744.32 $ 35,600,865.48 $ 36,134,878.47 $ 36,676,901.64 $ 37,227,055.17 $ 37,785,461.00 $ 38,352,242.91 $ Projected Gross Income(PGI) - $ - $ 314,074,744.32 $ 322,970,865.48 $ 332,125,978.47 $ 341,547,734.64 $ 351,244,013.16 $ 361,222,927.73 $ 371,492,833.64 $ Vacancy - $ - $ 4% 4% 4% 4% 4% 5% 5% Revenue loss - $ - $ (11,160,000.00) $ (11,494,800.00) $ (11,839,644.00) $ (12,194,833.32) $ (12,560,678.32) $ (16,171,873.34) $ (16,657,029.54) $ Total EGI - $ - $ 302,914,744.32 $ 311,476,065.48 $ 320,286,334.47 $ 329,352,901.32 $ 338,683,334.84 $ 345,051,054.39 $ 354,835,804.11 $ Projected Expense Management Expense - $ - $ (2,630,605.82) $ (2,656,911.88) $ (2,683,481.00) $ (2,710,315.81) $ (2,737,418.97) $ (2,764,793.16) $ (2,792,441.09) $ Ordinary Maintenance and Repairs - $ - $ (300,000.00) $ (303,000.00) $ (306,030.00) $ (309,090.30) $ (312,181.20) $ (315,303.02) $ (318,456.05) $ Common Area Maintenance - $ - $ (300,000.00) $ (303,000.00) $ (306,030.00) $ (309,090.30) $ (312,181.20) $ (315,303.02) $ (318,456.05) $ Common Area Util./Heat - $ - $ (670,000.00) $ (676,700.00) $ (683,467.00) $ (690,301.67) $ (697,204.69) $ (704,176.73) $ (711,218.50) $ Marketing & ADS - $ - $ (670,000.00) $ (676,700.00) $ (683,467.00) $ (690,301.67) $ (697,204.69) $ (704,176.73) $ (711,218.50) $ Misc/Legal - $ - $ (580,000.00) $ (585,800.00) $ (591,658.00) $ (597,574.58) $ (603,550.33) $ (609,585.83) $ (615,681.69) $ Insurance(Cyber) - $ - $ (860,000.00) $ (868,600.00) $ (877,286.00) $ (886,058.86) $ (894,919.45) $ (903,868.64) $ (912,907.33) $ Additional Real Estate Tax (Wholesale Tenant Pay 2/3) - $ - $ (300,000.00) $ (303,000.00) $ (306,030.00) $ (309,090.30) $ (312,181.20) $ (315,303.02) $ (318,456.05) $ Landscaping - $ - $ (528,469.92) $ (533,754.62) $ (539,092.17) $ (544,483.09) $ (549,927.92) $ (555,427.20) $ (560,981.47) $ Reserve - $ - $ (1,000,000.00) $ (1,010,000.00) $ (1,020,100.00) $ (1,030,301.00) $ (1,040,604.01) $ (1,051,010.05) $ (1,061,520.15) $ Projected Expenses - $ - $ (7,839,075.74) $ (7,917,466.50) $ (7,996,641.17) $ (8,076,607.58) $ (8,157,373.65) $ (8,238,947.39) $ (8,321,336.86) $ NOI (575,946,733.38) $ (1,236,953,445.74) $ 310,753,820.06 $ 319,393,531.99 $ 328,282,975.63 $ 337,429,508.90 $ 346,840,708.49 $ 353,290,001.78 $ 363,157,140.97 $ Capital Expenditures ITImprovement (49,640,202.11) $ (49,640,202.11) $ (49,640,202.11) $ Common Area Improvements (1,000,000.00) $ (1,000,000.00) $ Cash Flow before Debt Service - $ (575,946,733.38) $ (1,236,953,445.74) $ 310,753,820.06 $ 269,753,329.88 $ 327,282,975.63 $ 287,789,306.79 $ 346,840,708.49 $ 302,649,799.67 $ 363,157,140.97 $ Disposition - $ - $ - $ - $ - $ - $ - $ - $ 5,283,982,810.49 $ Cost of sale - $ - $ - $ - $ - $ - $ - $ - $ (369,878,796.73) $ Net Disposition - $ - $ - $ - $ - $ - $ - $ - $ 4,914,104,013.75 $ Unlevered Cash Flow (575,946,733.38) $ (1,236,953,445.74) $ 310,753,820.06 $ 269,753,329.88 $ 327,282,975.63 $ 287,789,306.79 $ 346,840,708.49 $ 302,649,799.67 $ 5,277,261,154.72 $ Unlevered IRR 25.57% EM 3.93 Levered Return Acquisition Cost (3,601,861.88) $ - $ - $ - $ - $ - $ - $ - $ - $ Development Costs (572,344,871.50) $ (1,236,953,445.74) $ - $ - $ - $ - $ - $ - $ - $ Financing Construction Loan Proceeds Drawn 522,316,233.93 $ 723,719,326.90 $ - $ - $ - $ - $ - $ - $ - $ Construction Loan Interest & Fees (31,286,742.41) $ (74,582,364.72) $ - $ - $ - $ - $ - $ - $ - $ Construction Loan Repayment - $ (1,350,983,710.09) $ - $ - $ - $ - $ - $ - $ Permanent Loan Proceeds Drawn - $ 3,955,048,619.00 $ - $ - $ - $ - $ - $ - $ - $ Permanent Loan Interest & Fees - $ - $ (156,934,237.47) $ (154,096,595.23) $ (151,143,343.07) $ (148,069,770.86) $ (144,870,976.58) $ (141,541,858.48) $ (138,077,106.98) $ Permanent Loan Principal - $ - $ (69,649,847.13) $ (72,487,489.37) $ (75,440,741.53) $ (78,514,313.74) $ (81,713,108.02) $ (85,042,226.12) $ (88,506,977.62) $ Permanent Loan Repayment - $ - $ - $ - $ - $ - $ - $ - $ (4,506,403,322.53) $ Total Financing (84,188,913.23) $ 2,099,374,260.77 $ (226,584,084.60) $ (226,584,084.60) $ (226,584,084.60) $ (226,584,084.60) $ (226,584,084.60) $ (226,584,084.60) $ (4,732,987,407.13) $ NOI (575,946,733.38) $ (1,236,953,445.74) $ 310,753,820.06 $ 319,393,531.99 $ 328,282,975.63 $ 337,429,508.90 $ 346,840,708.49 $ 353,290,001.78 $ 363,157,140.97 $ Net Exceed Proceeds - $ - $ - $ - $ - $ - $ - $ - $ 4,914,104,013.75 $ Levered cf (659,407,317.98) $ 863,994,881.04 $ 84,169,735.46 $ 92,809,447.38 $ 101,698,891.03 $ 110,845,424.30 $ 120,256,623.89 $ 126,705,917.18 $ 544,273,747.59 $ IRR 58.24% EM 3.14 Sources & Uses (Unlevered) Uses Amount $/SF Acquisition Cost 3,601,862 $ $3 Construction (Hard Costs) 1,184,386,428 $ 720.37 $ Soft Costs 624,911,889 $ 380.09 $ Total Uses (Total Development Costs) 1,812,900,179 $ 503.32 $ Sources % Equity 1,812,900,179 $ 100% Debt - $ 0% Total Sources 1,812,900,179 $ Sources & Uses (Levered) Uses Amount $/SF Acquisition Cost 3,601,862 $ 2.19 $ Construction Cost (Hard Costs) 1,184,386,428 $ 720.37 $ Soft Costs 624,911,889 $ 380.09 $ Debt Origination Fee 13,509,837 $ 8.22 $ Interest Reserves 105,869,107 $ 64.39 $ Total Uses 1,929,976,729 $ 1,173.86 $ Sources % Equity 578,993,018.61 $ 30% Debt 1,350,983,710.09 $ 70% Total Sources 1,929,976,728.71 $ 100% Unlevered Cash Flow Unlevered IRR 25.57% EM 3.93 Levered cf IRR 58.24% EM 3.14
THANK YOU
EcoLogic