4 minute read
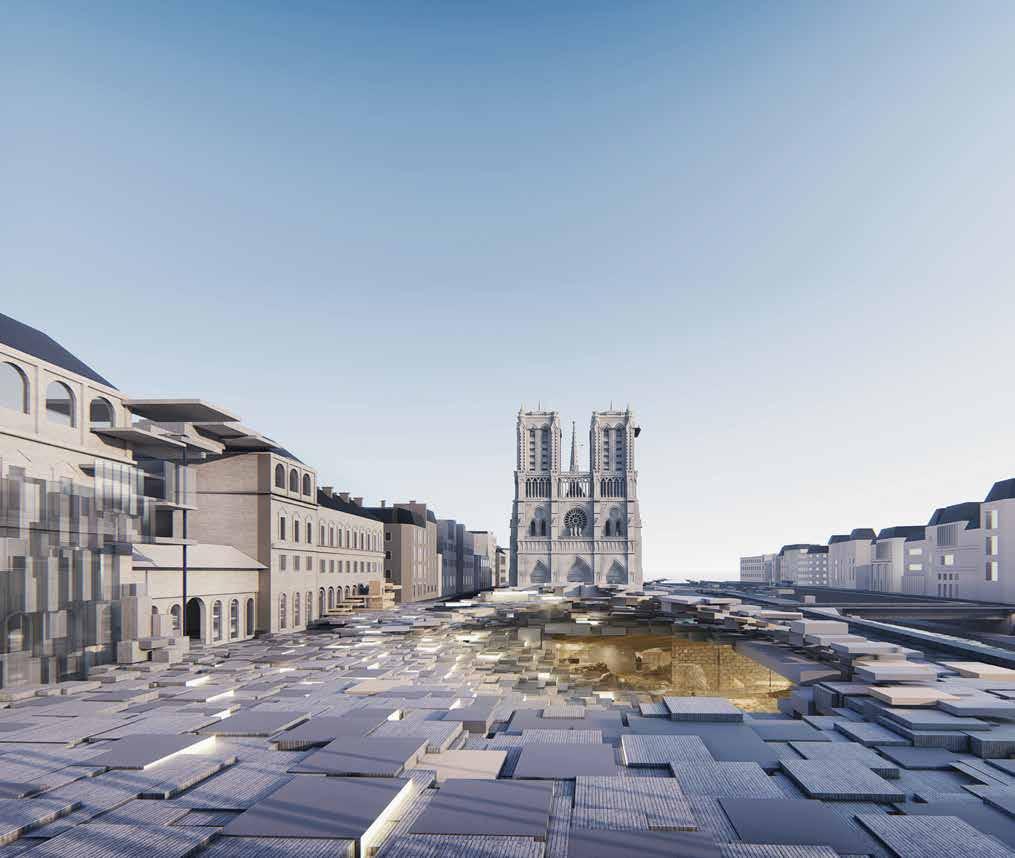
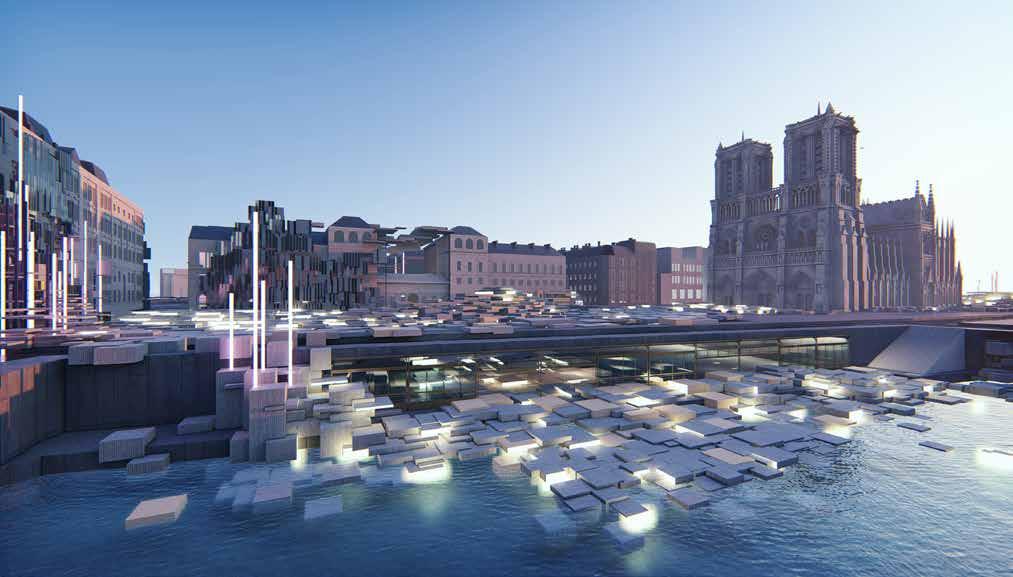
Visual Dislocation, Big Data Urbanism

VISUAL DISLOCATION
Advertisement
Team Member: Wang Xi, Piyush Prajapati, Wei Lingzhao, Wu Han
Phase 1
This section brings in the understanding and deepens the theoretical knowledge of Visual Perception. Its relationship to Visual Dislocation, Past, Present and Future of the same.
Phase 2
This section deals with the researchexploration at the Macro and the Micro level of the City. Conclusively finding the site for the design Intervention.
Phase 3
At this step, we explore the tools for understanding the visual perception, its implementation, adaptation, illustrating the visual importance. The aim here is to understand the visual perception and dislocation through various methodologies, which thereby leads to a deeper understanding of visual cognition.
Phase 4
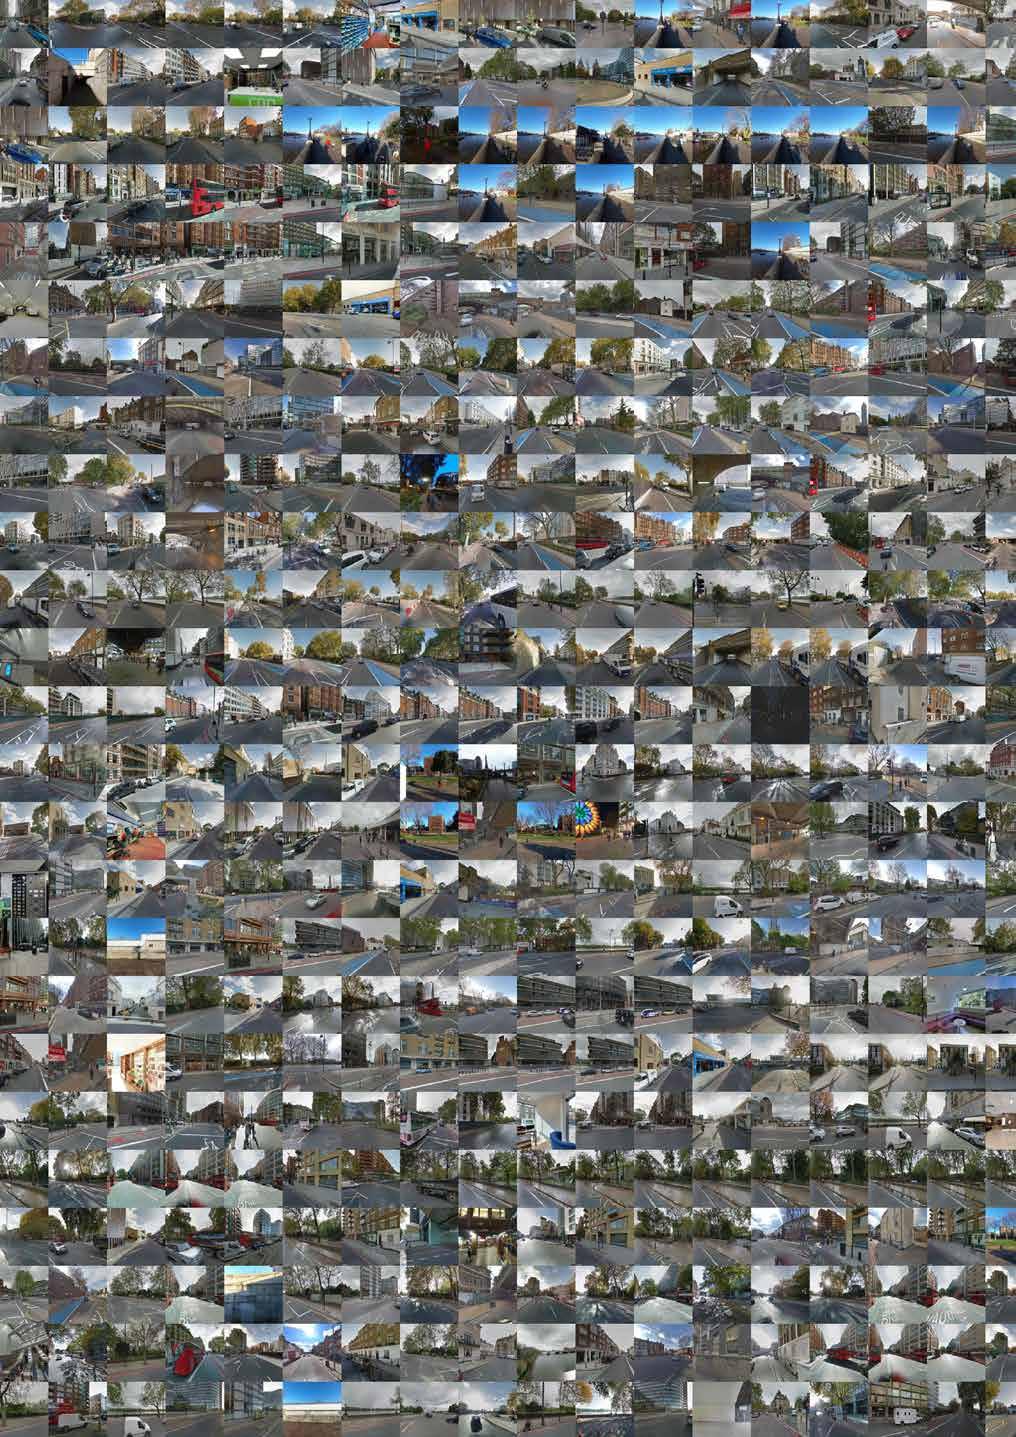
The final phase is divided into two sections, amalgamating the research and the design tools for visual dislocation in two major cities, namely, London and Paris. Detailed understanding of design interpretation, prototyping and reverse-engineering is processed through trained neural networks.
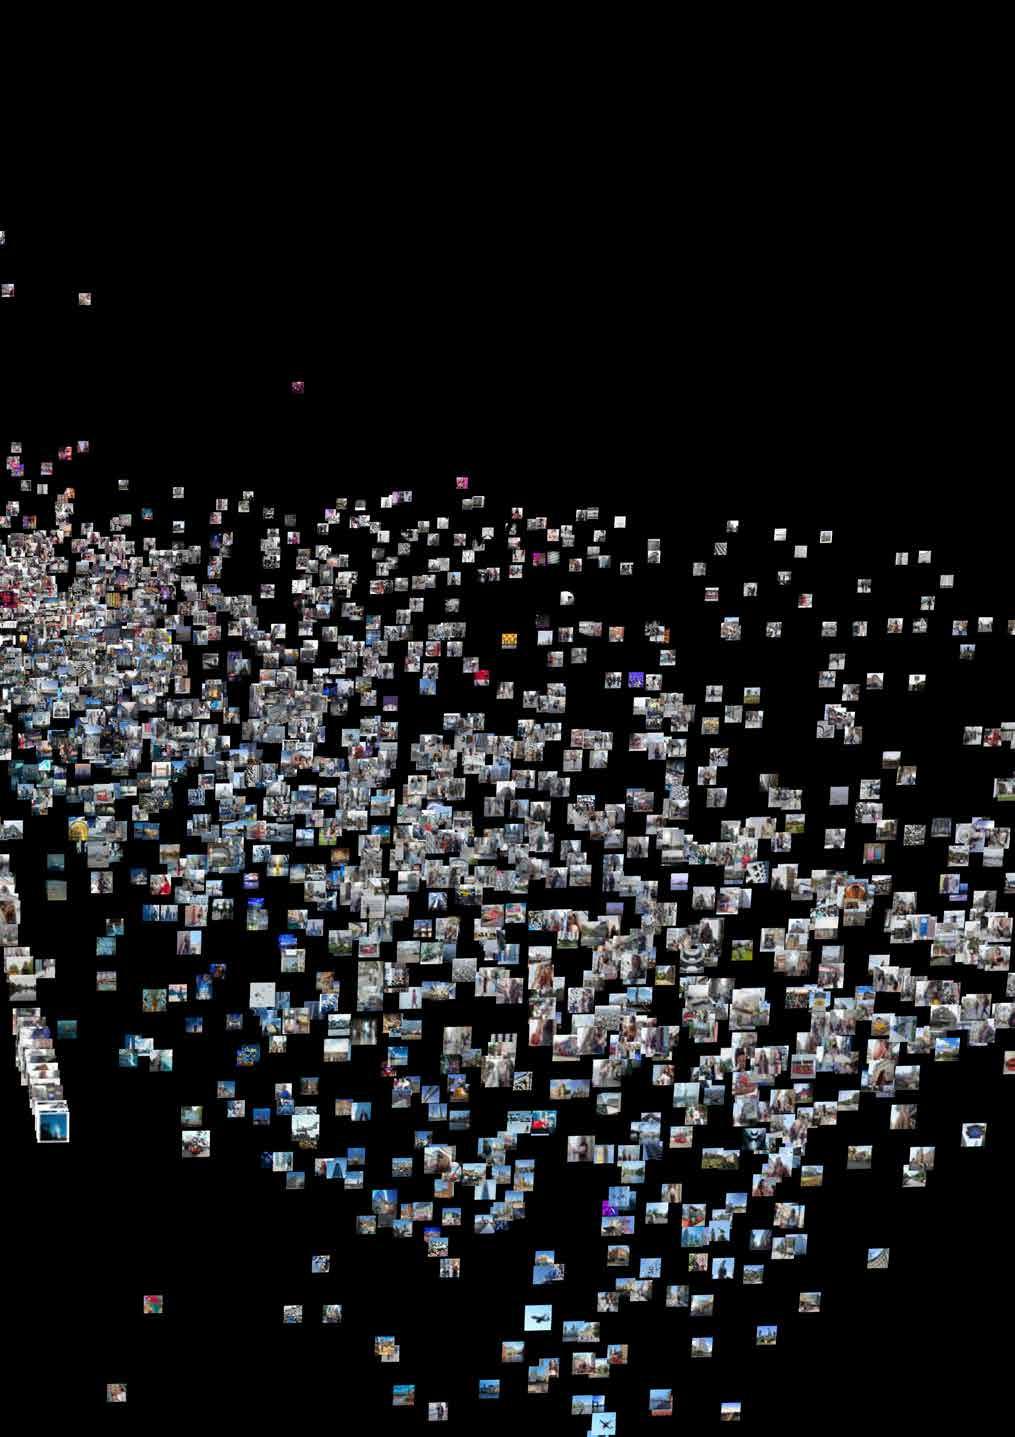
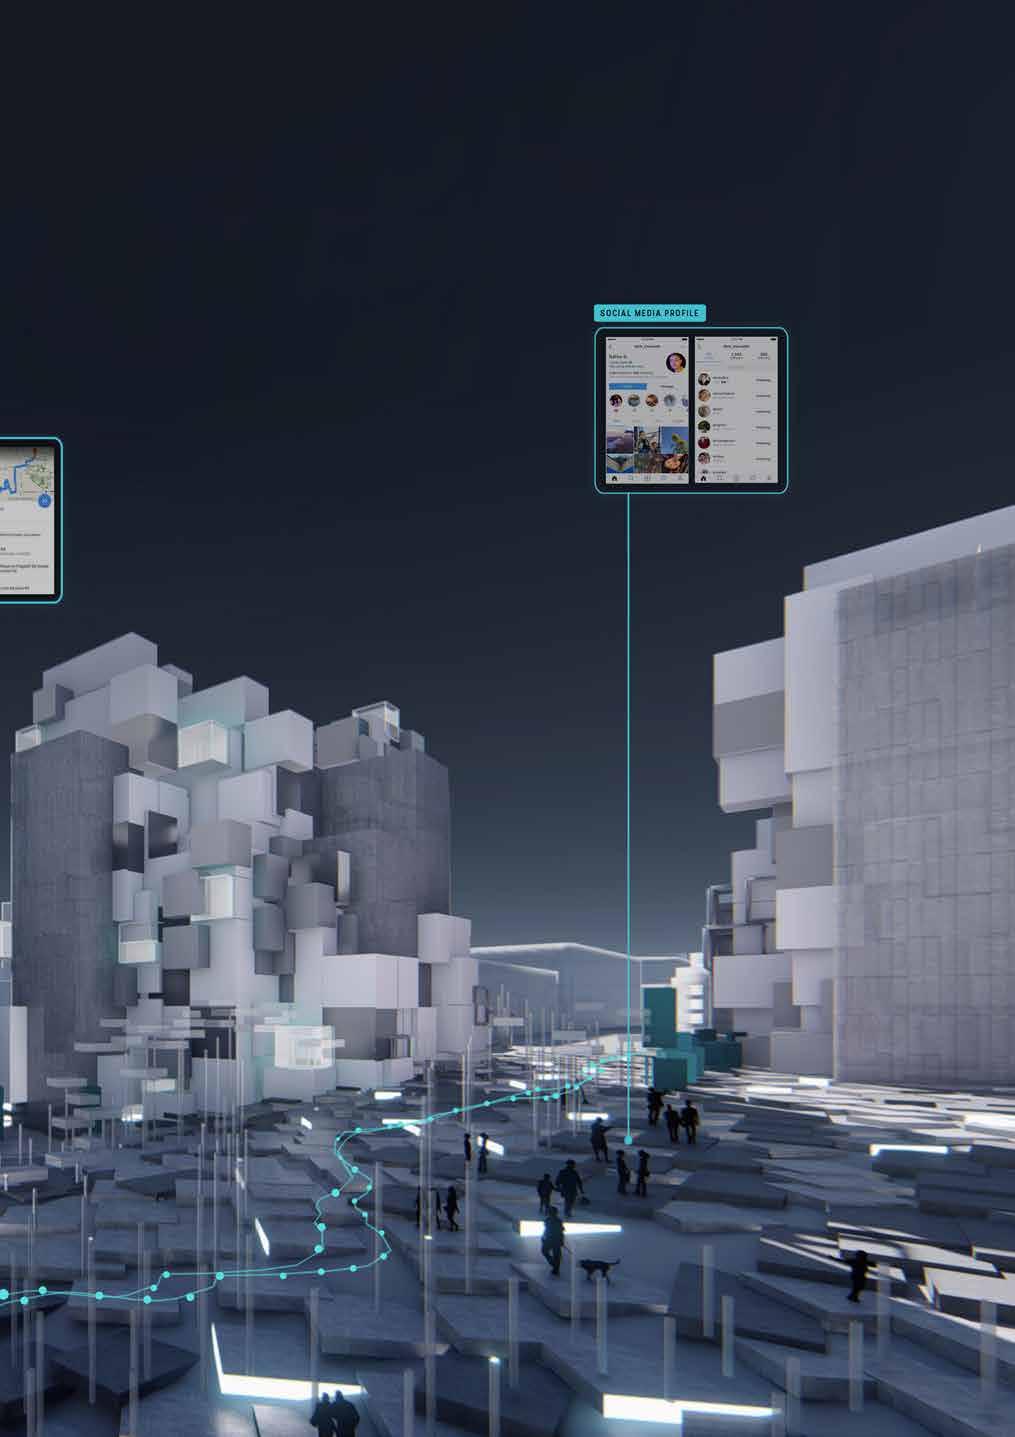
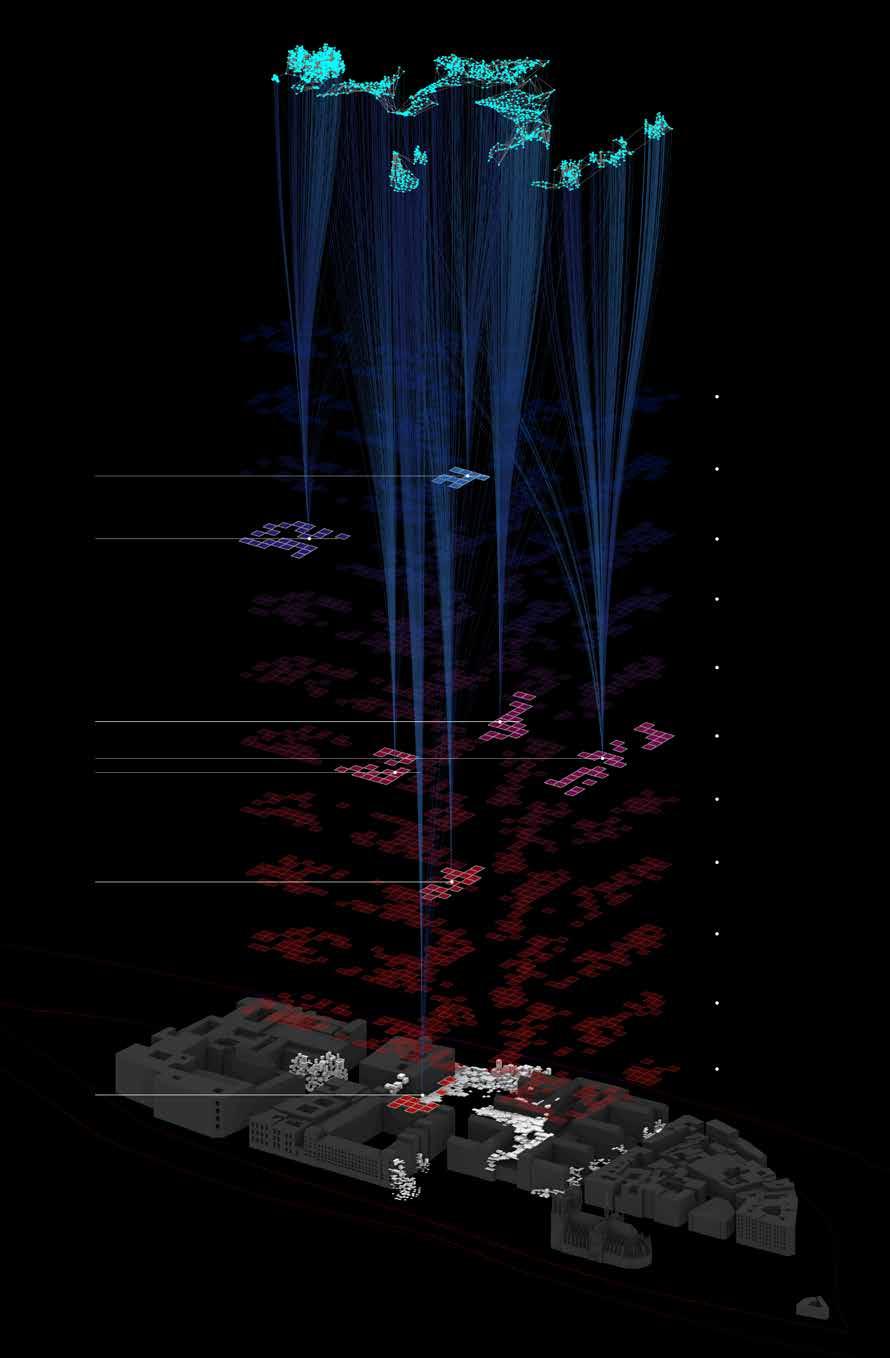
The research up until now has illustrated the role of visual perception from past and present. Their collective understanding illuminates the value of human navigation and perceived spaces. This section of research highlights on the computational measure to amalgamate different urban layers to examine the change in the perceptual environment. More we dig in to the microenvironment, the complexities and difficulties increases.
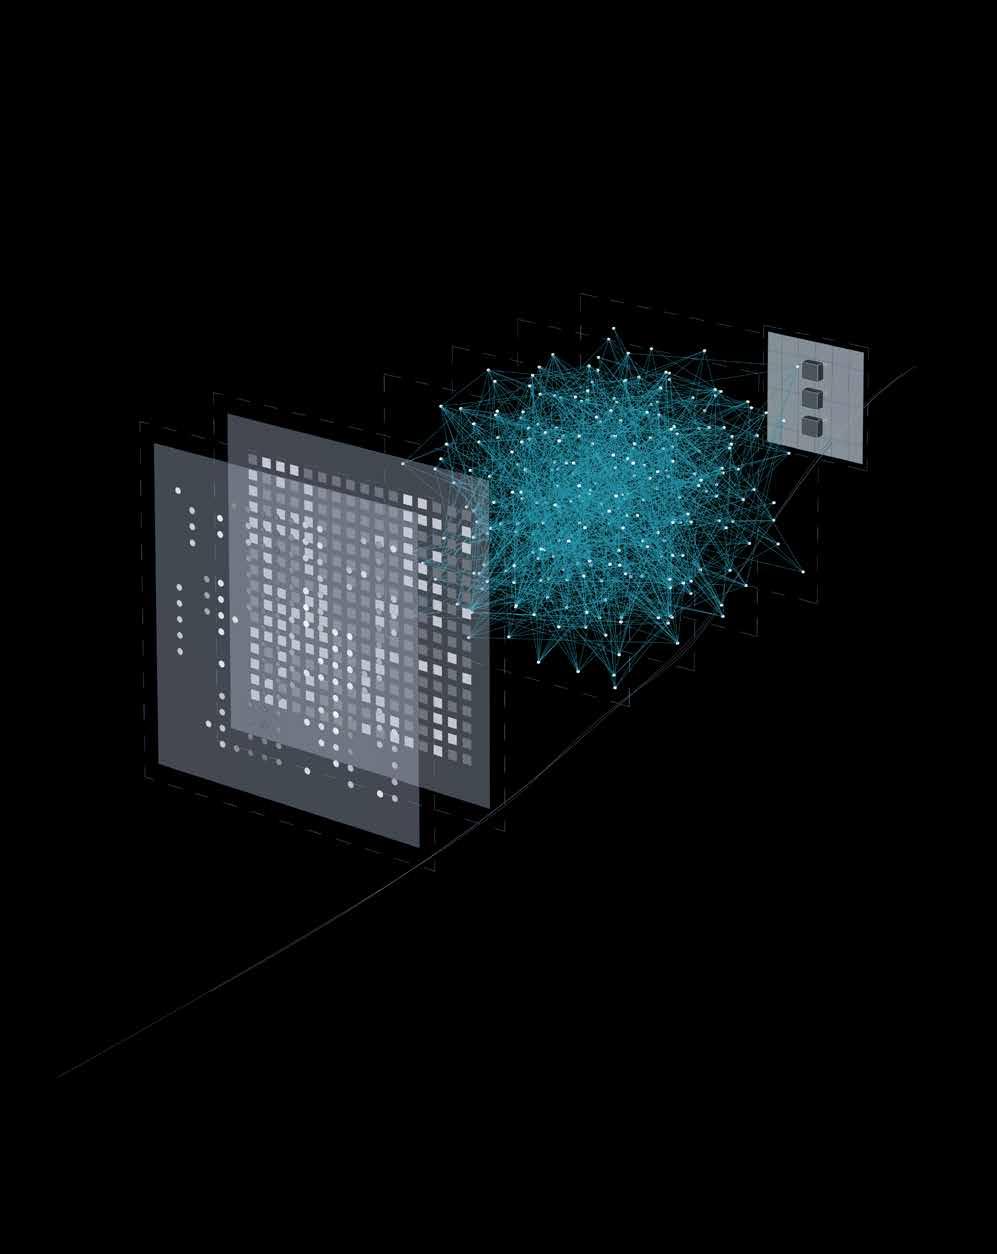
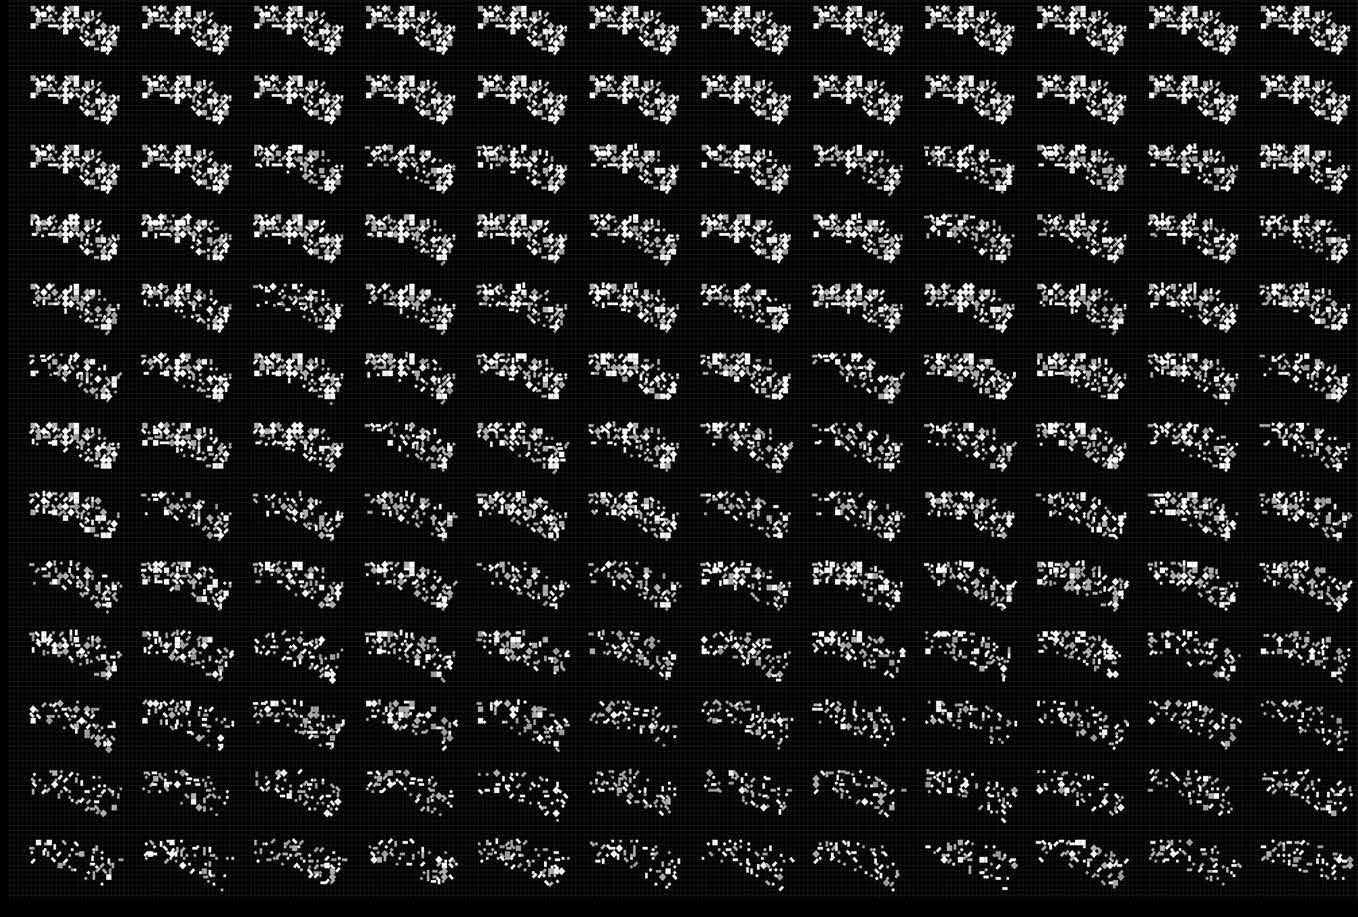
This mode of computer simulation helps to solve complex problems and can build intricate relationships between data layers that are often unstructured and unlinked to each other. On the lines of Deep learning, Neural Network (NN) toolkit are the set of algorithms recognising patterns whilst mimicking the human brain. The internal structuring of Neural Network are compared to human cognitive systems.
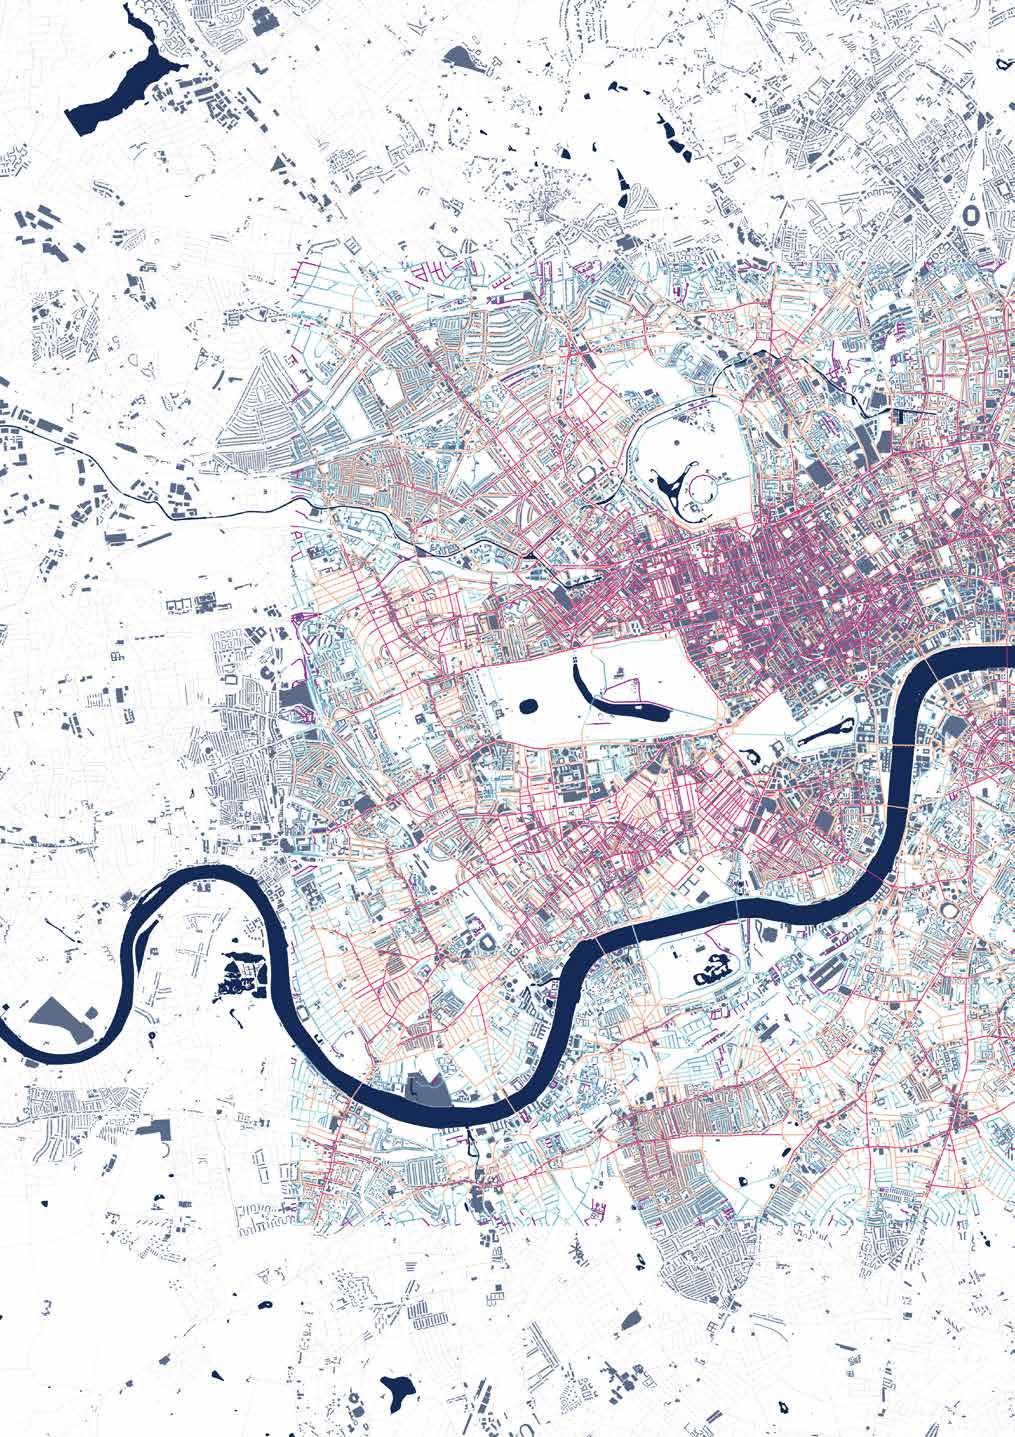
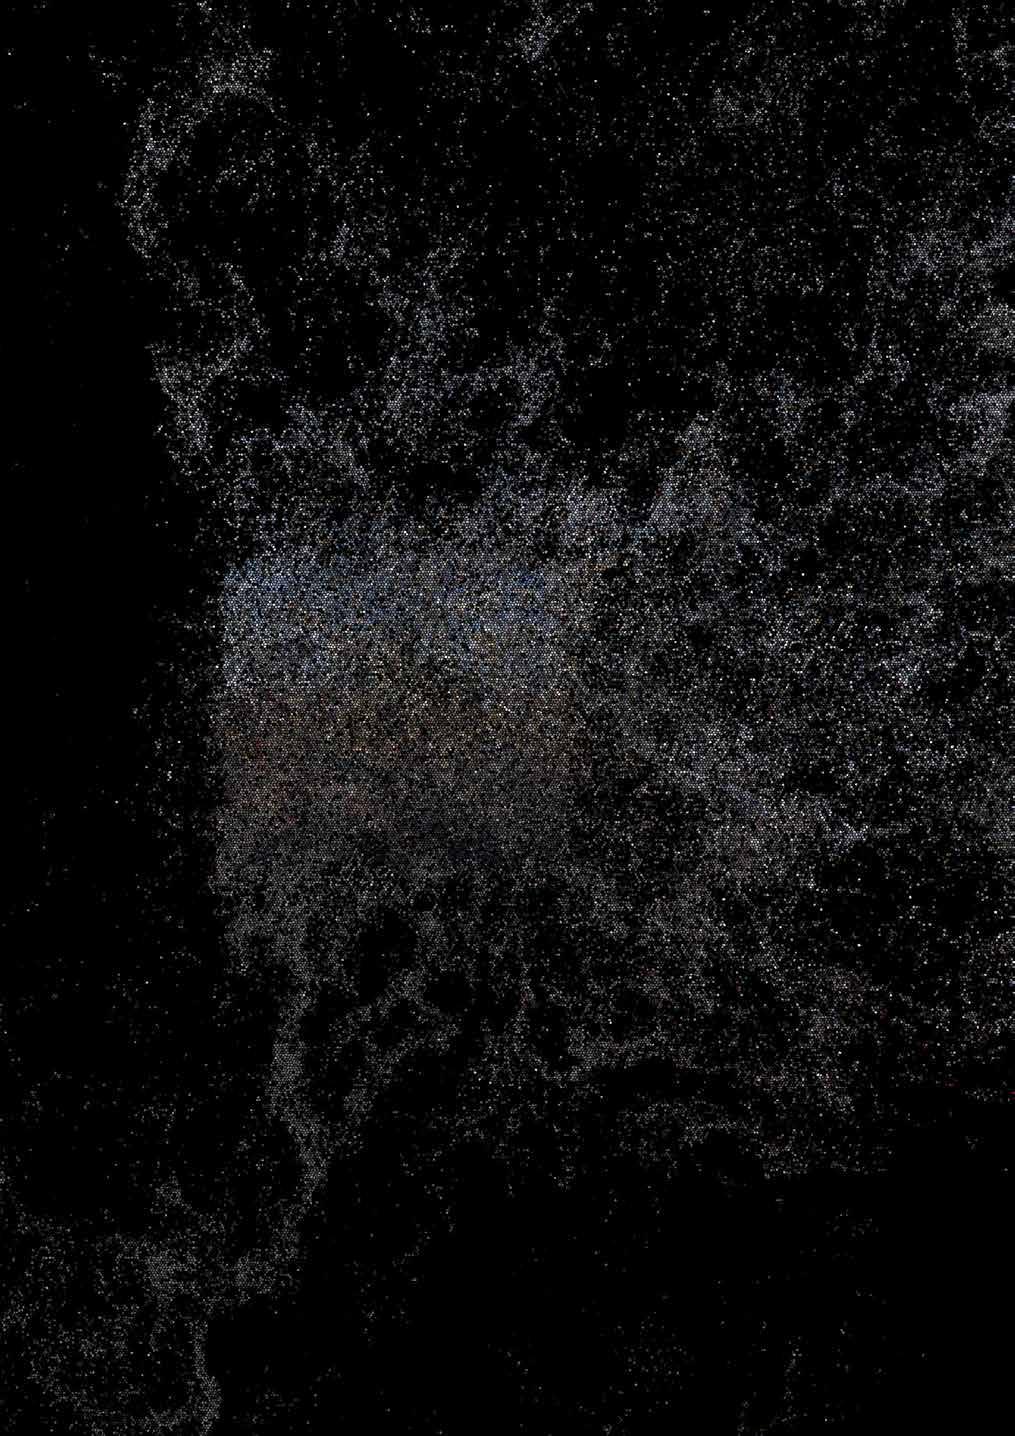
A unique Visibility Map is generated for the area. These values are then worked along with Neural Calculations in Generative Alogrithms. VISIBILITY MAP
To calculate the overall Visibility Index of urban space, the Isovist areas are added in together. OVERLAPPING VISIBLE AREAS
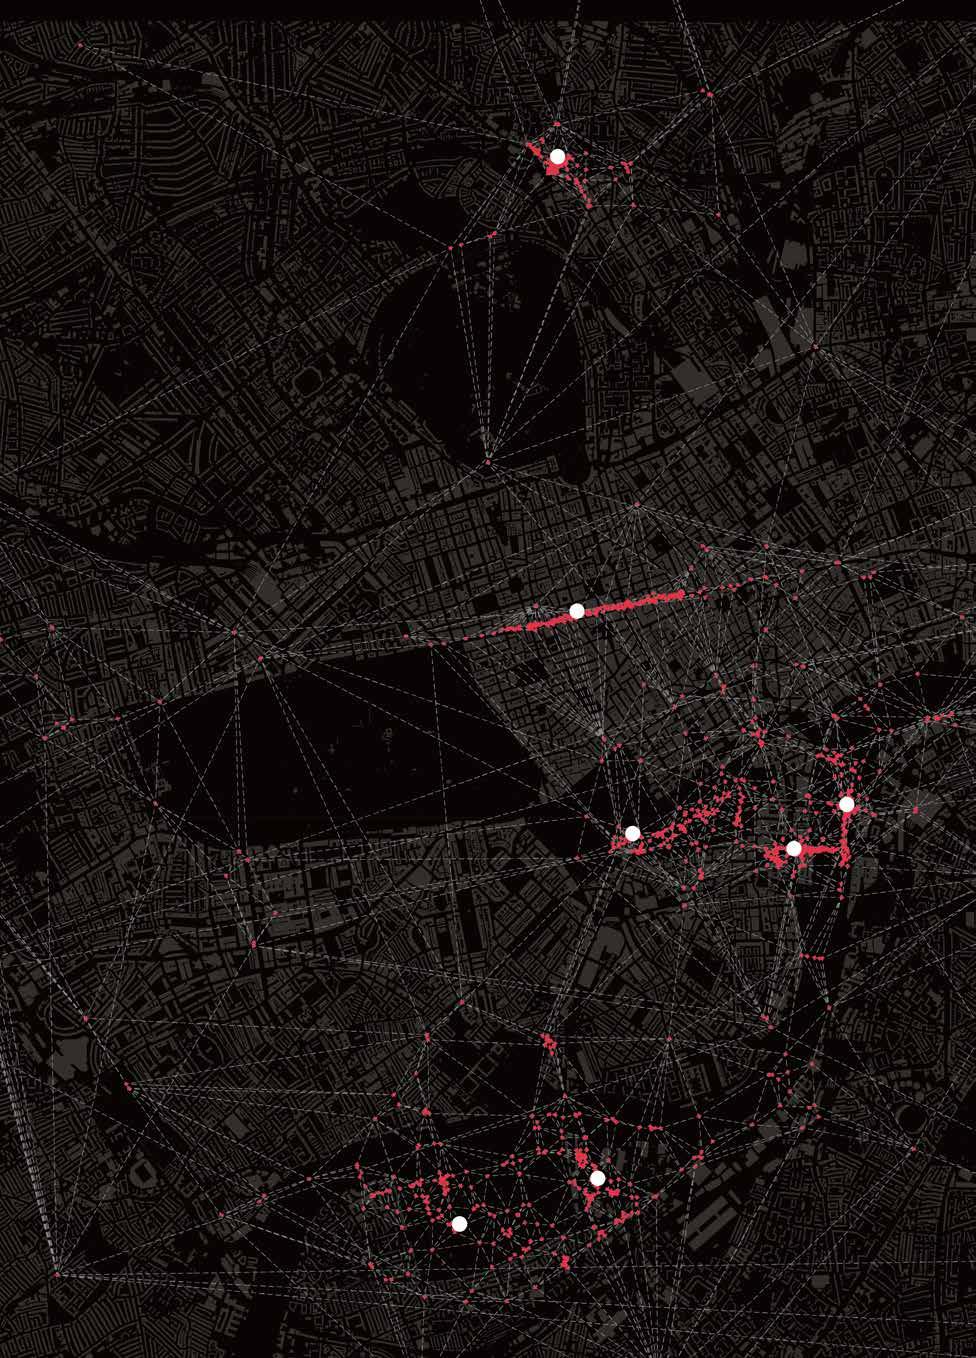
Visible area (Isovist Area) is calculated for every point on the route. MAPPING VISIBILITY ALONG THE DIRECTION FOR THE ROUTE
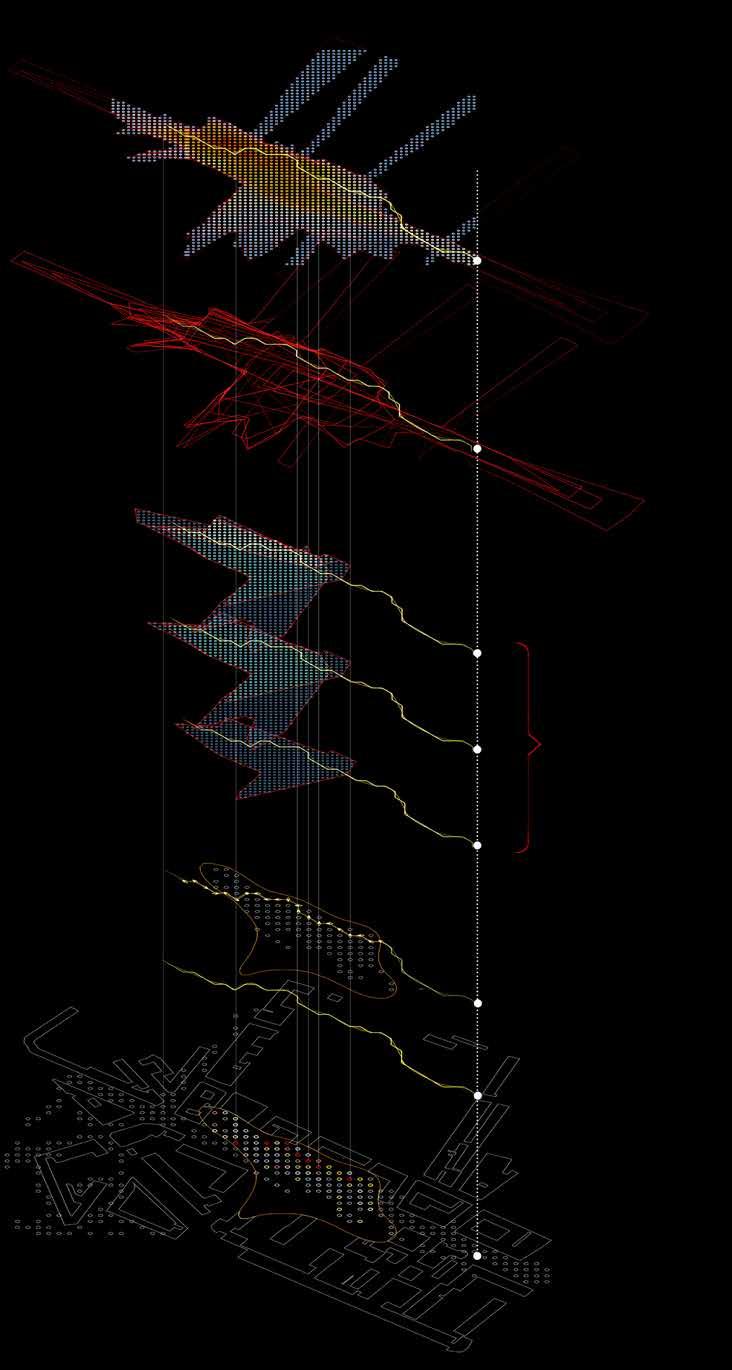
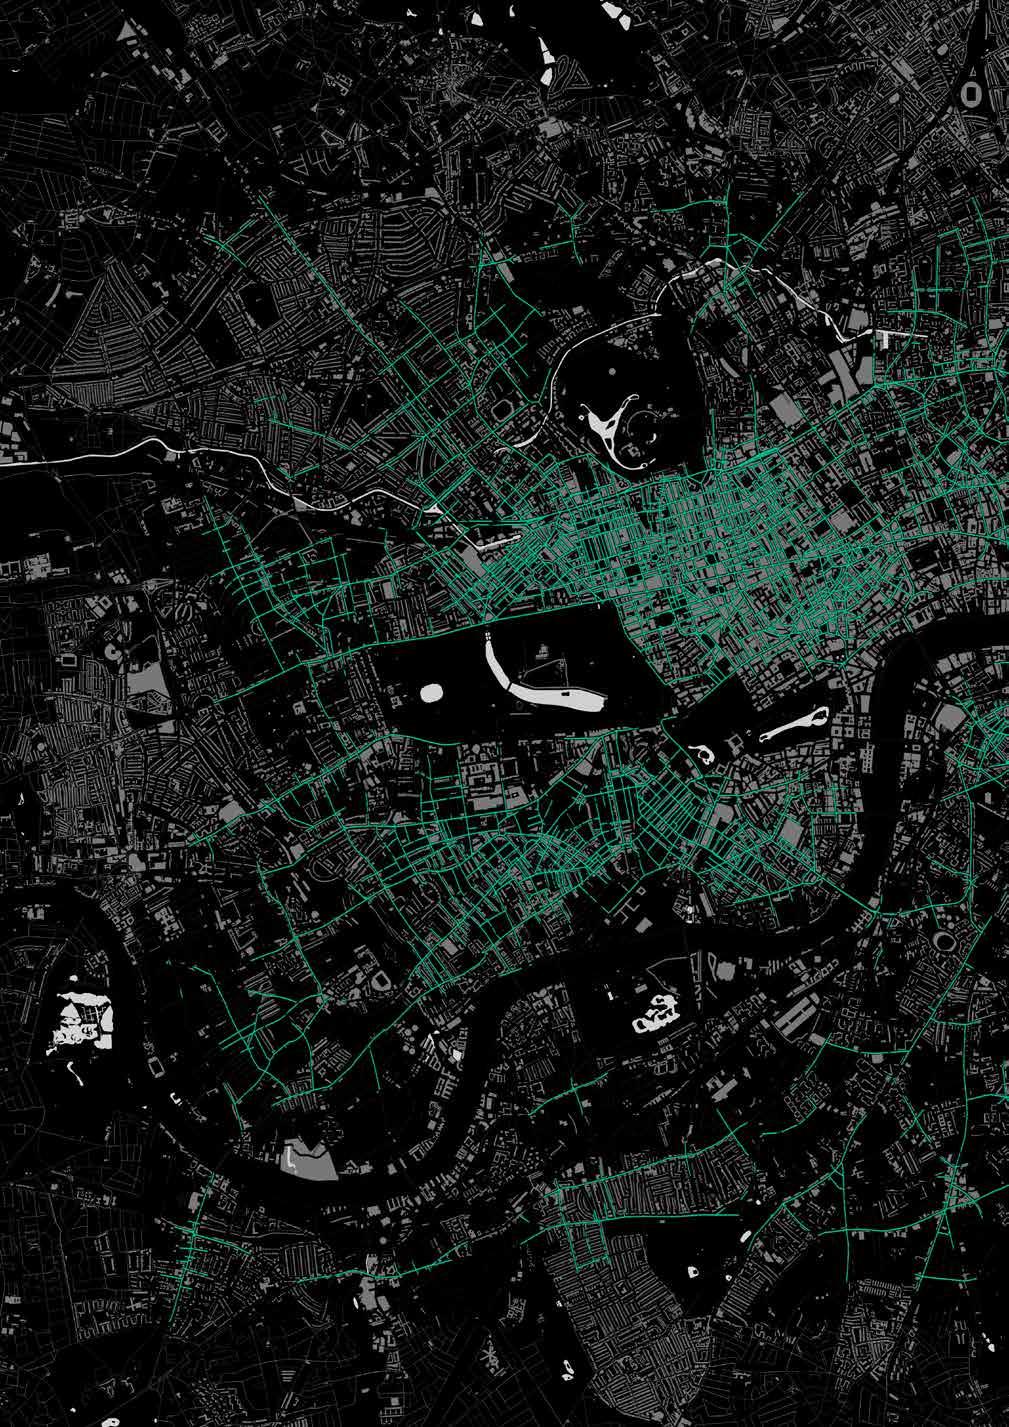
For the route, the dominant direction is mapped from Open Street Map to calculate the Visibility Index ROUTE’S DOMINANT DIRECTION
Based on the impression, the ideal route is identified IDENTIFIED ROUTE
Mapping of Human movement in the form of Number of Impressions, dataset being combined from Open Street Map GPS - NUMBER OF IMPRESSIONS
“We make our buildings and our building makes us” - Winston Churchill “Now we make our networks and our network makes us” - William Mitchell