
39 minute read
The Function and Mechanism of Photodetector Lee, Changmin Pablo


The function and mechanism of photodetector
Author 1 Full Name
(Last Name, First Name) : Lee, Changmin Pablo
School Name : Seoul International School
Introduction
Light has been a key source for a long era; however, the usage of light has been changing within society as it is practical for current technology. Before humanity discovered a fire, people relied on natural light as darkness was their major trouble. After they were civilized and created a whole society, sunlight had been a key source for a time as people created the sun clock. However, after the scientific revolution, scientists were able to discover the particle “photon,” which is a quantum of light. The idea of quantum mechanics, which deals with the microscopic world, started to get used for various fields of science, and one of them is a photodetector. For a long time, photodetectors were used, in simple terms, to detect photons. They detect the presence of an elementary particle photon and convert optical signals into electrical signals. This conversion can be a result of several effects, such as photoelectric effect or photovoltaic effect. Through taking electrical signals that were converted, which are known as photocurrent, the device can detect the light. There are several types of photodetectors. Most commonly known photodetector is photodiode, and it is widely used with the LED. There are other photodetectors such as Metalsemiconductor-metal photodetector, phototransistor, photoconductive detector, etc. These photodetectors have their own pros and cons. In the current science field, photodetectors are being used in several ways: they are used as spectrophotometers, which are for the purpose to check how much light the chemical sample absorbs, or as an optical storage device, where all reading and writing activities are performed by light.
Within this paper, the mechanism and function of the P-N photodiode will be covered. Moreover, in order to deeply understand the content, the simulator with diodes will be conducted. Even though the diode generates light with charge carriers and photodiodes generate photocurrent with incident photons, they both are two terminal devices that function in much similar way. But, in order to understand diodes, we first need to discuss the photoelectric effect, which is a key mechanism that converts the incident photons into photocurrents within the photodiode. Then, to talk about the semiconductor, which plays an important role in photodiodes, the band theory will be illustrated. After doing so, the idea of a semiconductor will be discussed, and finally, to understand the simulation, the I-V curve will be explained.
Photoelectric Effect
Photoelectric effect, which is a key source for a mechanism of photodetector, can be explained as the transition from the photon to the photoelectron. This occurs as when photons are incident on the metal surface, and when photons hit the metal surface, the photoelectrons get emitted. These produced photoelectrons are called photoelectric currents, and this is the key source of how the photodetector ‘detects’ the existence of certain light. The mechanism behind the photoelectric effect is related to the valence electrons, which are the electrons that are present in the outermost shell of an atom. Within the element, valence electrons are the electrons that are within the highest energy level among occupied states. These valence electrons can be removed if the electron absorbs enough energy by incident photons. In such a case for a photodetector, if light hits the metal surface, the photodetector will emit the electrons, which will result in photoelectric emission or effect. This ejection of electrons from the metal surface due to the incident photons is called external photoelectric effect. However, the photoelectric emission does not always occur when the light hits the metal surface. In order to emit the electrons from the metal surface, the frequency of the incident photon has to be greater than the minimum frequency, which is called threshold frequency. This threshold frequency is different for different materials. The frequency of the photon is directly proportional to its energy; high-frequency photons have greater energy than the low-frequency photons. This means that the photons with sufficient energy can be an alternative explanation for the trigger behind the photoelectric effect. Moreover, the frequency of photons is proportional to the kinetic energy of emitted electrons. High-frequency photons result in high-velocity photoelectrons, and low-frequency photons result in low-velocity photoelectrons. Maximum kinetic energy of photoelectron = h f - W f = frequency of the photon W = the work function of the metal surface h = Planck’s constant However, the electric current does not increase as the frequency of photons increases. This also means that the high kinetic energy of photoelectrons doesn’t always result in high electric current. The reason behind this is because each incident photon generates only a single electron. To increase the electric current, one can increase the light intensity, which is proportional to the number of photons sent over a given interval of times.
Different from what external photoelectric effect does, the internal photoelectric effect occurs within the metal surface, without any ejection of electrons. After sufficient absorption of photons, the free electrons within the metal can be created. This effect increases the conductivity of the solid.
Band Theory
To further investigate the mechanism behind the photodetector, band theory must be mentioned. Band theory describes the states of electrons, for the solid materials, can have certain values of energy within specific ranges. Within band theory, there are two types of bands: conduction band and valence band. And, the certain line called Fermi level, stays below the bottom of the conduction band above the valence band. The gap between the valence band and the conduction band is called the band gap, which has different length/size for all solids. First of all, in specific, Valence Band is a band of electron orbitals where electrons jump out of when it gets excited. Normally, when there has been no transmission of energy to the solid, the electrons stay within this area. Simply put, the valence band is the outermost electron orbital of an atom of the solid. When a certain amount of energy gets transferred to an atom, electrons from the valence band get excited and move up to the conduction band. In order to move up to the conduction band, these electrons have to absorb sufficient energy, which will let them overcome the band gap, which is an area between the conduction band and valence band. When the electrons arrive within the conduction band, it also means that those electrons have enough energy to move freely in the material. This means that the solid, which consists of these atoms, will be able to conduct the electricity. Why is it important to understand the mechanism of the band theory? It is because insulators, conductors, and semiconductors have different fermi levels and size of band gap. For an insulator, the band gap is wide, and the transmission of electrons from valence band to conduction band is extremely hard. Due to this reason, the insulator does not conduct electricity. In contrast, metal, which conducts electricity, has almost no band gap between the conduction band and valence band. In fact, some of them overlap. The semiconductor has a band gap size, smaller than the insulator, but wider than the conductor. This means that the semiconductor can conduct the electricity, but it also might not conduct the electricity if the energy isn’t sufficient to let the electrons move from valence band to conduction band. This semiconductor gets utilized in photodetectors.

Semiconductor

Pure semiconductor, which is also called intrinsic semiconductor, are semiconductors that are created with a single type of atom with four valence electrons. They are mostly created with silicon (Si) or germanium (Ge) as these atoms are relatively common and as they have a stable structure. They have comparatively low electrical conductivity. Also, at a temperature of 0K, the Fermi level is in exactly between the conduction band and valence band. By adding an impurity to pure semiconductors, one can change the property of the semiconductors. These types of semiconductors are called extrinsic semiconductors. In particular, extrinsic semiconductors can be classified to n-type and p-type.
A P-type semiconductor has an impure atom, which contains 3 valence electrons. For instance, the impurities that get added in P-type semiconductors are aluminium (Al) and boron (B). As these impurities contain only three valence electrons, atoms with 4 valence electrons (Si, Ge, etc.) lack a single valence electron, and create an electron hole. In contrast, a N-type
semiconductor has an impure atom that contains 5 valence electrons. Most commonly added impurities for N-type semiconductor are phosphorus (P) and arsenic (As). Within an N-type semiconductor, as only 4 out of 5 valence electrons will be shared, additional electrons will be created.
Photodiode
Now that we understand the basic mechanism and semiconductor, to further understand the photodetector, the photodiode and I-V curve will be discussed. The most commonly known type of semiconductor photodetector is photodiode, which contains P-N junction. It is highly compact and linear, has effective quantum efficiency, and generates nearly one electron per single photon. Moreover, in real life, it can be useful as it has a long lifetime, works in very small voltage, and creates low noise. and within the some photodiodes, P and N junctions are connected in reverse bias, which results in a depletion region at the P-N junction. This means that there are neither large numbers of holes or electrons, which leads to inhibition within the current flow. If an incident photon has greater energy than the band gap, then covalent bond breaks, and electrons and hole pairs are created. This results in causation of internal photoelectric effect, which leads to creation of photocurrent.
I-V Curve
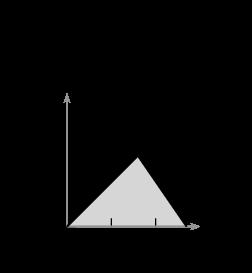
To further explain the characteristics of photodiodes regarding the current and voltage, the I-V curve, which stands for current-voltage characteristic curve, must be observed. As it has been stated, P and N junctions are biased, which means that positive voltage is on Njunction and negative voltage is on P-junction. Therefore, it means that negative voltage is being applied to the photodiode regarding the current within the junction. The I-V Curve for the reverse biased will be within the negative voltage and negative current, which is in the 3rd quadrant.

As there is inhibition within the current flow, theoretically, the amount of current that flows will be close to zero. However, as we can see from the upper graph, there will be a tiny amount of current, which can be measured in mirco-amperes. This small amount of current that gets created when there is no light is called dark current, or it can be called reverse leakage current. If the light hits the photodiode, the total current that the diode will give is the sum of dark current it creates and photocurrent. This means that as the photodiode produces more dark current, the sensitivity of the photodiode will decrease. After a sufficiently high value of the reverse bias voltage gets applied to the photodiode, the photodiode will start to overheat and malfunction. Within this moment, there will be the flow of maximum current within the diode. If the diode is rather connected in a forward bias, then it means that the negative voltage is applied to the N-junction and the positive voltage is applied to the P-junction. When there is no light present, then the I-V curve for the forward biased diode will stay within the first quadrant.
In case of a forward biased diode, as it has a comparatively thin depletion layer, the diode itself will allow rather high currents to pass through. The point within the I-V curve where there is a sudden increase in current is “knee point.”
Photovoltaic Mode vs. Photoconductive Mode
The photodiode can function in following modes: photovoltaic mode and photoconductive mode. The main difference between these two modes is that for photovoltaic mode, the diode is not connected to the power source, whereas for the photoconductive mode, the diode is connected to the power source. They both have their advantages and disadvantages, and they function in different ways.

For the photovoltaic mode, as the diode is not connected to the power source, the diode is not biased. When the photon with energy higher than the band gap hits the photodiode, the electrons get excited and head to cathode terminal, while hole pairs head to anode terminal. This creates a potential difference between these two terminals, which leads to creation of the photocurrent. The advantage of photovoltaic mode is the reduction of dark current, since applying a reverse-bias voltage increases the dark current. However, as the diodes that have photovoltaic mode aren’t biased, they have less leakage of dark current. In contrast, for the photoconductive mode, an external reverse bias is applied to the diode. When the photon hits the photodiode, it creates a pair of electrons and holes, and the current measured through the circuit implies the existence of a photon. An external reverse bias within the pn junction widens the depletion region, which leads to two beneficial effects within the photodiode. First of all, as the depletion region is wider, the photodiode is more sensitive. Secondly, it reduces the photodiode’s junction capacitance, which is advantageous for responding to rapid variations within the light.
Simulator
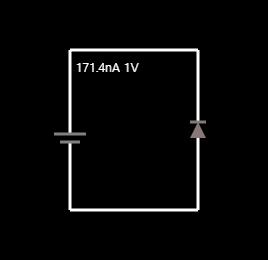
To further study about the photodiode, the reverse biased diode and forward biased diode were designed within the simulator. For all of the circuits below, for voltage flow, there is 1 voltage.
1. Reverse Biased Diode
Within this image, we can know that this is a simple reverse biased diode as positive voltage is getting applied to the N-junction and negative voltage is getting applied to the Pjunction. For the left image, the current source has been added in order to emulate the effect of added light. In the right image, it is simply connected reverse biased, and the current that flows within the circuit is in the unit of nanoampere.

2. Forward Diode

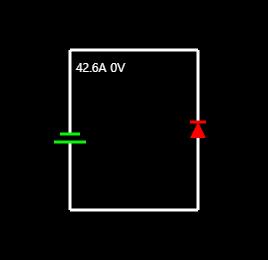
In order to create a forward biased diode, it was rather simple as positive voltage gets applied to the P-junction and negative voltage gets applied to the N-junction. For this diode, there seemed to be no change within the overall electric current flow when we added current source, as adding 10 microampere wasn’t significant for this diode. For Forward Biased Diode, the I-V curve was created by manipulating the voltage from 0.1 to 0.9.
For the result, it would be better to look at circuits that don’t contain current source.
1. Reverse Biased Diode Current
Voltage Source 171.435nA
Diode -171.435nA Voltage Drop(VD)
1V
-1V Resistance
5.833MΩ
X Electric Power(P)
-171.435nW
171.435nW
2. Forward Biased Diode Current Voltage Drop (VD) Resistance Electric Power(P) Voltage Source 42.61A 1V 23.469mΩ -42.61W Diode 42.61A 1V X 42.61W
Comparison between Forward Biased Diode and Reverse Biased Diode Current Voltage Drop(VD) Electric Power(P)
Reverse Biased Diode -171.435*10-9A -1V 171.435*10-9W
Forward Biased Diode 42.61A 1V 42.61W

Through these simulations, two results came out. First of all, for the reverse biased diode, the current comes out in the negative form due to the negative voltage. This was also seen within the I-V curve, as the reverse biased diode I-V curve was within the 3rd quadrant. Secondly, the fact that the reverse biased diode has a thicker depletion region than forward biased diode gets shown within these simulations. This can be seen from the huge difference in current between reverse biased diode and forward biased diode.
1. Forward Biased Diode Voltage(V)
0.1 Current(A) 1.013*10-6
0.2
0.3
0.4
0.5
0.6
0.7
0.8
0.9 8.017*10-6
56.416*10-6
390.907*10-6
2.7093*10-3
18.678*10-3
129.088*10-3
892.127*10-3
6.165

By looking at the I-V curve for the Forward Biased Diode, the knee point and the band gap energy can be estimated. Within the data table, when the voltage changes from 0.7 V to 0.8 V, the increase within the current gets dramatically larger. This can be also seen within the graph as there is huge difference within the slope for the tangent line between the voltage of 0.7V and 0.9V. Therefore, it can also be estimated that the band gap energy is between somewhere 0.7V and 0.9V.
Conclusion
Within this paper, further study about the mechanism of the photodetector, photoelectric effect and band theory has been discussed. Photoelectric effect, in short, turns incident photons into photocurrent. There are two different photoelectric effects, and they are external photoelectric effect and internal photoelectric effect; key difference between these two effects is that external photoelectric effect ejects an electron while internal photoelectric effect creates free electrons within the metal, which increases the conductivity of the solid. After so, band theory had been explored as it is needed to explain the difference in insulators, conductors, and semiconductors. They all have different fermi levels and size of band gap, and semiconductors, which can either conduct or don’t conduct electricity, are solids that can be used for photodetector. Lastly, to conduct a simulation with a photodetector, we choose photodiode for the simulation as it is the most commonly used photodetector. With the basic information of photodiodes, the I-V curve of photodiodes and difference between reversed/forward biased diodes gets also discussed. Regarding the simulation, we have compared reverse biased diodes and forward biased diodes. Within the forward biased diode, there was extremely higher current flowing than the reverse biased diode, and I-V curve for the forward biased diode was able to be drawn in a graph. However, the I-V curve for the reverse biased diode wasn’t able to be drawn as the diode within the simulator was in ideal condition. In future, to conduct a better experiment, the diode will be reverse biased, and the I-V curve will come out as we expect.
Works Cited
[1] Electronics Tutorial, Basic Physics, Online Tests, Computer Basics, Concepts of Physics, www.physics-and-radio-electronics.com/blog/photoelectric-effect/.
[2] Paul Falstad, www.falstad.com/circuit/circuitjs.html?ctz=CQAgjAzCAMB00IQVhBWAWJAmd6xgE4kIlos kwQkAOcK6KgUwFp8AoAExF1oiwZ7gAbAywgOjAGYBDAK4AbAC5sA7t3S0wI1P2ENo qnQy0M+xgmIiGzR9b10GAbrYjR0twmP3djMP3CRrXVd3GxsDAEsqMEs3aLFPf3hEaAI09
IzMgkNBGwpY9wM1QRN48AsYNiA.
[3] “Avalanche Effect.” Encyclopædia Britannica, Encyclopædia Britannica, Inc., www.britannica.com/science/avalanche-effect.
Keywords: elderly fall, alert mechanism, wireless communication, three-axis acceleration sensor, sensor, pressure sensor, Arduino, MIT AppInventor
Introduction
This paper looks into the potential of an accurate system for detecting fallsin the elderly and alerting emergency responders and patient’s families of the fact.
As Korea is rapidly becoming a super-aged society, falls in the elderly increase. Thus, a system that immediately alerts emergency responders and family members is much needed in our society. However, there have not been many concerted efforts made. Previous efforts that have been made in this area of research towards the detection of falls has been mostly inaccurate and limited in terms of space and range.
This paper looks into solving such problems with the utilization of cell phones and wireless communication. In places where wireless communication works smoothly, shoes with pressure sensors and three-axis accelerometers can be used. In mountains where wireless communication is often blocked, three-axis accelerometers and satellite sensors in phones can be utilized to detect falls and alert emergency responders and families of elderlies.
Distributing the shoes mentioned above with pressure sensors and three-axis accelerometers and linking fall detection and alert systems with fall prevention programs would reduce the time it takes for emergency responders to reach fall victims, and this would, in turn, increase the health and life spans of the elderly and bring a decrease in medical fees.
Research Background
South Korea is already an aging society with 14% of its population aged 65 and older. Thanks to medicine and improved living standards, the ratio of people sixty-five and older are expected to grow to 20% by 2026. This would make South Korea a super-aged society.1
With this rapid increase of the elderly population, accidents among the elderly are increasing as well. Of these, falls are prevalent, and they are the number two reason for fatal accidents among the elderly. Death from falls is the number five reason for death of the elderly after cancer.2 13% of the elderly die when they fall.
Not all falls lead to death, but the injuries are a grave issue as well. Every year 30% of people 65 and older fall and 40%of those 80 and older fall. Of these fall victims, around 10% suffer from fractures in their spines, coxas and wrists. There is severe damage in the form of cerebral hemorrhage. All of this leads to severe economic and social damage.3
1 Chunjae Education Inc. “Chunja Learning Encyclopedia” under, “Super aged society.” 2 Bae, “Joongangilbo Health Media”under, “No.2 reason of Death in Elderly, Falls.” 3Medical Nurses Association, “Journal of Korean Clinical Nursing Research,” under Clinical Practice Guideline for Assessment and Prevention of Falls in Adult People.”
Recently, due to the COVID-19 pandemic, many elderly people are staying home. Thus, many of them are alone without the aid of family or other caretakers like social workers. This means more people experience fall when there is no one to help them.
When the elderly falls, there is already a high chance of serious injury like fractures. This risk can be greatly aggravated when the victim of the fall can not get help as they are immobile from the accident.
As of present, there has been much progress in the research of assisting devices and shock mitigation but so far very little has been done in the realm of detecting the impact of falls nor has much research been conducted on alerting such falls.
Research Purposes and Testing Goals
Research Purposes The ultimate goal of this study is to develop a system that can accurately detect and alert falls of the user and can be applied in everyday life. The standards for abnormal impacts must be investigated and fall alert system that is effective must be developed.
Testing Goals Setting criteria for abnormal impact that implicate falls, measuring the impact of falls and setting a minimum impact threshold for what makes for a fall, finding methods of detecting a fall, developing an impact detection app using App Inventor, distinguishing normal impact in everyday life from that of a fall and increasing its accuracy are all testing goals.
Stepping patterns will be studied using Arduino boards and pressure sensors. Measured values will be drawn from pressure sensors and types of graphs to be used will be investigated. Graphs will be studied to detect and measure users' stepping patterns.
When it comes to studying the direction of falls, using Arduino boards and acceleration sensors, each direction of falls will be designated an axis on graphs. (Ex: axis x, y, z) The acceleration signals of these axes will be measured and analyzed. Perturbations in the acceleration signal of these axes that come from falls will be used to create a detection system of falls and their directions.
Preliminary Research: Terminology and Preceding Research
Terminology Fall: An act of falling or collapsing; a sudden uncontrollable descent. Falls happen while walking, getting onto beds, climbing stairs, using the bathroom, when any other time
positional changes are made and while using mobility aids like wheelchairs, canes and walkers.4 Impulse: Impulse is a term that quantifies the overall effect of a force acting over time. The newton-second (also Newton second; symbol: N⋅s or N s) is the derived SI unit of impulse as shown in Figure1. It is dimensionally equivalent to the momentum unit kilogram-meter per second (kg⋅m/s) used to measure momentum.5
Figure 1: impulse and momentum
Force Sensitive Resistor (FSR): FSRs are sensors that allow you to detect physical pressure, squeezing, and weight and are distinguished by their operation principles. There are mechanical, electronic and semiconductor FSRs.6
FSRs primarily use resistive touch technology (sensing pressure) or capacitive touch technology (sensing electrodes). When it comes to resistive touch technology, usually there is a glass panel covered with special films and a resistive touch overlay that senses pressure.
The capacitive touch technology uses the fact that the human body is a dielectric material as a part of a capacitor. Capacitive touch screens are covered with transparent conductive metals that sense electrical field change that happens when touched by a finger, as shown in Figure 27 .
4 Happy Campus, Falls in the Elderly Prevention Education Material, under “Falls in the Elderly Prevention Education Material.” 5 Sarvazyan, Armen, PY, “Ability of skeletal muscle to protect bones and joints from external impacts: Acoustical assessment ( Journal of the Acoustical Society of America, 2015) 6 Global World Encyclopedia, under “Pressure Sensor” 7https://fieldscale.com/learn-capacitive-sensing/intro-to-capacitive-touch-sensors/
Figure 2 the principle of the capacitive touch sensor
Accelerometer: An accelerometer is an electromechanical device used to measure acceleration quantity as shown in Figure 3. The sensors used in an accelerometer measure acceleration and impact.8 The unit used is standard gravity (g), and the range can vary greatly depending on the sensor.

Figure 3 The example of the Accelerometer and its principle
GPS: Global Positioning System; a radionavigation-satellite service. It can accurately tract locations all over the world. 9 Radio waves from artificial satellites are detected and used to automatically tract locations. Basically GPS utilizes trilateration, which uses two points to find the location of a third point in between the two points by measuring the sides of the triangles formed when all the points are connected. The third point is the unknown point to be found and the other two are the artificial satellite and GPS receiver.


8 U.A. Bakshi,“Instrumentation Engineering”( A.V.Bakshi Technical Publications, 2009) 9 Korea Aerospace Research Institute, under “GPS.”
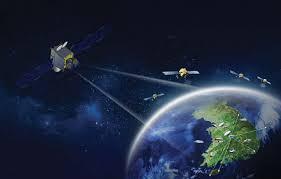

Figure 4 GPS satellite
Arduino Uno: An open-source microcontroller board based on the Microchip ATmega328P microcontroller and developed by Arduino.cc10 as shown in figure 5. It is like a simple version of a computer main board where diverse sensors, parts and equipment can be connected. With the right software, the controller board can move things like robots, so it can be considered open ware hardware.
Figure 5 Arduino Uno: An open-source microcontroller board

10 Makerspace, under “Arduino.”
Blynk: Blynk is an IoT(Internet of Things) platform that connects clouds, apps and hardware like Arduino Uno.11
Figure 6. Blynk Platform
Preceding Research
The following research is about falls in the elderly and how to prevent them. However, there is not much meaningful information on the detection of falls or what to do when they actually happen.
In ‘Geriatric Hospital Nurses' Knowledge, Attitude toward Falls, and Fall Prevention Activities,’12 the knowledge, attitude towards falls of nurses in geriatric hospitals, the measures they take to prevent them, and how these all actually prevented falls was studied. It turns out the nurses' knowledge and attitude did effectively prevent the falls of patients, but this did not lead to a means of being helpful when the falls did occur regardless.
Fall prevention education programs using videos proved to be useful in terms of attitudes towards falls, prevention behaviors, and satisfaction among elderly inpatients13. However, this did not give a practical solution when patients actually experienced fall.
In ‘A Study on the Type and Intervention of Exercise to Prevent Falls in the Elderly’, 14 exercise programs tailored to a person's physical strength in terms of time and intensity were looked into in that they may have the potential to have a positive or negative effect on fall prevention. However, same as the research mentioned before, this paper did not look into what could be done when falls actually happen.
In ‘Design and Implementation of Robot-Based Alarm System of Emergency Situation Due to Falling of The Elderly’,15 there is a four-legged robot armed with a sensor node that could detect falls and in emergencies send those concerned videos so that they could call 119 (an emergency phone number). In this way an effective system to deal with falls was created,
11 Blynk, under “Intro.” 12 Kim, Seo, ”Geriatric Hospital Nurses' Knowledge, Attitude toward Falls, and Fall Prevention Activities, “2. 13 Kang, Song, ‘’Effects of Fall Prevention Education Program on Attitudes, Prevention Behaviors, and Satisfaction among Elderly Inpatients,”49~50. 14 Ahn,Lee, “A Study on the Type and Intervention of Exercise to Prevent Falls in the Elderly,” 25 - 37. 15 Park , Lim, Kim Yu, “Design and Implementation of Robot-Based Alarm System of Emergency Situation Due to Falling of The Elderly”,781 - 788.
but there were problems. First, privacy issues having to do with the robot videotaping the elderly 24/7, second, the sensor node had to be worn at all times and finally, there had to be people on the standby 24/7 to alert emergency services for this to work.
In ‘Fall Detection of the Elderly through Floor Vibrations’ 16 a system of detecting falls from vibrations on the floors of homes was devised as most falls happen at homes. But analyzing the info from the piezoelectric film, operational amplifier and filter circuit and sending it to a computer proved too complicated to be commercialized.
In ‘An Efficient Methodology of Fall Detection for Ubiquitous Healthcare’, 17 a healthcare device worn at the wrist is mentioned. It increases the chances of fall detection by analyzing the sounds from falls and with an acceleration sensor. However, for the following reasons it was considered impractical for commercial use; as it relied on sounds, there was an issue of privacy and sounds from everyday life were often mistaken as the sounds of a fall.
The paper ‘Fall detection system based internet of things’18 used IoT with Blueinno sensor modules and connected them to smart devices via bluetooth. However, it only has an acceleration sensor so the false fall recognition rate is high.
As we can conclude from all the previous research, when it comes to detecting and preventing falls in the elderly, the systems and equipment devised so far have proven problematic. Some required that complicated equipment be installed into users' floors and other parts of homes. Some had to be worn at all times on places like the wrist and would be uncomfortable. Some required the background noise to be recorded and could thus pose a threat to the user’s privacy.
The biggest problem is that most of the solutions offered have to do with fall prevention only indirectly and little to do with directly stopping falls from happening and could hardly be of help when they do happen. The existing fall detectors had high false recognition rates so they were not very useful. All of these reasons were why the existing advances in the area were not suitable for nursing homes, hospitals and homes. This is how the idea of shoes with a fall detection system that could easily be worn came to be. Such shoes could be a simple and comfortable yet practical solution to detecting and alerting fall amongst the elderly.
Research Methods:
Utilization of App Inventor for the Development of a Fall Detection App and Finding a Sensory Threshold for Falls
Materials: Smartphone, MIT App Inventor
16 Kim, Yu, Baek, “Fall Detection of the Elderly through Floor Vibrations,”134 - 139. 17 Kim, “An Efficient Methodology of Fall Detection for Ubiquitous Healthcare”,133 - 140. 18 Jeong, Cho, “Fall Detection System based Internet of Things”, 546~2553.

Figure 7. App Inventor design
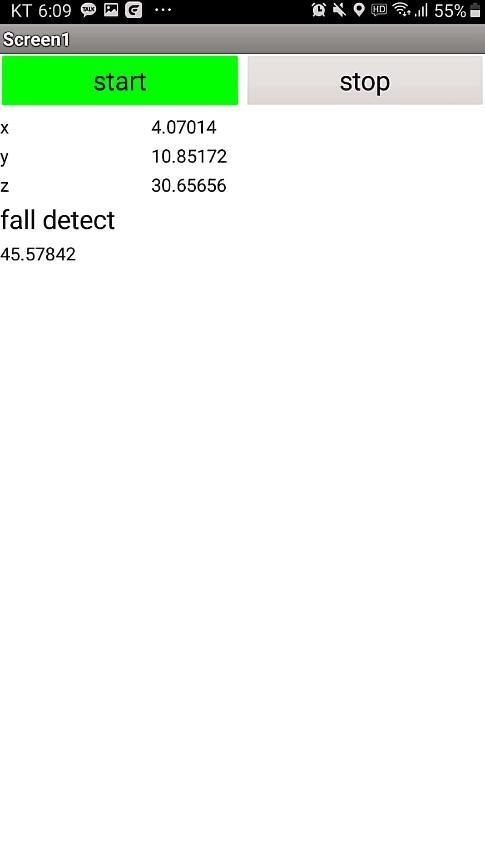
Process: After accessing http://ai2.appinventor.mit.edu/, add two 'start' and 'stop' buttons on the designer screen. Six labels will be added below, and then the x, y, and z-axis accelerations will be displayed on the right label, respectively. Add an empty label below it so that the sum of the absolute values of the three-axis acceleration is displayed there. Next, add an acceleration sensor and a clock. These are included in invisible components.
Pressing the ‘start’ button on the block coding screen activates the clock and the ‘stop’ button deactivates the app. The Global variable ‘absSum’’s initial value has to be set to a ‘0’. Once the clock gets activated, the x, y, z axes is added to the absolute value of the acceleration value. Then the absSum variable is calculated based on the formula below.
absSum=ㅣ x+y+z ㅣ
When the absSum goes over 30, the clock is deactivated, and the ‘Label’ on the lower side show the sums. After many tests, in order to detect a fall, an absSum referential value is set.

Figure 8. App Inventor block coding for accelerometer
Afterwards when the fall is detected, the fall is informed along with the location of the fall victim to a designated number.
Utilization of Pressure Sensors to Count Steps
Materials: Arduino uno board, FSR, breadboard, resistance(200Ω)
Process: On the left side, the Arduino 5V pin is connected to one lead of FSR directly and then the other side lead of FSR connected to one lead of 200Ω Resistor. The other lead of 200Ω Resistor is connected to the GND pin of Arduino. Another wire is connected from the point between FSR and 200Ω Resistor to Arduino A0 pin as shown in Figure 9.
Every 0.1 seconds the FSR’s resistance value is checked and the numbers are coded to be uploaded on the serial monitor. The FSR is pressed with the hands to check how the resistance values change. In this fashion the coding to count steps is done.
Figure 9. Arduino FSR walk_count
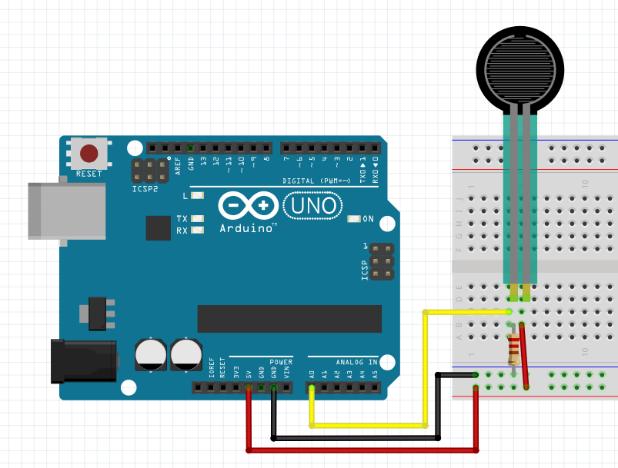
Table 1. arduino code for fsr sensor read
void setup() {
Serial.begin(9600); }
void loop() { int fsr=analogRead(A0);
Serial.println(fsr); delay(100); }
Utilization of Acceleration Sensors to Detect the Direction of Falls
Materials: Arduino Uno, 3-axis Accelerometer
Process: The Arduino supplies the electric power to the accelerometer sensor as shown in figure 10. The A1, A2, A3 pins are used for the signal input ports for each axis of the accelerometer sensor.
Every 0.1 seconds the 3 axis values are measured. (x axis is roll, or right and left movement, y axis is pitch, or up and down movement and z axis is for yaw). Every 0.1 seconds the 3 input values of these axes are checked, and the numbers are coded to be uploaded on the serial monitor. These numbers are checked to see how they change according to the direction of falls.
Figure 10. ESP32 FSR_accelometer_direction_Connections


Figure 11. Actual FSR connected to Arduino Uno
Table 2. Arduino code for accelerometer value signal acquisition
void setup() {
Serial.begin(9600); } int x; int y; int z; void loop() { x=analogRead (A1); y=analogRead (A2); z=analogRead (A3); Serial.print (x); Serial.print (","); Serial.print (y); Serial.print (","); Serial.println (z); delay(100);
Production of Fall Detection Shoes Using ESP32 WIFI
Materials: ESP32 board, smartphone, Blynk app, FSR, 3 axis accelerometer, shoes
Process: The FSR is connected to an ESP32 board by the 34 pin. The 3 axis accelerometer is connected to it by the 35 pin. The values of both are checked every 0.1 Seconds. The Blynk app is run on the smartphone. A new project on it called ‘Impact_calculation is created’ and ESP32 is picked as the board. An auth token will be emailed. For the two value displays made on the widget box, the first Value Display designates virtual pin V2 and the second Value Display designates virtual pin V3.
Using the Arduino IDE software, a library from the Blynk site is downloaded and added. This has samples that can be used on the ESP32 board. Of these, the ESP32_WIFI (the sample code) can be selected. When creating a new project on Blynk, with the new auth token, password codes can be added with wifi nearby.
After checking the FSR value on the 34 pin, the value is put into the Blynk virtual pin V2. After checking the Y axis value of the 3 axis accelerometer, the FSR value on 34 pin is inserted into the Blynk virtual pin V3. After checking the input values, a threshold number is found and the algorithm is finished.
Table 3. Arduino code for ESP32_Blynk
#define BLYNK_PRINT Serial #include <WiFi.h> #include <WiFiClient.h> #include <BlynkSimpleEsp32.h>
// Auth Token char auth[] = "8VHd_-lqT9pgBjzjFC-aeo5LjhUph315";
// Your WiFi credentials. char ssid[] = "----------"; char pass[] = "---------";
int y; int fsr; int fsr_count;
WidgetLED led1(V1); BlynkTimer timer;
void setup(){
Serial.begin(9600);
Blynk.begin(auth, ssid, pass); timer.setInterval(100L, sensorValue);
void sensorValue(){ fsr=analogRead(34); y=analogRead(35);
Blynk.virtualWrite(V2, fsr);
Blynk.virtualWrite(V3, y); }
void loop(){
Blynk.run(); timer.run();
Research Results:
Utilization of App Inventor for the Development of a Fall Detection App and Finding a Sensory Threshold for Falls
When the absSum value exceeded over 30, the clock stopped and the app deactivated to show the absSum value. As the smartphone was dropped from all sorts of angles and heights, an appropriate number was reached. The threshold value of 30 that was set initially was enough to respond to a small gesture such as taking a smartphone out of one’s pocket.
Figure 12. Fall Detection absSum=40
When the threshold was set at a 40, the response came at about the push of a hand, not nearly as strong as a fall.
Figure 13. Threshold set at 40


When the threshold was set at an 80, the response came at a very hard fall.
Figure 14. Fall Detection absSum=80
After several trials, the final absSum number was set at a 60 which is about that of a light fall.
Figure 15. Fall Detection absSum=60
Utilize the App Inventor to perfect and finish the fall detection app.
Figure 16. Fall Detection Code by App Inventor
The code above was designed so that when the x+y+z acceleration absolute value exceeds 60, an impact detection message is sent to emergency responders and family members


with the location of the fallen person . The designated numbers to which this information is sent can be set in advance.
Figure 17. Fall Detection and SMS sending
Utilization of Pressure Sensors to Count Steps: The graph in Figure 18 shows the impact detected from pressure sensors in the soles of the users’ shoes over a certain amount of time.
Figure 18. FSR value graph
The resolution of the Analog digital converter (ADC) in Arduino is 10 bit so that the code varies from 1 to 1023^21 ((2^10-1)^21). The impact from step based measurement value was setat 160. In order to count only once when the numbers exceeded 160, a separate state variable was used so that like a toggle switch the sensor switched from high to low so that steps could be counted like the code below.


Table 4. Arduino code for walk count
void setup() {
Serial.begin(9600); }
int count=0; int state=LOW; void loop() { int fsr=analogRead(A0); if(state==LOW && fsr>160){ state=HIGH; count++;
Serial.println(count); } else if(fsr<=160){ state=LOW; } delay(100);
Utilization of Acceleration Sensors to Detect the Direction of Falls:
By changing the direction of acceleration sensors the measures of the x,y,z axes (X axis is roll, or right and left movement, y axis is pitch or up and down movement and z axis is for yaw) are recorded and serial plotters were used to make graphs measuring the changes in the measures of the x, y, z axes.
Like in the graph below, when the y axis is at a perpendicular angle with the ground and the sensor, usually the stats were 331, 264, 339. When the sensor fell left and right, the x and y stats changed drastically and when it fell back and forth the z and y stats changed. Thanks to these numbers, it was possible to guess the measured values of the 3 axis accelerator. For example, if the x axis was around 330 and went to 380 while the y axis went to a 260 to a 330, it means the sensor fell to the left.
Table 5. accelerometer 3-axis fall_direction
X Y Z
Normal 331 264 339
Fall_Left 388 330 335
Fall_Right 266 330 347
Fall_Front 336 338 260
Fall_Back 332 334 398
Figure 19. Accelerometer 3-axis fall_direction graph (blue : x, red : y, green : z) 1) Normal 2) Fall_Left 3) Fall_Right 4) Fall_Front 5) Fall_Back
According to the graph, when things are normal, the y axis is around 260 and whenever it falls over it changes to 330 and over. Therefore, whenever the shoes’ y axis numbers go over, we can speculate that something has happened.

Production of Fall Detection Shoes Using ESP32 WIFI:ESP32 board, accelerating sensor and FSR:
Unlike the Arduino Uno, ESP32 board’s ADC has a 12bit resolution and it returns a number range of 0 to 4095(2^12-1)*22. This means the y axis value of the acceleration sensor had to be adjusted to 1700 in the case of a fall and the FSR to 2000 when walking . During the test the ESP32_WiFi sample had to be changed to finish the code.
Wifi_ssid, wifi_password, and auth_token typed in with the Blynk app started the wireless serial communication. Same as with other experiments for this product, the sampling time impact measurement was 0.1 seconds. In the ESP32 board, the pre FRS value was put in pin34, and in pin35 the accelerometer’s y axis value was put into. With the wifi provided from the EPS32 board and the Blynk app, the V2(FSR) measures and V3 (y axis measures) would be sent.
Figure 20. fall detect shoes
When the y axis acceleration of the shoes shows signs of a fall, the Blynk app sends a fall detect message along with an LED light to emergency responders and family members numbers. When everything is normal, the LED lights do not light up and say ‘Normal.’

Table 6. Arduino code for ESP32 fall detect
//This is only the actual part of code that are activated
if(fsr<2000) {//when shoes are taken off. fsr_count++; //count } else{//when there is pressure when walking fsr_count=0; }
//when the y axis acceleration points to a fall when walking if(fsr_count<20 && y>1700) { led1.on();
Blynk.virtualWrite(V0, "Fall Detect"); } else{ led1.off();
Blynk.virtualWrite(V0, "Normal"); //when the y axis is within normal range it is set at "Normal" } }
Figure 21. Blynk App capture

Conclusion
This paper focuses on the materialization of a product that can detect the falls of the elderly and alert them to emergency responders. In places where wireless communication works smoothly, shoes with pressure sensors and 3 axis accelerometer sensors can be used. In mountains where wireless communication is often blocked, 3 axis accelerometer sensors and satellite sensors in phones can be utilized to detect falls of the elderly and to alert emergency responders and families of them.
In order to detect falls, various tests were conducted by dropping cell phones in order to differentiate falls from impacts from everyday life. Then shoes with 3 axis accelerometers, FRS and ESP32 boards that provide wifi installed in them were devised. The critical point of impact for what would be a stepis found so that what is beyond that or a fall was detected from changes in the changes in y axis measures of the three-axis accelerometer. The fact that there was a fall would be alerted to emergency responders and family members' phones via the Blynk app. The phones would light up. Moreover, the three-axis accelerators and the sensors would deliver the changes in the x, y, z axis measurement changes which would tell which direction the person fell.
There are many merits to these shoes. The parts can be integrated into a small chip so all this equipment can be set into sneakers, indoor slippers, flip flops and bathroom slippers. Even in a place where wireless data doesn't work so well, if the user has a smartphone it's enough to alert people immediately of any falls. And as there is a distinction between impact from a fall and that of something in everyday life like the shoes falling off of the feet or falling out of a cabinet, the false recognition rate is low. All of this makes for a potentially useful product.
In the future, fall detectors with smaller chips and equipment could be developed for more comfort. With these new developments working in tandem with preventive measures mentioned in the preliminary research such as educational programs for nurses and exercise programs for the elderly, we can hope for a great reduction of falls in the future.
Bibliography
Chunjae Education Inc. “Chunja Learning Encyclopedia” under, “Super aged society.” (n.d) https://koc.chunjae.co.kr/Dic/dicDetail.do?idx=36882.
Bae Ji young, “Joongangilbo Health Media”under, “No.2 reason of Death in Elderly, Falls.”April 14th, 2017.https://jhealthmedia.joins.com/article/article_view.asp? pno=18486.
