10 minute read
Eyesight trends


Growing short-sighted watching the trend
by Elaine Morgan
Advertisement
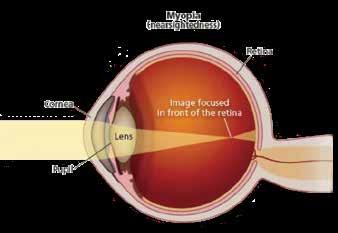
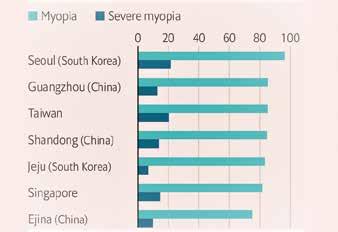
The World Health Organization (WHO) reports that myopia in East Asian countries is the highest in the worldwide. Genetics plays its part but the other obvious culprit is screen time. What other consensus is there on causes, prevention and treatment?
● 145 studies covering 2.1 million participants shows that half of the world’s population will be short-sighted (myopic) by 2050.
● That’s a seven-fold increase from 2000 to 2050.
● Recent Hong Kong research shows changes in myopia coincided with less time spent outdoors during the pandemic.
● The daily average for children fell from around 1 hour 15 minutes to around 24 minutes a day
● In parallel, screen time went up from around 2.5 hours a day to around 7 hours a day.
p Myopia in Hong Kong compared Hong Kong is a hub for research into causes and prevention and a team at the Chinese University led by Prof Jason Yam has warned about the effect of restricted outdoor activities and intensive near work on myopia progression in school children during the pandemic. Their recent study1 shows the effects of behavioural and lifestyle changes during the pandemic on children’s vision was explored.
Seeing the light
All participants were part of the Hong Kong Children Eye Study (HKCES), an ongoing study of eye conditions. They had been monitored for around three years before the findings were published. The team’s work shows that a lack of natural light and outdoor activity contributes to short-sightedness, and given present-day habits, even when people are outdoors, they are often staring at a screen.2 The researchers strongly recommend increasing schools’ outdoor curricular activities by government agencies, pointing to the mandatory outdoor time implemented by education authorities in mainland China and Taiwan as part of myopia prevention programmes.
Worldwide rise
Australia Australian researchers compared Chinese schoolchildren aged 7 in Sydney with those of the same age and ethnicity in Singapore. The incidence of myopia was about ten times greater in the Singaporean Chinese children. They were exposed to 75% less sunlight on average per week than the Australian Chinese children.
Mainland China In mainland China, over half of under 18s were shortsighted in 2018 according to official statistics. Rates are rising alarmingly— especially amongst students. By August 2020, China’s Ministry of Education reported that the rate of myopia had increased 11.5% in the first six months of the year alone. Researchers had found by then that in 123,535 children, the prevalence of myopia increased 1.4 to 3 times compared with the previous 5 years.
US Between the 1970s to the early 2000s, cases of myopia almost doubled in the US while over 33% of US parents with a child under 12 say their child began interacting with a smartphone before the age of 5, according to Pew, a US research company.
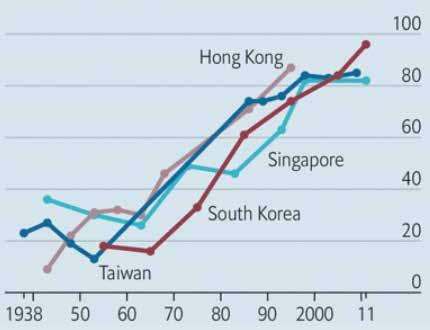
South Korea In parts of Asia, the rise has been even more dramatic, with a recent survey finding that as many as 96% of teenagers in South Korea are short-sighted.
Singapore, Germany and Japan The rate among teens in Singapore and Japan is around 8090%, similar to China. German, Singaporean and Japanese eye specialists analyzing data from of 120,643 children and concluded that the covid-19 pandemic may be causing rates of myopia to spiral.
Europe The prevalence of myopia also increased throughout Europe in recent decades and reached 45–50% in the 25–29years old age group. Netherlands One peer-reviewed study of 5,000 Dutch youngsters found a strong link between increased computer use and myopia.
UK Rates of short-sightedness have risen by nearly 50% in 30 years. A study of more than 100,000 Britons found one in five born during World War II had the condition, with two-thirds of cases diagnosed in childhood. rose to nearly a third in those born in the late 1960s, with half of cases occurring in adulthood.
Ireland Another study of 418 children in Ireland revealed that smartphone usage was also associated with myopia.

Sources
• ledsmagazine.com/leds-ssl-design/networks-controls/article/16695507/tunable-led-lightingpromises-to-reduce-the-incidence-of-myopia-magazine • scio.gov.cn/32344/32345/39620/40347/40352/Document/1653995/1653995.htm • radiichina.com/myopia/ • jamanetwork.com/journals/jamaophthalmology/fullarticle/2774808 • dailymail.co.uk/news/article-8595537/Doctors-warn-spike-short-sightedness-causedstaring-screens-relieve-boredom.html • pewresearch.org/internet/2020/07/28/parenting-children-in-the-age-of-screens/ • Grzybowski, A, Kanclerz, P, Tsubota, K, et al. A review on the epidemiology of myopia in school children worldwide. BMC Ophthalmol 2020; 20: 27. https://pubmed.ncbi.nlm.nih. gov/31937276/ • dailymail.co.uk/health/article-10413629/Rates-short-sightedness-UK-skyrocketed-nearly-50three-decades.html
Good news from Hong Kong
Prof Carly Lam of the Hong Kong Polytechnic University has some good news recently for everyone concerned about shortsightedness. In the past few years, several new innovative designs of lenses have emerged that have shown to be effective in slowing myopia progression. These include the MyoVision Lens by Zeiss, the MyopiLux by Essilor, and the DISC lens by Hoya, as developed by Prof Lam. She then went on, with her colleagues, to invent the DIMS lens for glasses.
After working with schoolchildren in rural Panyu in southern mainland China, she found they developed myopia about two to three years later than urban Hong Kong city schoolchildren. In another of her studies, a group of young Chinese adults originally living in farming villages developed myopia only after two years of close work in factory environments. The greatest increase in myopia was found in the group of workers performing quality control of products at less than 18 cm distance for eight hours per day. Two important variables were identified: the hours of near work and the working distance required. Longer hours and shorter distances were associated with higher myopia progression.
Prof Lam writes, “From these studies, it was found that Chinese people can have error-free vision; and myopia is not a genetic inevitability…environmental factors have a strong influence on the development of myopia in Chinese eyes.” Since then, Prof Lam has made great strides in her work. She has been central to DISC contact lens research at the Hong Kong Polytechnic University with her colleague Prof To Chi-ho. The lenses are based on a concept called “optical defocus” which incorporates concentric rings within each lens that have different levels of distance correction.4 They were shown to reduce the speed of myopia progression. The team, which is developing the concept further, patented it in Australia, mainland China and various European countries.5
The same technology has now been incorporated by Prof Lam and her team into DIMS lenses for spectacles. DIMS stands for Defocus Incorporated Multiple Segments. The lenses are comprised of a central optical zone for correcting refractive error and multiple defocus segments evenly surrounding the central zone to control myopia progression. A report6 on a two-year clinical trial of DIMS showed that myopia progressed on average 59% less than expected when wearing glasses with DIMS lenses than 20% of the children participating did not show any progression at all. The technology, which has now been tested over a total of six years has won three top awards in its field and is being adopted by major lens manufacturers.

Corrective glasses for myopia are not cheap, costing at least HK$2,000 to HK$4,000 a pair depending on types and functions, and prescriptions in most children change regularly, so research that leads to a slowing of progression is very welcome, especially as government subsidies are rather limited. Under the Comprehensive Social Security Assistance scheme, a special grant up to a maximum of HK$500 within 24 months will be made to cover the cost of glasses for children in need.
In Australia
Researchers estimate that children need to spend around three hours per day under light levels of at least 10,000 lux to be protected against myopia. This is about the level experienced by someone under a shady tree, wearing sunglasses, on a bright summer day. A welllit office or classroom is usually 500-1,000 lux.8
In the US The BLINK (Bifocal Lenses In Nearsighted Kids) study9 demonstrated the effect of multifocal lenses in comparison to regular single vision lenses in slowing myopia. This “distance-center focused” design to be effective in slowing myopia by nearly 50%.
American Academy of Pediatrics Recommendations
Screen breaks 15
In Hong Kong Studies10 by the CUHK team are looking at:
• Nutrition and food and myopia • Secondhand smoking and myopia • Genetic and environmental interactions in myopia • Developing a strategy for low concentration atropine usage for myopia control
In mainland China and France
Investigations into levels and types of indoor lighting are being made as predictors of the incidence and progression of myopia. As LED lights have become more common and a study based in mainland China showed the prevalence of myopia in young teenagers was associated more with such lighting than with others.11 Other researchers have shown that over a year, children who wore violet light transmitting contact lenses had significantly less axial length elongation compared to those wearing violet light blocking eyeglasses.12 Different approaches have included increasing room illumination, using incandescent instead of “blue” LED lighting and using CCT colour temperature controllable LED lighting.13
In Taiwan
Millions of Taiwanese primary pupils were studied from 2001-2015. In 2010 the government instituted a programme called “Tian-Tian Outdoor 120”, encouraging outdoor activity at school for two hours a day. Rates of myopia fell, slowly but steadily, from 49.4% in 2012 to 46.1% in 2015—reversing a long-term trend.14 Suffice it to say that the problem of myopia is not going to disappear. In the meantime, here is some simple advice: ● 2-5-year-olds: maximum an hour per day of non-educational screen time ● 5-17-year-olds: maximum two hours per day, except for homework ● All ages: 20 second breaks looking at something at least 10m away every 20 minutes
2000, this was 1406 million (22.9% of the global population; uncertainty interval, 932e1932 million [15.2%e31.5%]), Good reading distances with sufficient lighting: increasing to 1950 million in 2010 (28.3% of the global ● 30 cm for books population; 1422e2543 million [20.6%e36.9%]). This is projected to increase to 2620 million in 2020 (34.0% of the global population; uncertainty interval, 1976e3366 million ● ● 40 cm for tablets 50 cm for desktop or laptop computers [26.2%e42.6%]),to3361millionby2030(39.9%oftheglobal population; uncertainty interval, 2578e4217 million [32.3%e 47.5%]), to 4089 million by 2040 (45.2% of the global population; uncertainty interval, 3145e5128 million [38.1%e 52.1%]), and to 4758 million by 2050 (49.8% of the global population; uncertainty interval, 3620e6056 million [43.4%e 55.7%]).
Regional differences are evident throughout the projection period,asshownin Table1.Thehigh-incomecountriesofAsiaPacific begin with a significantly higher prevalence of myopia thananyotherregion.EastAsia,SoutheastAsia,andthehighincomecountriesofNorthAmericaclosethegaptosomeextent by2050becauseofacombinationofceilingeffectsinsomeage groups,prevalencedistributionacrossagegroups,andchanging agedemographics.
Figure2 showsourestimatesofthetotalnumberofpeoplewith highmyopiaglobally.Thiswas163millionin2000(2.7%ofthe globalpopulation;uncertaintyinterval,86e387million[1.4%e 6.3%]),increasingto277millionin2010(4.0%oftheglobal population;uncertaintyinterval,153e589million[2.2%e8.6%]). Thisisprojectedtoincreaseto399millionin2020(5.2%ofthe globalpopulation;uncertaintyinterval,233e815million[3.1%e 10.3%]),to517millionby2030(6.1%oftheglobalpopulation; uncertainty interval, 298e1082 million [3.7%e12.2%]), to 696 million by 2040 (7.7% of the global population; uncertainty interval,381e1518million[4.6%e15.4%]),andto938million by 2050 (9.8% of the global population; uncertainty interval, 479e2105 [5.7%e19.4%]). Regional differences are evident throughouttheprojectionperiod,asshownin Table1.
Figure3 showsthedistributionofpeoplewithmyopiaand prevalence ofmyopiaacrossage groups. In2000,thegreatest
Read more
1. aaojournal.org/article/S0161-6420%2816%2900025-7/fulltext 2. bjo.bmj.com/content/early/2021/07/15/bjophthalmol-2021-319307 3. ibid 4. dw.com/en/covid-19-and-eyesight-myopia-on-the-rise-during-lockdown/a-56301421 5. pubmed.ncbi.nlm.nih.gov/24169657/ 6. polyu.edu.hk/cpa/milestones/en/201803/knowledge_sharing/bring_myopia_controlling_contact_ lens_to_life/index.html 7. bjo.bmj.com/content/bjophthalmol/early/2021/03/17/bjophthalmol-2020-317664.full.pdf 8. nature.com/articles/519276a 9. pubmed.ncbi.nlm.nih.gov/28737608/ 10. bjo.bmj.com/content/early/2021/07/15/bjophthalmol-2021-319307 11. journals.sagepub.com/doi/full/10.1177/1120672121998960 12. pubmed.ncbi.nlm.nih.gov/27918775/ 13. ncbi.nlm.nih.gov/pmc/articles/PMC5233810/ 14. economist.com/leaders/2022/06/09/short-sightedness-has-become-an-epidemic 15. medicalnewstoday.com/articles/321536#how-to-use-the-20-20-20-rule
Figure2. Graphshowingthenumberofpeopleestimatedtohavemyopiaandhighmyopiaforeachdecadefrom2000through2050.Errorbarsrepresent the95%confidenceintervals. numbersofpeoplewithmyopiawerebetween10and39years of age. However, our projections suggest that through both cohortandageeffectsthisdistributionwillspreadby2050,with largenumbersofpeoplewithmyopiafrom10yearsofageall thewaythroughto79yearsofage. Table1.PrevalenceofMyopiaEstimatedforEachGlobalBurden ofDiseaseRegionbetween2000and2050 Region
Myopia: growth to 2050
Prevalence(%)inEachDecade 2000 2010 2020 2030 2040 2050 AndeanLatinAmerica 15.2 20.5 28.1 36.2 44.0 50.7 Asia-Pacific,highincome 46.1 48.8 53.4 58.0 62.5 66.4 Australasia 19.7 27.3 36.0 43.8 50.2 55.1 Caribbean 15.7 21.0 29.0 37.4 45.0 51.7 CentralAfrica 5.1 7.0 9.8 14.1 20.4 27.9 CentralAsia 11.2 17.0 24.3 32.9 41.1 47.4 CentralEurope 20.5 27.1 34.6 41.8 48.9 54.1 CentralLatinAmerica 22.1 27.3 34.2 41.6 48.9 54.9 EastAfrica 3.2 4.9 8.4 12.3 17.1 22.7 EastAsia 38.8 47.0 51.6 56.9 61.4 65.3 EasternEurope 18.0 25.0 32.2 38.9 45.9 50.4 NorthAfricaandMiddleEast 14.6 23.3 30.5 38.8 46.3 52.2 NorthAmerica,highincome 28.3 34.5 42.1 48.5 54.0 58.4 Oceania 5.0 6.7 9.1 12.5 17.4 23.8 SouthAsia 14.4 20.2 28.6 38.0 46.2 53.0 SoutheastAsia 33.8 39.3 46.1 52.4 57.6 62.0 SouthernAfrica 5.1 8.0 12.1 17.5 23.4 30.2 SouthernLatinAmerica 15.6 22.9 32.4 40.7 47.7 53.4 TropicalLatinAmerica 14.5 20.1 27.7 35.9 43.9 50.7 WestAfrica 5.2 7.0 9.6 13.6 19.7 26.8 WesternEurope 21.9 28.5 36.7 44.5 51.0 56.2 Global 22.9 28.3 33.9 39.9 45.2 49.8 Numbers and uncertainty are provided in the Supplemental Material (availableat www.aaojournal.org). 1039


