3 minute read
Exercise 2: Seasonal calendar


In this exercise, participants make a seasonal calendar indicating important events in the year – particularly periods of stress due to natural or human-made hazards – and discuss how the frequency, intensity and timing of the hazards have changed. The exercise objectives are:
To understand the main community activities and events
To identify periods of stress, hazard, disease, hunger, debt and vulnerability
To analyse changes in seasonal activities and events and their links to climate change
This exercise complements the knowledge developed in the hazard map exercise, and develops additional local knowledge to consider alongside the scientific and policy knowledge developed in the climate change and disaster risk portion of Module 1.
Facilitation
As in the hazard map exercise, facilitators provide pencils or markers in multiple colours and sheets of paper at least 80 cm x 100 cm in size. Facilitators prepare these sheets in advance as tables with the months of the year across the top, and a column down the side for listing community events or activities. Facilitators explain how to develop a seasonal calendar to show key events and activities that occur during the year.
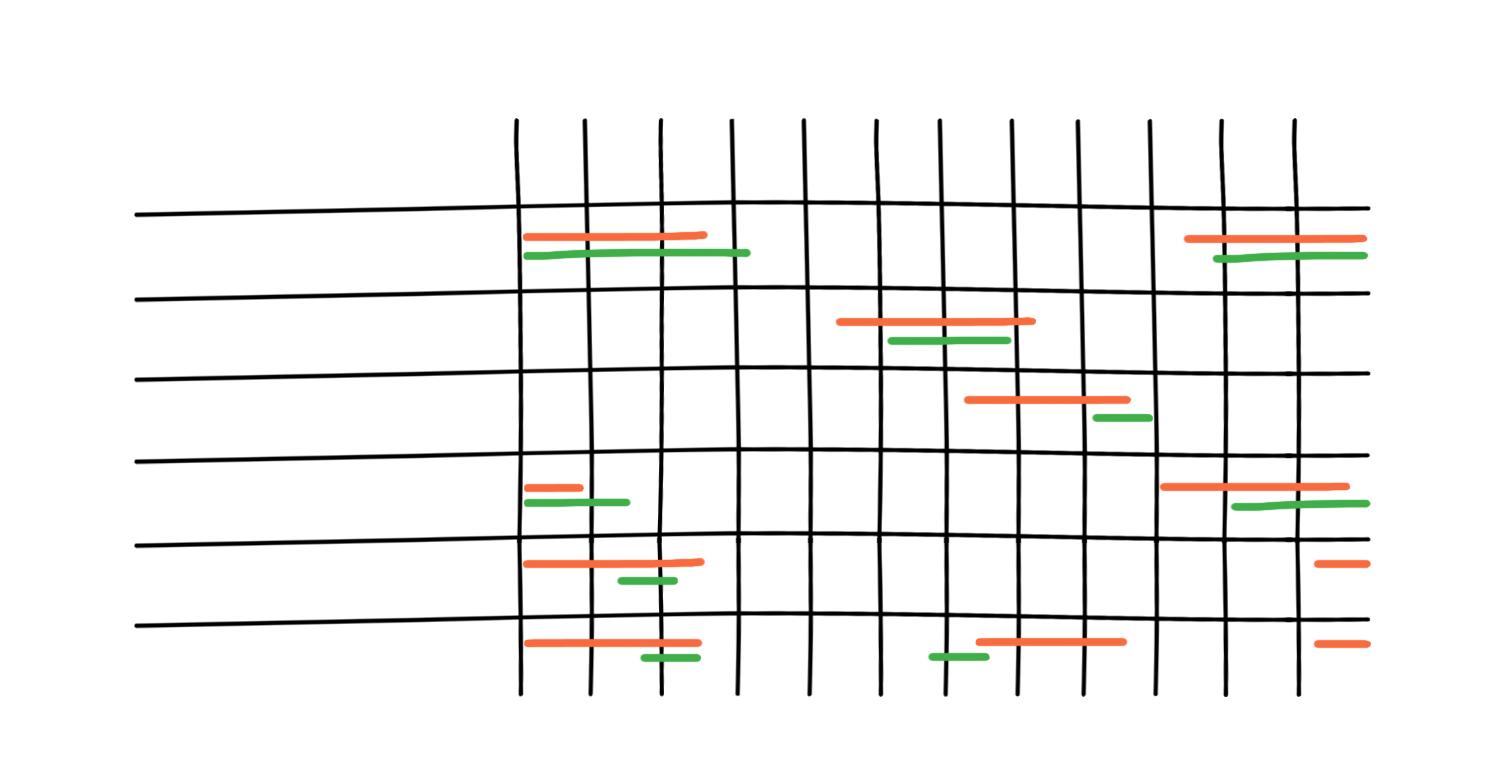
Sample seasonal calendar
EVENTS Rainy season Hot season
Wildfires Sowing + weeding time Food shortage Human diseases
J F M A M J J A S O N D
Red = now Green = 20–30 years ago
The participants list significant seasons, events or conditions down the left-most column. Among the common items to consider for placement on the list are:
Rainy and dry seasons
Crop seasons – clearing, burning, planting, weeding and harvest
Livestock keeping and fishing seasons
Typical timing of weather or climate hazards such as typhoons or cyclones, floods, drought and wildfires
Periods of stress: food scarcity, water shortage, diseases, pests
Hunting and firewood collection periods
Times of labour migration
Periods of potential financial stress – taxes, school fees, holiday expenses
Important holidays and festivals
As the participants list each event, they mark the timing of the events by drawing lines through the box under the appropriate months, working from left to right for each event before moving on to the next event. Where the timing of events has changed over time, the participants can distinguish the time frames by marking the table with different coloured pencils or markers to indicate the changes in timing. In this way, the calendar shows shifts in the rainy season, for example, or an increase in dry periods. This approach is effective when some of the participants can remember an earlier era or when the relevant local knowledge of the past has been preserved.
For more ideas on common seasonal events in communities, consult Annex IV.
Try to balance the time spent preparing the seasonal calendar with the important discussion of the timing of events.
Discussion
When the participants have completed their calendars, the facilitators bring together the female and male groups (and minorities if they have a separate session) into a single discussion of the respective results. The following questions can guide a discussion of the seasonal calendar:
Where do the calendars agree, and where do they differ?
What are the differences in the timing of seasons and events as compared to 20 or 30 years ago?
What could be the reasons for these changes?
Plan for one hour of preparation, 1–1.5 hours for the concurrent seasonal calendar exercises and one hour for discussion.
Remember to write up the results. Annex III has templates that may be helpful.
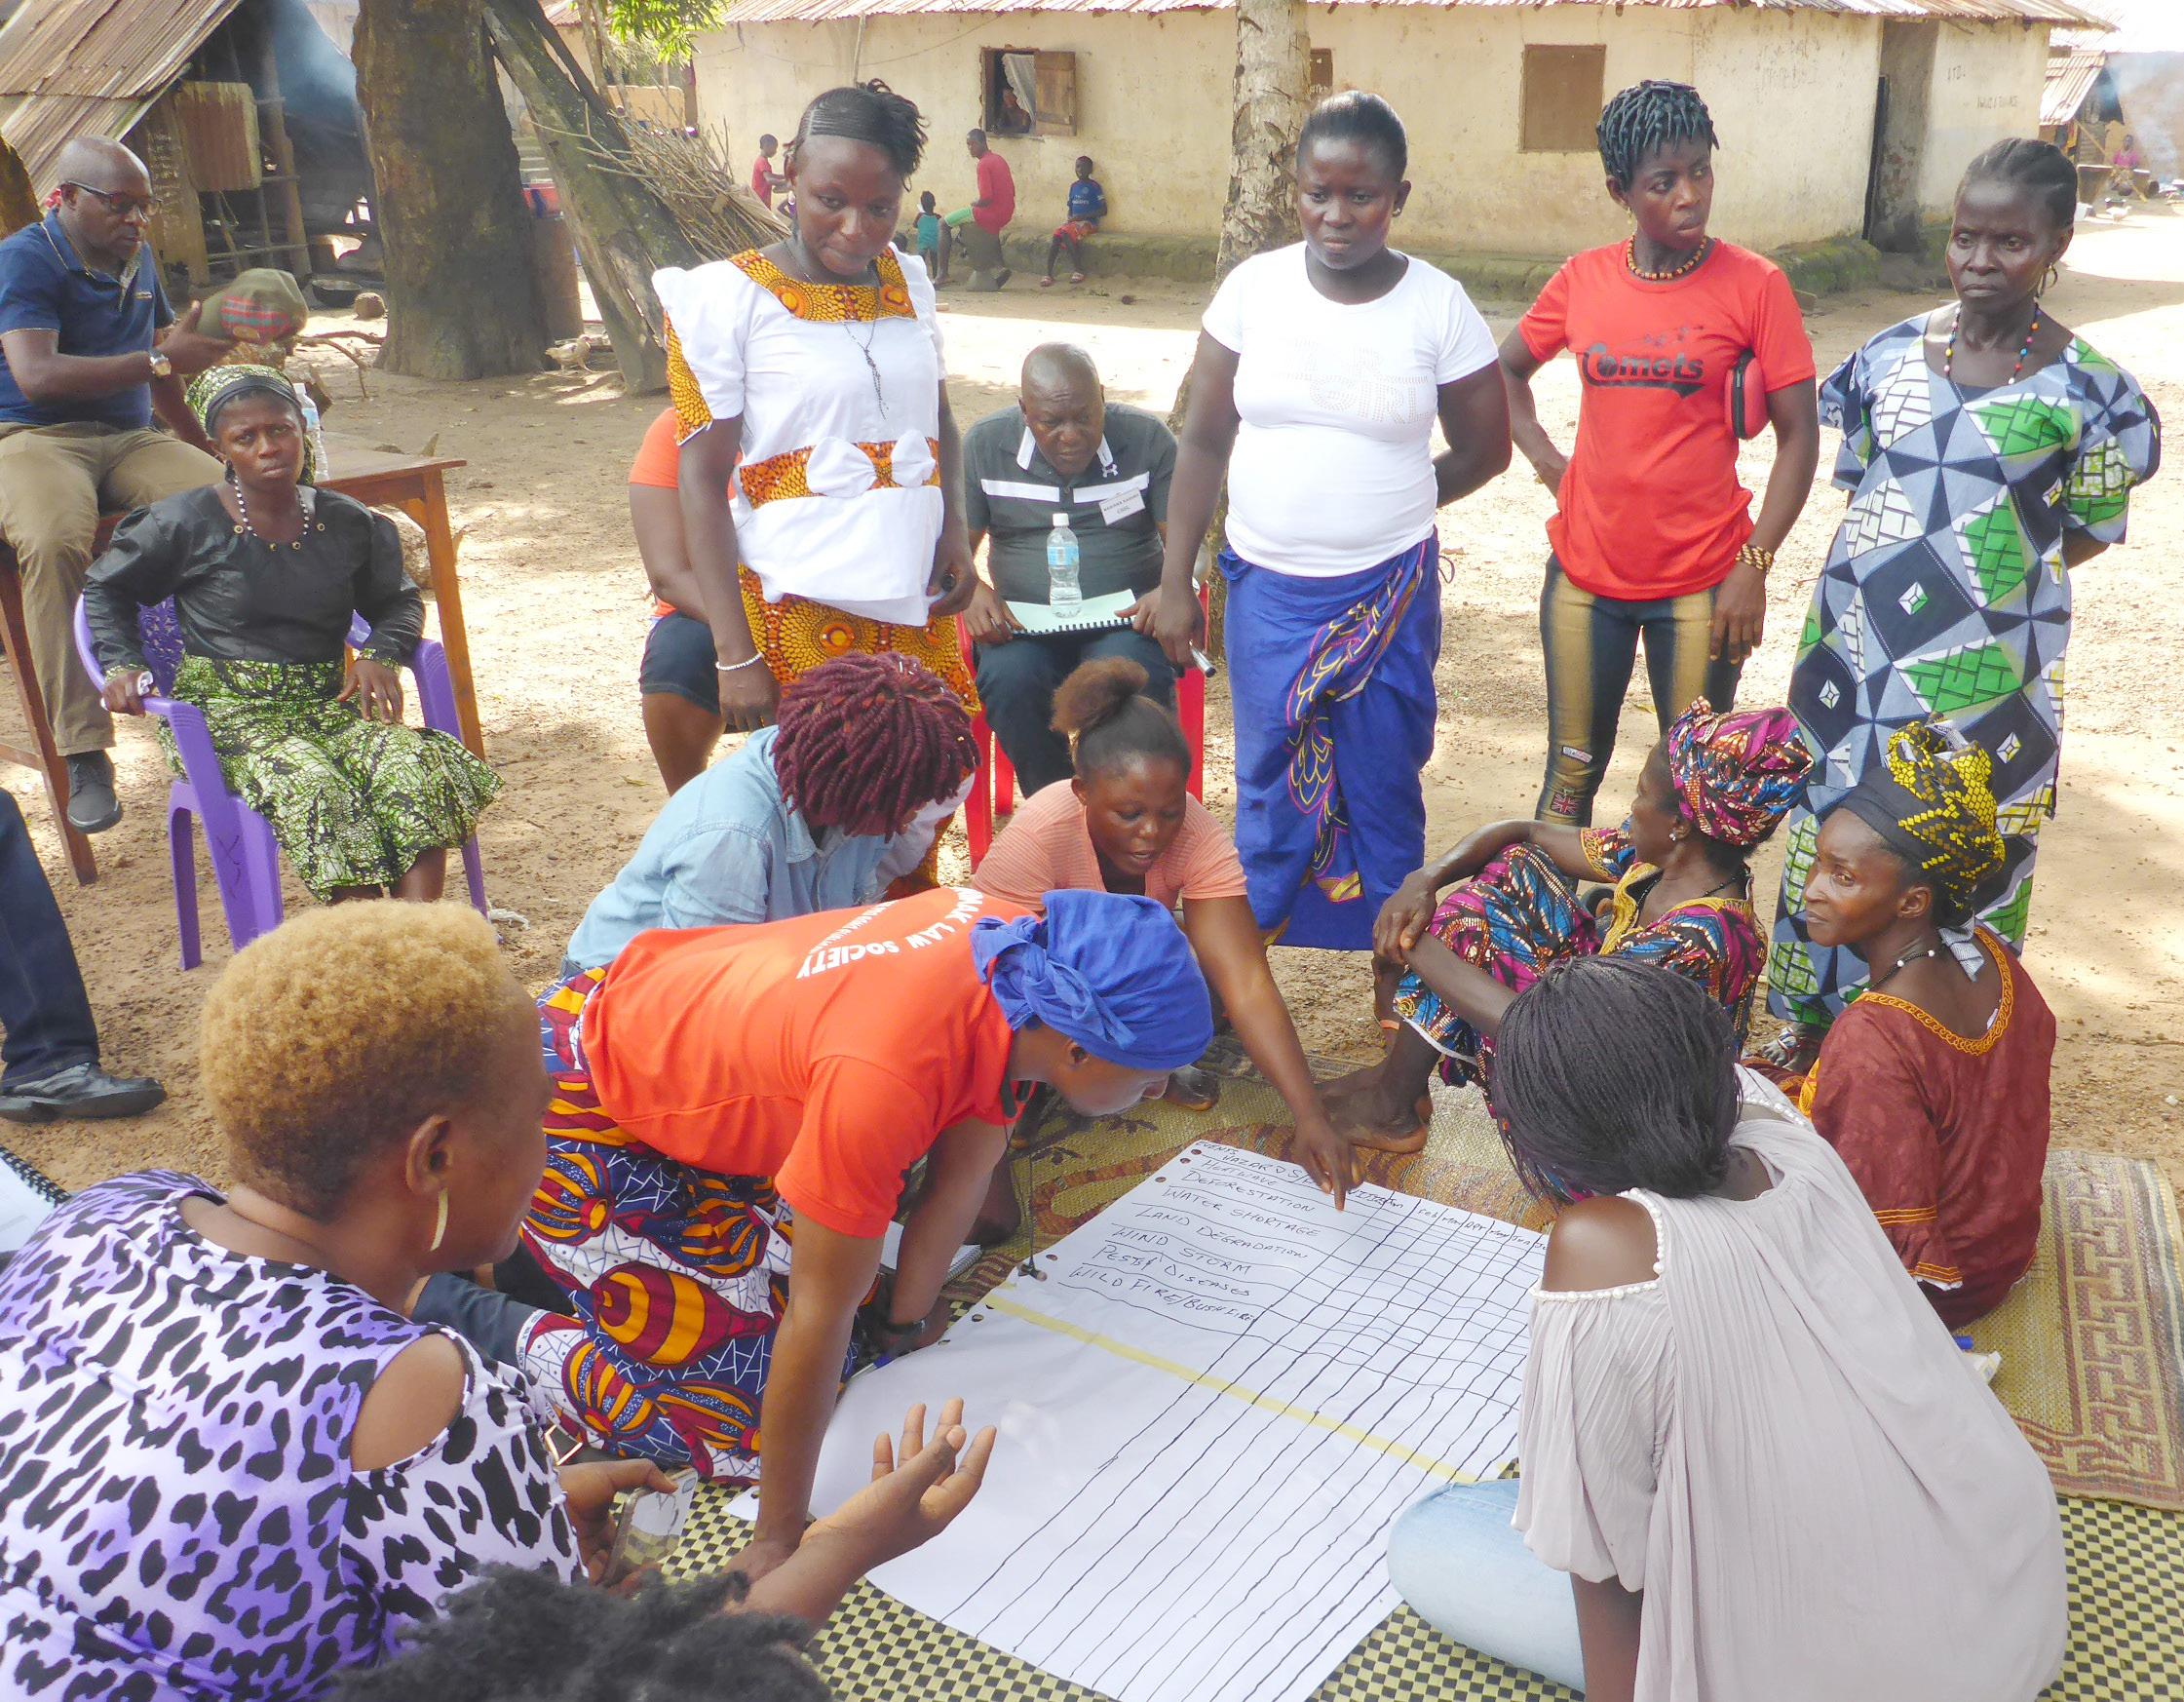
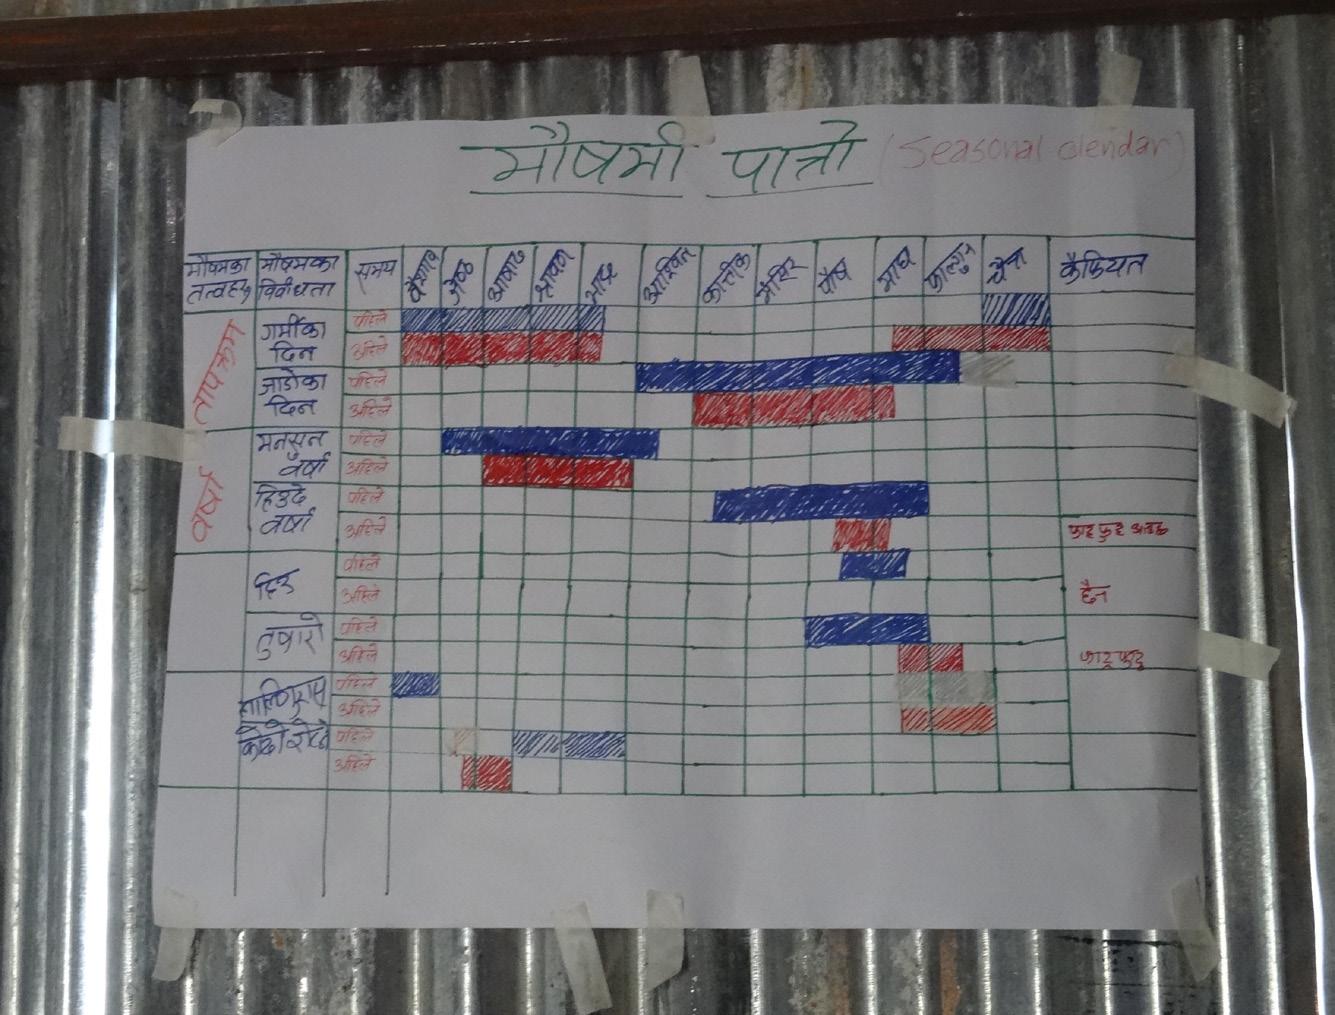
Example of seasonal calendar, Nepal Women’s group preparing seasonal calendar, Sierra Leone