
1235 South Clark Street • Suite 305 • Arlington, VA 22202 800-7-ASTHMA (800-727-8462) • aafa.org The Most Challenging Places to Live with Asthma
2023 Asthma Capitals
Available online at asthmacapitals.com
Suggested Citation
Asthma and Allergy Foundation of America, (2023). 2023 Asthma Capitals. Retrieved from asthmacapitals.com.
Copyright © 2023 by the Asthma and Allergy Foundation of America (AAFA). This material may be reproduced unaltered in whole or in part without fees or permission provided that acknowledgment is given to the Asthma and Allergy Foundation of America. Content may not be reprinted, translated, or distributed electronically without prior permission in writing from AAFA. For permission, contact info@aafa.org.
Media Inquiries
For media and related inquiries, contact media@aafa.org
About the Asthma and Allergy Foundation of America (AAFA)
Founded in 1953, AAFA is the oldest and largest non-profit patient organization dedicated to saving lives and reducing the burden of disease for people with asthma, allergies, and related conditions through research, education, advocacy, and support. AAFA offers extensive support for individuals and families affected by asthma and allergic diseases, such as food allergies and atopic dermatitis (eczema). Through its online patient support communities, network of local chapters, and affiliated support groups, AAFA empowers patients and their families by providing practical, evidence-based information and community programs and services. AAFA is the only asthma and allergy patient advocacy group that is certified to meet the standards of excellence set by the National Health Council. For more information, visit aafa.org
About This Report
The AAFA publishes the Asthma Capitals™ report to raise awareness about the nationwide impacts of asthma. The report analyzes data from across the continental United States and ranks the 100 largest cities where it is challenging to live with asthma. The report ranks cities by the most critical of health outcomes – asthma prevalence, emergency department visits due to asthma, and asthma mortality. The outcomes are not weighted equally. The report also examines asthma risk factors that influence the outcomes.
Acknowledgements
The 2023 Asthma Capitals report is an independent research project of the Asthma and Allergy Foundation of America and made possible by support from Sanofi and Regeneron.
AAFA also thanks Amgen, PCMA Foundation, and Komodo Health for additional support and funding for data used in this report.
The views and opinions expressed in this report are those of the AAFA authors and do not necessarily reflect the policies or positions of other individuals, organizations, or companies.
AAFA would like to thank Dr. Mitchell Grayson for serving as medical research advisor on the report’s methodology. We are grateful to our advocates and partners who shared their personal stories for this report. And lastly, this comprehensive report would not be possible without the dedication of the AAFA staff responsible for this report: Hannah Jaffee, Melanie Carver, Sanaz Eftekhari, Lynne Bosma, Tanya Bumgardner, Nicole Gaghan, Kathy Przywara, Kimm Rafferty, and Andy Spears.
2
©2023 Asthma and Allergy Foundation of America
asthmacapitals.com
Table of Contents Introduction 4 September Is a Peak Month for Asthma — Leading to an Annual Epidemic . . . . . . . . . . . . . . . .5 Map of the Top 20 Most Challenging Places to Live with Asthma in 2023 . . . . . . . . . . . . . . . . . .6 2023 Asthma Capitals Full Ranking . . . . . . . . . . . . . . . . . . . . . . . . . . . . . . . . . . . . . . . . . . . 7 Asthma Health Outcomes. . . . . . . . . . . . . . . . . . . . . . . . . . . . . . . . . . . . . . . . . . . . . . . . .11 Estimated Asthma Prevalence 11 Emergency Department Visits 12 Asthma-Related Mortality . . . . . . . . . . . . . . . . . . . . . . . . . . . . . . . . . . . . . . . . . . . . . 13 Spotlight: Asthma Control . . . . . . . . . . . . . . . . . . . . . . . . . . . . . . . . . . . . . . . . . . . . . 14 Risk Factors That Can Worsen Asthma or Influence Asthma Rates . . . . . . . . . . . . . . . . . . . . . 15 Poverty 16 Lack of Health Insurance 17 Exposure to Air Pollution. . . . . . . . . . . . . . . . . . . . . . . . . . . . . . . . . . . . . . . . . . . . . . . 18 Spotlight: Wildfires . . . . . . . . . . . . . . . . . . . . . . . . . . . . . . . . . . . . . . . . . . . . . . . . . . 19 Spotlight: Indoor Air Quality and Healthy Buildings 21 Pollen Allergy 22 Smoking Cigarettes, Cigars, Vapes 23 Asthma Quick-Relief Medicine Use . . . . . . . . . . . . . . . . . . . . . . . . . . . . . . . . . . . . . . . 24 Asthma Control Medicine Use . . . . . . . . . . . . . . . . . . . . . . . . . . . . . . . . . . . . . . . . . . 25 Access to Specialists 26 Health Equity 27 Steps to Improve Asthma Outcomes 31 Taking Action Through Advocacy and Policy 36 How to Advocate for People with Asthma to Lawmakers . . . . . . . . . . . . . . . . . . . . . . . . . 37 Tips for Communicating with Legislators and Their Staff . . . . . . . . . . . . . . . . . . . . . . . . . 39 Sample Letter to Your Legislator 40 Methodology 41 Resources 42 References 43 ©2023 Asthma and Allergy Foundation of America 3 asthmacapitals.com
Introduction
Knowing what puts someone at higher risk for asthma is an important part of understanding and treating the disease. The Asthma and Allergy Foundation of America’s (AAFA) 2023 Asthma Capitals report looks at how location may influence asthma in cities across the contiguous U.S.
The Asthma Capitals™ report ranks 100 cities in the continental U.S. based on these health outcomes: asthma prevalence, emergency department (ED) visits for asthma, and deaths due to asthma. The report also discusses risk factors that contribute to these outcomes: poverty, air quality, access to specialist medical care, pollen allergy, medicine use, tobacco policies, and lack of health insurance. The data in this report includes the 100 most populated U.S. cities (metro areas), and does not include information from Alaska, Hawaii, Puerto Rico, or tribal nations. The residents of these areas are greatly affected by asthma, but more data is needed to get a better picture of the impact.
In addition to the annual rankings, this year’s report includes three additional pieces:
• A focus on health equity and the work AAFA is supporting to address asthma disparities in local communities.
• Steps that various stakeholders can take to improve asthma outcomes in their communities.
• A toolkit to help advocates champion better policies for people living with asthma.
Each September, doctors treat more people for asthma episodes and attacks and asthma ED visits and hospitalizations increase.1 The third week of the month—known as Asthma Peak Week—is often the worst.
September is the perfect storm for people with asthma and allergies, especially children. Ragweed, the most common fall pollen allergy, peaks in September throughout much of the United States. Mold counts go up as leaves begin to collect outside. Children return to school and are exposed to respiratory illnesses and buildings filled with asthma triggers. Flu and cold season begins as well. With these events all happening at the same time, people with asthma are exposed to a lot of asthma triggers. This can make it hard to keep airway inflammation under control.
Risk factors such as poverty, exposure to pollutants, and access to health care play an important role in asthma outcomes. But these aren’t the only reasons a person may experience asthma exacerbations. Where people live may influence whether or not they have this common chronic lung disease and how successfully they can manage it.
It is AAFA’s goal that the 2023 Asthma Capitals report inspires action. Reduced asthma rates and deaths are possible. And this report highlights where we can focus our efforts for healthier environments and communities. ©2023 Asthma and Allergy Foundation of America
4
asthmacapitals.com
September Is a Peak Month for Asthma — Leading to an Annual Epidemic
• There is an “epidemic” of asthma-related hospital stays in September, especially for children. It coincides with the return to school. In fact, the third week of September is usually the worst (known as “Asthma Peak Week”). More people stay in the hospital for asthma shortly after school starts than at any other time of the year. Around 25% of asthma-related hospital stays in children happen in September.2 The number of asthma hospital stays peaks for school-age children first. Then preschool children, and then adults.3
• Kids tend to get sick when they go back to school. Crowded school classrooms are hotbeds of germs. Cold and flu season tends to start the same time the school year starts. (Flu season can occur later in the fall or winter and extend into the spring.) Kids catch respiratory infections at school, get sick, and then expose others in the home to the illness. These infections then set off serious asthma attacks for some people. While there is no vaccine for the common cold, there are vaccines for the flu, COVID-19, pneumococcal pneumonia, and RSV. Everyone over the age of 6 months should get a flu vaccine each year. Talk with your doctor about staying up to date on other vaccinations to protect you and your family from respiratory infections.
• People who stay in the hospital for asthma often have a viral infection. Serious asthma attacks are often related to respiratory tract infections, especially rhinovirus. Rhinovirus is the main cause of the common cold. Viral infections cause up to half of asthma attacks in adults and 80% of asthma attacks in children.2
• Kids are exposed to a lot of allergens and irritants when they go back to school. Children are often exposed to mold, pests, pollen, animal allergens, and other airway irritants in schools. Children’s clothes or belongings can then carry these allergens, like animal dander, from school to home. Then the allergens may trigger other family members with asthma or allergies.
• Ragweed pollen season peaks in September throughout much of the United States. Ragweed grows in every state except Alaska. Pollen seasons are getting more intense every year due to climate change. Longer, hotter growing seasons stimulate plants to release more pollen. Allergens like pollen trigger asthma in people with allergic asthma. Allergic asthma is the most common type of asthma.
• Indoor and outdoor mold counts increase in some areas. Mold can be both an allergen and an airway irritant. Outdoor molds grow on decaying plant matter like fallen leaves. Indoor molds grow when the humidity levels inside increase, and air ventilation decreases. This typically happens in fall and winter months but can also be a problem year-round in some climates.
• Extreme weather or natural disasters related to climate change may occur in late summer and early fall and worsen air quality. Parts of the country may experience heat waves, wildfires, extreme thunderstorms, or hurricanes during this time. This may worsen air pollution or exposure to airborne allergens and particles, making it more challenging to control asthma. See a special spotlight on wildfires on page 19
©2023
5 asthmacapitals.com
Asthma and Allergy Foundation of America
Map of the Top 20 Most Challenging Places to Live with Asthma in 2023
These are the top 20 Asthma Capitals for 2023 based on estimated asthma prevalence, emergency department visits due to asthma, and asthma-related fatalities. The burden of asthma falls heavily in Eastern and Midwest states. The full list of top 100 cities can be found on page 7 in this report.
1. Allentown, PA
2. Lakeland, FL
3. Charleston, SC
4. Cleveland, OH
5. Detroit, MI
6. Poughkeepsie, NY
7. Richmond, VA
8. Philadelphia, PA
9. Fresno, CA
10. Rochester, NY
11. Columbus, OH
12. Baltimore, MD
13. St. Louis, MO
14. Orlando, FL
15. New York, NY
16. Harrisburg, PA
17. McAllen, TX
18. Omaha, NE
19. Dayton, OH
20. Greenville, SC
©2023 Asthma and Allergy Foundation of America
6 asthmacapitals.com
2023 Asthma Capitals™
Overall Rankings ■ Worse Than Average ▲ Average ● Better Than Average (Factors are not weighted equally. Total scores are rounded for the purposes of this chart.)
2023 Overall Ranking Overall Metropolitan Area Total Score (Avg. 61.10) Subtotal: Estimated Asthma Prevalence Subtotal: Crude Death Rate for Asthma Subtotal: ED Visits for Asthma 1 ■ Allentown, PA 100.00 ■ ▲ ■ 2 ■ Lakeland, FL 93.65 ■ ▲ ■ 3 ■ Charleston, SC 92.89 ■ ▲ ■ 4 ■ Cleveland, OH 92.69 ■ ■ ■ 5 ■ Detroit, MI 91.48 ■ ■ ▲ 6 ■ Poughkeepsie, NY 88.96 ■ ▲ ● 7 ■ Richmond, VA 87.66 ▲ ■ ■ 8 ■ Philadelphia, PA 86.73 ■ ■ ▲ 9 ■ Fresno, CA 86.40 ■ ■ ▲ 10 ■ Rochester, NY 80.97 ■ ▲ ▲ 11 ■ Columbus, OH 80.29 ▲ ▲ ■ 12 ■ Baltimore, MD 79.14 ▲ ■ ▲ 13 ■ St. Louis, MO 78.84 ▲ ■ ▲ 14 ■ Orlando, FL 78.67 ■ ▲ ■ 15 ■ New York, NY 77.97 ■ ■ ▲ 16 ■ Harrisburg, PA 75.46 ■ ▲ ● 17 ■ McAllen, TX 75.22 ■ ● ▲ 18 ■ Omaha, NE 74.96 ▲ ■ ▲ 19 ■ Dayton, OH 74.22 ▲ ▲ ■ 20 ■ Greenville, SC 73.75 ■ ▲ ▲ 21 ■ Spokane, WA 73.10 ■ ▲ ■ 22 ■ Cape Coral, FL 72.58 ■ ● ■ 23 ■ Albany, NY 71.88 ■ ▲ ● 24 ■ Las Vegas, NV 71.81 ▲ ▲ ■ 25 ■ Miami, FL 71.66 ■ ▲ ▲ 26 ■ New Orleans, LA 71.53 ▲ ▲ ■ 27 ■ San Antonio, TX 71.12 ▲ ▲ ■ 28 ■ Toledo, OH 71.11 ▲ ▲ ■ 29 ▲ Cincinnati, OH 70.13 ▲ ■ ■ 30 ▲ Jacksonville, FL 69.34 ▲ ▲ ■ 31 ▲ Phoenix, AZ 67.94 ■ ▲ ▲ 32 ▲ Tampa, FL 67.57 ▲ ▲ ■ ©2023 Asthma and Allergy Foundation of America 7 asthmacapitals.com
Overall Rankings ■ Worse Than Average ▲ Average ● Better Than Average
(Factors are not weighted equally. Total scores are rounded for the purposes of this chart.)
2023 Overall Ranking Overall Metropolitan Area Total Score (Avg. 61.10) Subtotal: Estimated Asthma Prevalence Subtotal: Crude Death Rate for Asthma Subtotal: ED Visits for Asthma 33 ▲ Tucson, AZ 67.57 ▲ ■ ▲ 34 ▲ Louisville, KY 67.56 ▲ ● ■ 35 ▲ Chicago, IL 67.19 ▲ ■ ▲ 36 ▲ Dallas, TX 66.81 ▲ ▲ ■ 37 ▲ Atlanta, GA 65.72 ▲ ▲ ▲ 38 ▲ Indianapolis, IN 65.21 ▲ ▲ ▲ 39 ▲ Akron, OH 65.18 ● ▲ ■ 40 ▲ Daytona Beach, FL 64.17 ▲ ▲ ▲ 41 ▲ Stockton, CA 63.59 ▲ ▲ ■ 42 ▲ Sacramento, CA 62.90 ▲ ▲ ▲ 43 ▲ Pittsburgh, PA 62.63 ▲ ▲ ▲ 44 ▲ Riverside, CA 62.55 ▲ ● ■ 45 ▲ Baton Rouge, LA 62.50 ▲ ● ▲ 46 ▲ Springfield, MA 62.44 ■ ■ ● 47 ▲ Wichita, KS 62.08 ● ▲ ■ 48 ▲ Palm Bay, FL 61.96 ■ ▲ ● 49 ▲ Columbia, SC 61.55 ▲ ▲ ▲ 50 ▲ Nashville, TN 61.36 ▲ ▲ ▲ 51 ▲ Kansas City, MO 60.58 ▲ ▲ ▲ 52 ▲ Chattanooga, TN 60.20 ● ■ ▲ 53 ▲ Washington, DC 59.55 ▲ ■ ● 54 ▲ El Paso, TX 59.54 ▲ ● ▲ 55 ▲ Memphis, TN 58.90 ● ■ ■ 56 ▲ Sarasota, FL 58.66 ▲ ▲ ▲ 57 ▲ Virginia Beach, VA 57.58 ▲ ● ▲ 58 ▲ Los Angeles, CA 57.48 ▲ ▲ ▲ 59 ▲ Syracuse, NY 57.41 ■ ▲ ● 60 ▲ Hartford, CT 57.07 ▲ ▲ ▲ 61 ▲ Albuquerque, NM 56.90 ▲ ▲ ▲ 62 ▲ Providence, RI 56.38 ■ ▲ ● 63 ▲ Jackson, MS 55.65 ● ■ ▲ 64 ▲ San Diego, CA 55.50 ▲ ● ▲ 65 ▲ Houston, TX 55.26 ▲ ● ▲ 66 ▲ Buffalo, NY 54.37 ▲ ▲ ▲ ©2023 Asthma and Allergy Foundation of America 8 asthmacapitals.com
Overall Rankings ■ Worse Than Average ▲ Average ● Better Than Average
(Factors are not weighted equally. Total scores are rounded for the purposes of this chart.)
2023 Overall Ranking Overall Metropolitan Area Total Score (Avg. 61.10) Subtotal: Estimated Asthma Prevalence Subtotal: Crude Death Rate for Asthma Subtotal: ED Visits for Asthma 67 ▲ Minneapolis, MN 54.26 ▲ ▲ ● 68 ▲ Worcester, MA 53.31 ▲ ■ ● 69 ▲ Austin, TX 53.21 ▲ ● ● 70 ▲ Des Moines, IA 52.43 ● ● ■ 71 ▲ Milwaukee, WI 52.28 ● ■ ▲ 72 ▲ Seattle, WA 51.79 ● ● ▲ 73 ● Bakersfield, CA 51.09 ▲ ▲ ▲ 74 ● Scranton, PA 50.01 ▲ ▲ ● 75 ● Tulsa, OK 49.95 ▲ ● ● 76 ● San Jose, CA 49.59 ● ● ▲ 77 ● San Francisco, CA 49.48 ▲ ● ● 78 ● Greensboro, NC 49.45 ● ▲ ▲ 79 ● Oklahoma City, OK 48.10 ● ■ ▲ 80 ● Augusta, GA 47.81 ● ● ■ 81 ● Grand Rapids, MI 47.74 ● ● ▲ 82 ● Charlotte, NC 46.24 ▲ ▲ ● 83 ● Colorado Springs, CO 45.24 ● ▲ ● 84 ● Bridgeport, CT 45.10 ▲ ● ● 85 ● Portland, OR 43.96 ● ▲ ● 86 ● Birmingham, AL 43.46 ● ■ ● 87 ● Denver, CO 43.41 ▲ ● ● 88 ● Knoxville, TN 41.77 ● ▲ ● 89 ● Boston, MA 41.03 ● ■ ● 90 ● Boise, ID 40.76 ▲ ● ● 91 ● Raleigh, NC 40.68 ● ● ▲ 92 ● New Haven, CT 40.47 ● ▲ ● 93 ● Winston-Salem, NC 38.91 ● ▲ ● 94 ● Ogden, UT 38.48 ● ▲ ● 95 ● Little Rock, AR 37.22 ● ● ▲ 96 ● Durham, NC 36.95 ● ● ● 97 ● Madison, WI 36.76 ● ● ▲ 98 ● Oxnard, CA 36.60 ● ● ● 99 ● Salt Lake City, UT 35.21 ● ▲ ● 100 ● Provo, UT 23.42 ● ● ● ©2023 Asthma and Allergy Foundation of America 9 asthmacapitals.com
Regional
Rankings ■ Worse Than Average ▲ Average ● Better Than Average (Factors are not weighted equally. Total scores are rounded for the purposes of this chart.)
NORTHEAST
2023 Regional Rankings Overall Metropolitan Area Total Score Subtotal: Estimated Asthma Prevalence Subtotal: Crude Death Rate for Asthma Subtotal: ED Visits for Asthma 1 ■ Allentown, PA 100.00 ■ ▲ ■ 2 ■ Poughkeepsie, NY 88.96 ■ ▲ ● 3 ■ Philadelphia, PA 86.73 ■ ■ ▲ 4 ■ Rochester, NY 80.97 ■ ▲ ▲ 5 ■ New York, NY 77.97 ■ ■ ▲
2023 Regional Rankings Overall Metropolitan Area Total Score Subtotal: Estimated Asthma Prevalence Subtotal: Crude Death Rate for Asthma Subtotal: ED Visits for Asthma 1 ■ Lakeland, FL 93.65 ■ ▲ ■ 2 ■ Charleston, SC 92.89 ■ ▲ ■ 3 ■ Richmond, VA 87.66 ▲ ■ ■ 4 ■ Baltimore, MD 79.14 ▲ ■ ▲ 5 ■ Orlando, FL 78.67 ■ ▲ ■
2023 Regional Rankings Overall Metropolitan Area Total Score Subtotal: Estimated Asthma Prevalence Subtotal: Crude Death Rate for Asthma Subtotal: ED Visits for Asthma 1 ■ Cleveland, OH 92.69 ■ ■ ■ 2 ■ Detroit, MI 91.48 ■ ■ ▲ 3 ■ Columbus, OH 80.29 ▲ ▲ ■ 4 ■ St. Louis, MO 78.84 ▲ ■ ▲ 5 ■ Omaha, NE 74.96 ▲ ■ ▲ WEST 2023 Regional Rankings Overall Metropolitan Area Total Score Subtotal: Estimated Asthma Prevalence Subtotal: Crude Death Rate for Asthma Subtotal: ED Visits for Asthma 1 ■ Fresno, CA 86.40 ■ ■ ▲ 2 ■ Spokane, WA 73.10 ■ ▲ ■ 3 ■ Las Vegas, NV 71.81 ▲ ▲ ■ 4 ▲ Phoenix, AZ 67.94 ■ ▲ ▲ 5 ▲ Tucson, AZ 67.57 ▲ ■ ▲ ©2023 Asthma and Allergy Foundation of America 10 asthmacapitals.com
SOUTH
MIDWEST
Asthma Health Outcomes
AAFA ranks cities based on three health outcomes: asthma prevalence (how many people have asthma), asthma-related emergency department visits, and asthma-related mortality (death) rates. The outcomes are not weighted equally.

Estimated Asthma Prevalence
The number of people living with asthma increased in 2022 to more than 27 million people.4,5 This equals about 1 in 12 people. Current asthma prevalence has increased from 20.3 million people in 2001.
Prevalence rates differ significantly by race, ethnicity, socioeconomic status, age and sex:
• Puerto Ricans have the highest rate of asthma prevalence compared to any other racial or ethnic group in the United States.6
• Black Americans are also disproportionally diagnosed with asthma compared to white Americans.6
• Asthma is more common in female adults than male adults. Around 10.8% of female adults have asthma, compared to 6.5% of male adults.4
• While there are more adults with asthma than children, asthma is a leading chronic disease in children.7 Only dental cavities are more common in kids than asthma.8
• Persons living below 100% of the poverty level are more likely to have asthma than those living at any percentage above the poverty level.4,5
The cities with the highest estimated asthma prevalence† are:
†For each city included in the 2023 Asthma Capitals, AAFA obtained an estimated asthma prevalence for its respective MSA. For this report, asthma prevalence is estimated using claims data for individuals who sought asthma care at any point in the 2022 calendar year. While this is not an exact measure of prevalence, it helps provide data that can be compared from city to city. Other prevalence estimates, such as those from the CDC, use self-reported data through surveys.
Asthma Prevalence Ranking Metropolitan Area Overall Asthma Capital National Ranking 1 Poughkeepsie, NY 6 2 Detroit, MI 5 3 Albany, NY 23 4 McAllen, TX 17 5 Fresno, CA 9 6 Lakeland, FL 2 7 Cleveland, OH 4 8 Harrisburg, PA 16 9 Rochester, NY 10 10 Allentown, PA 1
Poughkeepsie, NY ©2023 Asthma and Allergy Foundation of America 11 asthmacapitals.com
Emergency Department Visits
Asthma can trigger severe symptoms that require a visit to the emergency department (ED). Nationally, asthma accounts for nearly one million emergency department visits each year.9
Effective asthma management may help reduce ED visits and hospitalizations. Increased ED visits are a sign of poor asthma control. Steps to improving asthma control include reducing exposure to asthma triggers, having access to and taking prescribed asthma medicine, and following an Asthma Action Plan.
There are large asthma disparities in terms of ED visits based on race as well as age. Asthma-related ED visits are six times higher for Black patients than for white patients. Children are more likely than adults to have asthma-related ED visits, with children ages 0-4 having the highest rates of asthma-related ED visits.9
The cities with the highest asthma-related ED visits† are:

†For each city included in the 2023 Asthma Capitals, AAFA obtained the total number of ED visits where an asthma ICD-10 code was included in a diagnosis field, for the respective census-designated metropolitan statistical area, or MSA, for calendar year 2022. Analyses included estimating the ED rate per 10,000 asthma patients.
To prevent asthma emergencies, people with asthma must:
• Avoid (or reduce) exposure to known asthma triggers, and
• Use medicines to keep their airways open.
It can be difficult to fully avoid all asthma triggers. When exposed to asthma triggers, the airways begin to swell, constrict, and fill with mucus. Asthma control medicines treat and prevent airway inflammation but are only effective if people have access to them and use them.
Emergency Department Visits Ranking Metropolitan Area Overall Asthma Capital National Ranking 1 Allentown, PA 1 2 Dayton, OH 19 3 Columbus, OH 11 4 Charleston, SC 3 5 New Orleans, LA 26 6 Richmond, VA 7 7 Lakeland, FL 2 8 Jacksonville, FL 30 9 Wichita, KS 47 10 Akron, OH 39
12 asthmacapitals.com
Allentown, PA
©2023 Asthma and Allergy Foundation of America
Asthma-Related Mortality
Tragically, asthma can be fatal. In 2021, there were 3,517 deaths attributed to asthma in the U.S.10 This means about 10 people per day lose their life to asthma. There hasn’t been meaningful improvement in these numbers in the last decade. In 2020, deaths due to asthma rose for the first time in 20 years.11
Some populations are at higher risk for dying from asthma than others. The causes of higher asthma death rates are complex but must be addressed to save lives. The top 10 cities for asthma-related deaths must take action to prevent more tragedies.
The cities with the most asthma-related deaths† are:

†For each city included in the 2023 Asthma Capitals, AAFA obtained the estimated asthma-related crude death rate per 100,000 people for its respective county from 2018-2021 (most recent available data).
To reduce the risk of death from asthma, it is important to:
• Have access to asthma medicines and take them as prescribed.
• Seek medical care if symptoms occur more than twice per week.
• Avoid or reduce exposure to asthma triggers.
• Learn the signs and symptoms of asthma, including early warning signals.
• Have an Asthma Action Plan and take quick action according to the plan.
If someone’s life is in danger, seek emergency care immediately. An Asthma Action Plan can help identify when asthma is a medical emergency. Visit aafa.org/actionplan to download a sample plan.
AsthmaRelated Deaths Ranking Metropolitan Area Overall Asthma Capital National Ranking 1 St. Louis, MO 13 2 Richmond, VA 7 3 Baltimore, MD 12 4 Chattanooga, TN 52 5 New York, NY 15 6 Fresno, CA 9 7 Memphis, TN 55 8 Omaha, NE 18 9 Jackson, MS 63 10 Philadelphia, PA 8
ASTHMA ACTION PLAN Name: Medical Doctor’s Day Night/Weekend Emergency Contact: Doctor’s The colors traffic light will you asthma medicines. means Use preventive YELLOW Zone! Add medicine. means Danger help from a doctor. Personal Best Peak Flow: Use these daily controller medicines: all of Breathing is No cough Sleep through the night Can play MEDICINE MUCH OFTEN/WHEN For asthma exercise, take: CAUTION Continue with green zone medicine and add: have of First signs Exposure trigger Cough Mild at night MEDICINE MUCH OFTEN/ WHEN CALL CARE DANGER Take these medicines and call your doctor now. Your asthma worse fast: Medicine is Breathing fast Nose wide Trouble speaking children) MEDICINE MUCH OFTEN/WHEN HELP FROM A DOCTOR NOW! Your doctor will want to you right away. It’s important! you cannot contact your doctor, go directly to the emergency room. DO NOT Make an appointment your asthma provider within two ER visit or hospitalization. aafa.org from from Peak flow: reading
©2023 Asthma and Allergy Foundation of America 13 asthmacapitals.com
St. Louis, MO
SPOTLIGHT: Asthma Control
There are three changes that happen in the airways when someone has asthma:
• Swelling inside the airways
• Excess mucus clogs the airways
• Muscles tighten and squeeze around the airways
These changes make the airways smaller or narrower, making it harder to breathe. Common symptoms include shortness of breath, cough, wheeze, chest tightness or pain, and waking up at night. When asthma is well-controlled, these symptoms happen two or fewer times per week.
Is Your Asthma Under Control?
A good way to know if your asthma is not well-controlled is by answering these questions:
• Do you have asthma symptoms more than two times a week?
• Do you need your quick-relief medicine to treat symptoms more than two times a week?
• Do you wake up from asthma more than two times a month?
• Do you use oral corticosteroids (like prednisone) more than two times a year?
If the answer is “yes” to any of these questions, it is a sign that your asthma is not under control. There are many treatment options to support asthma control.
Asthma Medicines: Control and Quick-Relief or a Combination?
Asthma medicines work to help control or prevent symptoms as well as relieve symptoms when they happen. Doctors may prescribe two separate medicines for control and relief, or a medicine that combines them into one.
The medicines used to treat asthma depend on the severity of asthma. Asthma treatment plans may call for:
• An inhaled corticosteroid (ICS) taken daily to control and prevent symptoms plus a quick-relief inhaler (like albuterol) to treat symptoms when they happen
• An ICS inhaler plus a quick-relief inhaler taken as needed, one right after the other, to treat symptoms when they happen
• A combination inhaler that includes both types of medicines (control and quick-relief) into one inhaler that can be used daily and/or as needed
• Only a quick-relief inhaler to treat symptoms when they happen (for intermittent asthma only)
• Adding a biologic treatment (a shot or infusion) to use in addition to control and quick-relief medicines
Written Asthma Action Plans help people with asthma identify asthma symptoms and to know which medicines to take and when to take them. The goal of asthma treatment is to maintain asthma control with the least amount of medicine needed. Current guidelines in the United States recommend a stepwise approach based on asthma severity.12
©2023 Asthma and Allergy Foundation of America 14 asthmacapitals.com
Risk Factors That Can Worsen Asthma or Influence Asthma Rates
A risk factor is any attribute, characteristic, or exposure of an individual that increases the likelihood of developing a disease, like asthma. While the risk factors outlined in this report are not calculated as part of the overall ranking, they are important to address as they contribute to rates of asthma prevalence, emergency room visits, and mortality. These are some of the top risk factors for asthma:
• Poverty
• Exposure to air pollution
• Pollen allergy
• Asthma quick-relief medicine use*
• Lack of access to specialists
• Lack of health insurance
• Poor indoor air quality (poor housing quality)
• Smoking (cigarettes, cigars, vapes)
• Asthma control medicine use*
*High numbers of prescriptions for asthma medicines can indicate a larger population managing persistent asthma, or more frequent severe or uncontrolled asthma.
Social and Structural Determinants of Health
The World Health Organization (WHO) defines social determinants of health (SDOH) as “the conditions in which people are born, grow, work, live and age, and the wider set of forces and systems shaping the conditions of daily life.”13 SDOH includes social determinants and structural inequities.
Social determinants are “the conditions in which people are born, grow, live, work, and age.” These include factors such as socioeconomic status, education, neighborhood and physical environment, employment, social support networks, and access to health care.
Structural determinants are “the wider set of forces and systems shaping the conditions of daily life.”13 These forces, which are deeply embedded in society and have historically influenced policies and governance, lead to systemic disadvantages of a particular social group and are the root cause of health inequities. Examples include structural racism, discrimination, and segregation. Structural determinants shape the social determinants experienced by people in their neighborhoods and communities.
SDOH can affect how people control their asthma or gain access to health care. Inequities in SDOH are key drivers in asthma disparities, especially among Black Americans.
Historically, local and federal policies and programs negatively affected these factors. To improve asthma health outcomes, policies and programs must address and remove barriers to:
• Access to quality, affordable health care
• Food and economic security
• Good quality housing
• Clean and safe air
• Access to job and educational opportunities
• Access to technology, such as the internet
• Access to transportation
• Climate-resilient communities
©2023 Asthma and Allergy Foundation of America 15 asthmacapitals.com
Poverty
Poverty plays a major role in the development of asthma and a person’s ability to manage it. This can be because people with low income and low wealth are more likely to have poor quality of housing, live near highways and other highly polluted areas, and struggle to pay for treatment. Many cities in our report have poverty as a top risk factor.
Good asthma management can be difficult when families are worried about paying for housing, clothing, utilities, and food. The cost of care may affect the decision to seek medical care. A lack of reliable transportation and paid sick leave may influence a person’s ability to attend regular health care appointments.
Persons living below 100% of the poverty level are more likely to have asthma than people living at any percentage above the poverty level.14
Communities with high poverty levels are often the same communities at greatest risk of harm from the climate crisis. These communities lack the infrastructure and investment required to be climate resilient. The three cities with the highest poverty levels (McAllen, Jackson, and New Orleans) are also within the top one-third of the country at highest risk of flooding.15

These cities have the highest rates of poverty†:
city included in
6.9% to 28.8%.
2023 Poverty Guidelines for the 48 Contiguous States and the District of Columbia:16
• 1 person in household: $14,580
• 2 persons in household: $19,720
• 3 persons in household: $24,860
• 4 persons in household: $30,000
• 5 persons in household: $35,140
For resources to help with the costs of some asthma medicines, visit: aafa.org/asthma-assistance
Poverty Ranking Metropolitan Area Overall Asthma Capital National Ranking 1 McAllen, TX 17 2 Jackson, MS 63 3 New Orleans, LA 26 4 Baltimore, MD 12 5 Philadelphia, PA 8 6 St. Louis, MO 13 7 Augusta, GA 80 8 Richmond, VA 7 9 El Paso, TX 54 10 Detroit, MI 5
†For each
the 2023 Asthma Capitals, AAFA obtained the poverty rate for its respective county. The estimates range from
McAllen, TX
©2023 Asthma and Allergy Foundation of America 16 asthmacapitals.com
Lack of Health Insurance
Access to health care plays an important role in managing asthma symptoms, preventing exacerbations, and promoting better quality of life. For patients managing a chronic condition like asthma that requires medicine year-round, having insurance is often a big help. However, insurance itself can also be costly. These costs may vary depending on employment status and whether the job offers health insurance as a benefit and pays any of the costs. Other options include marketplace health insurance and government-sponsored insurance, like Medicare or Medicaid. Some states have expanded health insurance options for their residents while others have not. Racial and ethnic minority populations disproportionately experience barriers to health insurance, contributing to racial and ethnic disparities in health care.6
These cities have the highest number of uninsured residents†:

Dallas, TX
†For each city included in the 2023 Asthma Capitals, AAFA obtained the uninsured rate for its respective county. The estimates range from 3% to 32%.
Numerous studies have shown that the Affordable Care Act’s (ACA) Medicaid expansion has improved access to coverage and care since states began implementing expansion in 2014.18 In fact, coverage expansions put in place by the ACA served as a safety net for people who lost jobs or health insurance coverage during the COVID-19 pandemic.19 As of 2023, only 10 states have yet to expand their Medicaid programs: Alabama, Florida, Georgia, Kansas, Mississippi, South Carolina, Tennessee, Texas, Wisconsin, and Wyoming.20 For the millions of uninsured people in these states, the decision not to expand has left them without an option for affordable health insurance. In previous research conducted by AAFA, lack of health insurance was one of the top three reasons people cited as reasons why they didn’t take their prescribed asthma treatments.
Texas is home to the largest number of uninsured Americans of any state in the country.17 ©2023 Asthma and Allergy Foundation of America
Lack of Insurance Ranking Metropolitan Area Overall Asthma Capital National Ranking 1 McAllen, TX 17 2 Dallas, TX 36 3 El Paso, TX 54 4 Houston, TX 65 5 San Antonio, TX 27 6 Tulsa, OK 75 7 Lakeland, FL 2
Miami, FL 25
Oklahoma City, OK 79
Cape Coral, FL 22
8
9
10
17 asthmacapitals.com
Exposure to Air Pollution
Poor air quality can negatively affect everyone’s health. Research shows that air pollution can make asthma worse and trigger asthma symptoms.21 Air pollution includes gases, smoke from fires, volcanic ash, dust particles, emissions from transportation, and other substances that can harm the lungs. Places near manufacturing plants and roadways with heavy traffic tend to have high rates of air pollution.
The U.S. Air Quality Index (AQI) is EPA’s way of reporting air quality. Five major pollutants are tracked in the AQI:
• Harmful gases (ground-level ozone, carbon monoxide, sulfur dioxide, nitrogen dioxide)
• Particle pollution (also called particulate matter, reported by size: PM2.5 and PM10)
Ground-level ozone, a gas, is one of the most common air pollutants. Ozone contributes to what we typically experience as smog or haze. Ozone triggers asthma because it is irritating to the lungs and airways.
Other forms of air pollution can also trigger asthma. Small particles in the air found in haze, smoke, and airborne dust can pass through your nose or mouth and get into your lungs. People with asthma are at greater risk from breathing in small particles. The particles can make asthma worse.
More than 40% of the U.S. population lives in areas with unhealthy levels of ozone or particle pollution, and this number has increased in recent years.22 Climate change—a public health emergency—is one of the most critical explanations for this increase in pollution.
These cities all received an F rating from the American Lung Association’s 2023 State of the Air Report for high ozone days and particle pollution†:
Bakersfield, CA was ranked as the city most polluted by daily particle pollution and the city most polluted by year-round particle pollution in the 2023 State of the Air report.
†For each city included in the 2023 Asthma Capitals report, AAFA obtained the grades for high ozone days and particle pollution for the respective county. Grades were averaged to produce an overall grade, ranging from A to F.

Metropolitan Area Overall Asthma Capital National Ranking Phoenix, AZ 31 Bakersfield, CA 73 Fresno, CA 9 Los Angeles, CA 58 Riverside, CA 44 Sacramento, CA 42 San Diego, CA 64 San Jose, CA 76 Stockton, CA 41 Denver, CO 87 Detroit, MI 5 Las Vegas, NV 24 Provo, UT 100 Salt Lake City, UT 99
Bakersfield,
©2023 Asthma and Allergy Foundation of America 18 asthmacapitals.com
CA
SPOTLIGHT: Wildfires
Wildfires are becoming more common, more intense, and more widespread due to climate change and land use changes. Fire seasons are getting longer - they start earlier and end later than in the past. Extreme weather starts and spreads fires. Increased wildfire activity leads to increased greenhouse gases, which then further fuel climate change in a reinforcing feedback loop.
The Climate Change and Wildfire Cycle
Emissions of greenhouse gases (including CO2) lead to rising temperatures, which contributes to climate change
Climate change contributes to extreme weather events (high temperatures, drought, winds, lightning)
High temperatures, drought, winds, and lightning lead to more frequent and severe wildfires
Increased wildfires lead to greenhouse gas emissions and small particulate matter air pollution
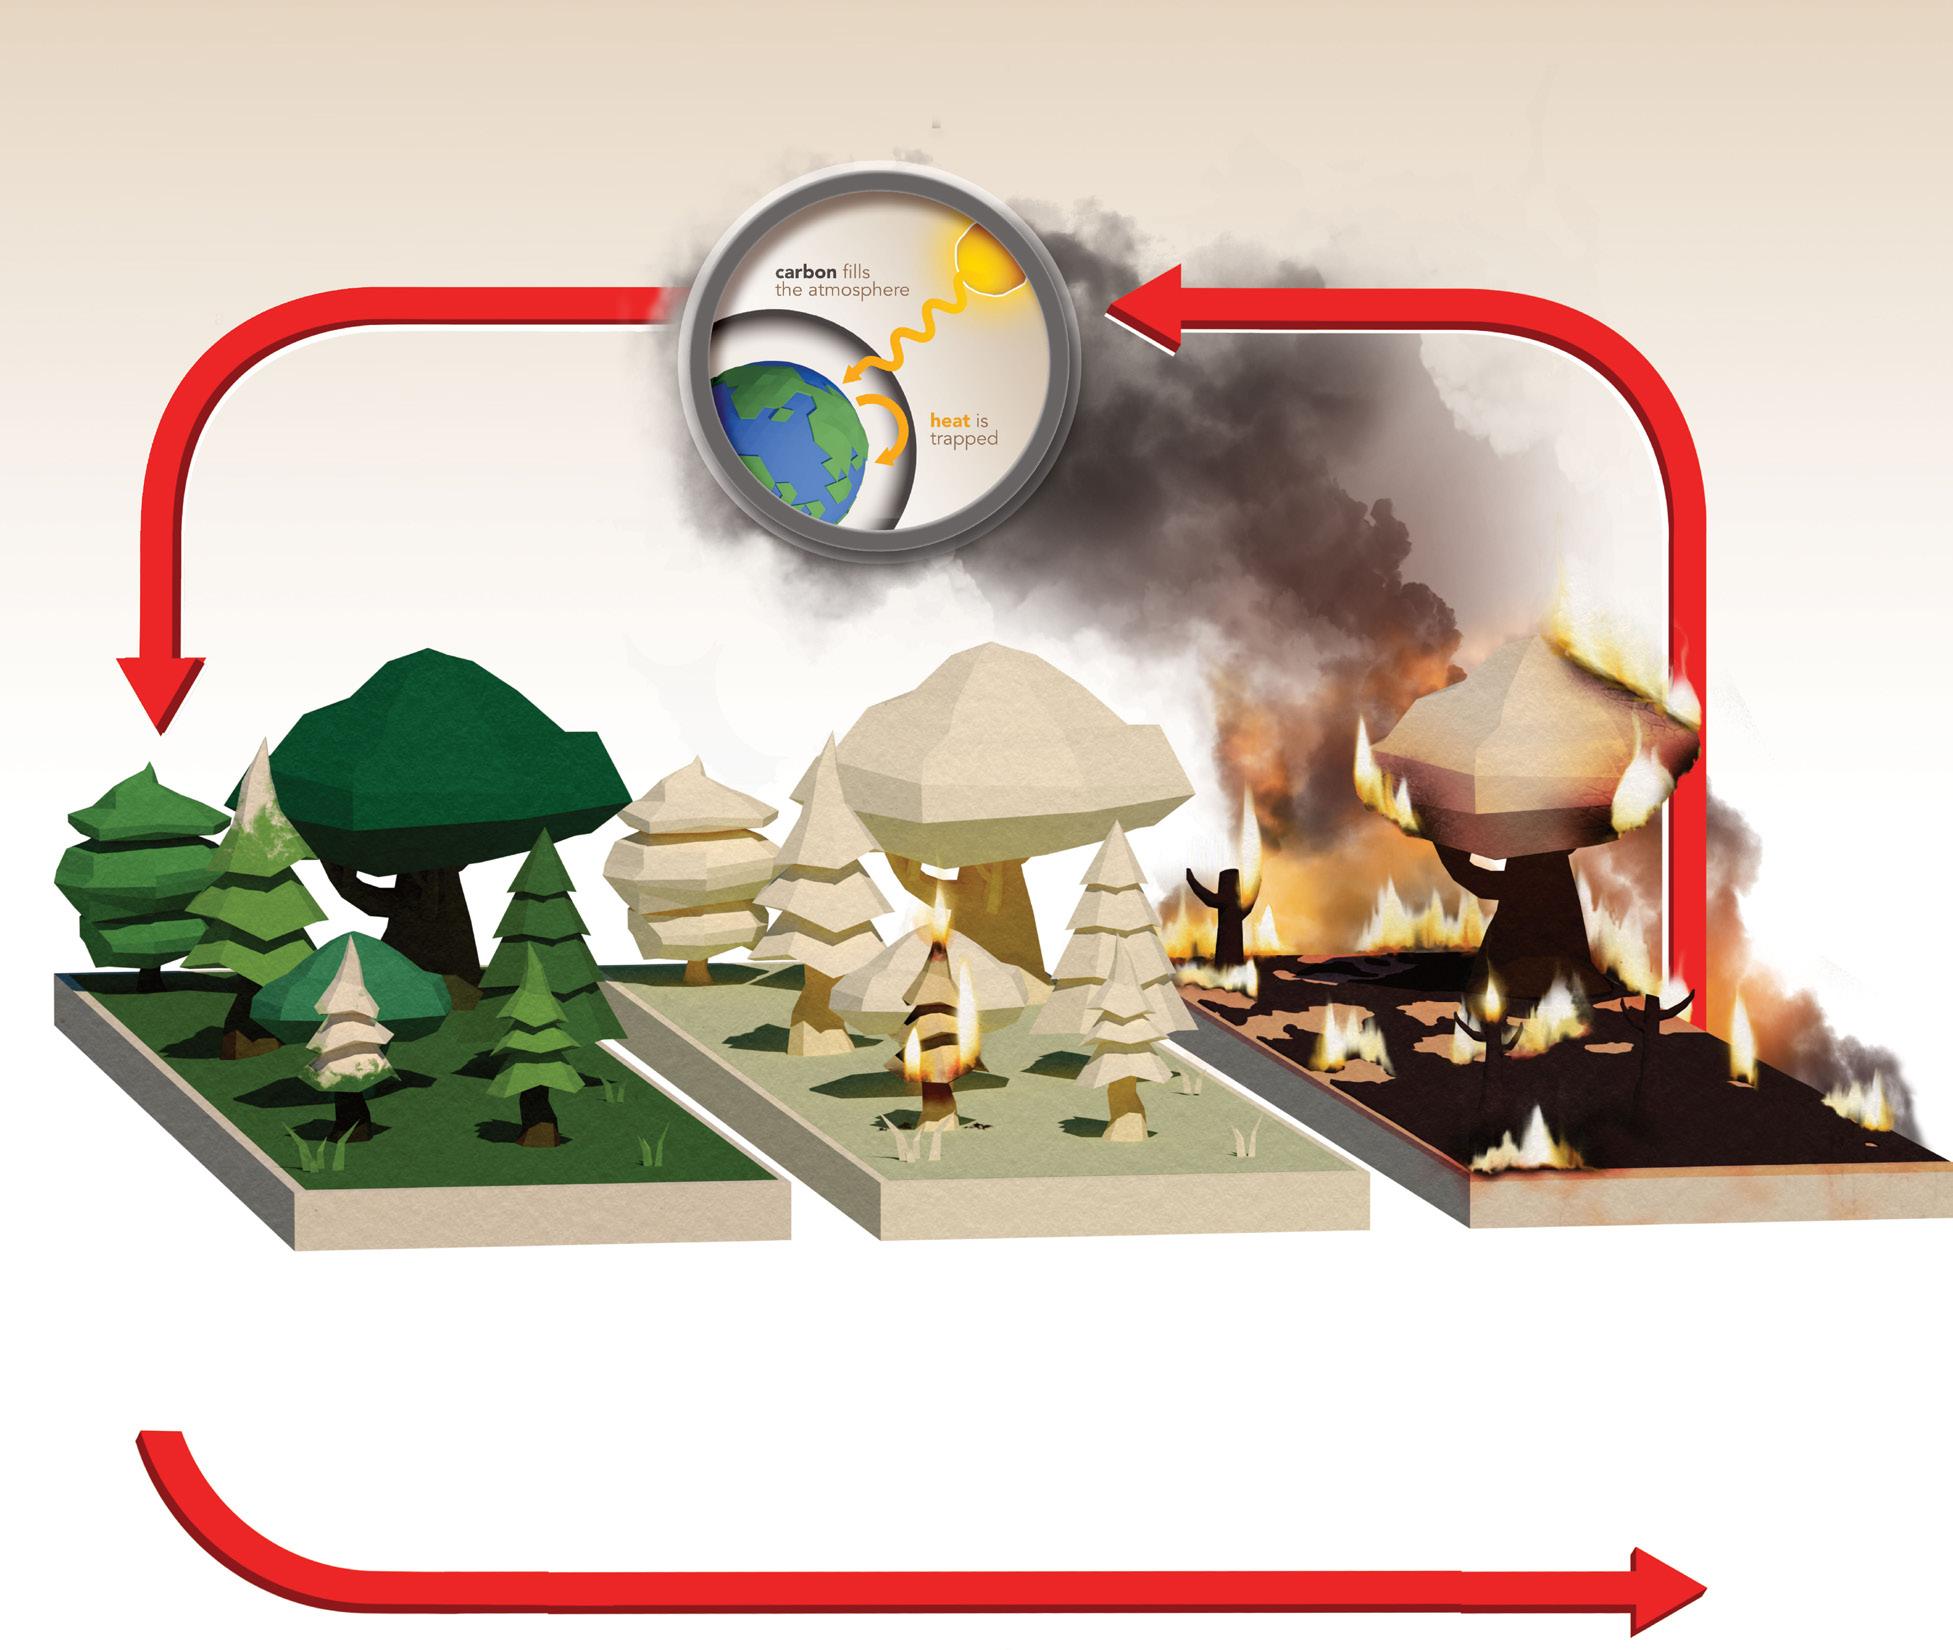
Wildfire smoke is a complex mixture of harmful gases and small particulate matter known as PM2.5. Wildfire smoke is one of the biggest sources of PM2.5 pollution.23 Exposure to PM2.5 is associated with increased risk of respiratory disease, cardiovascular disease, and cognitive disorders. The small particles can get deep into the lungs and cause injury and inflammation to lung tissue.
People with asthma or COPD, children, older adults, people who are pregnant, people who have a lower socioeconomic status, and people who are outdoor workers are at greatest risk for harm to their health from wildfire smoke.
©2023 Asthma and Allergy Foundation of America 19 asthmacapitals.com
The impact of wildfires is spreading to regions where wildfire smoke exposure was previously uncommon. While fires are common in the Western U.S. and Canada, they are growing in magnitude and the resulting air pollution can travel hundreds or thousands of miles. Fires are occurring in unexpected areas as well. In 2022, Texas experienced the most wildfires it has had in over a decade (12,400 fires).24 Dead vegetation left by Hurricane Michael (2018) fueled the Chipola Complex fires in Florida four years later in March 2022.25 In August 2023, winds from Hurricane Dora rapidly spread fires on the Hawaiian island of Maui resulting in the deadliest U.S. wildfire in over a century.26
During April 30–August 4, 2023, smoke originating from wildfires in Canada traveled hundreds of miles across the U.S. border and was associated with an increase in asthma-associated ED visits. CDC analyzed daily numbers and percentages of asthma-associated emergency department (ED) visits on days with and without wildfire smoke. Nationally, ED visits for asthma were 17% higher than expected for 19 days of wildfire smoke during this time period.27 In New York, asthma-related ED visits increased over 80% on the day with the highest exposure to wildfire smoke (June 7, 2023).23
To protect against harmful wildfire smoke inhalation:
• Check current and predicted air quality conditions
• Use HEPA filtration indoors
• Wear properly fitted N95 respirators when outdoors
LOCAL SPOTLIGHT: A Community Taking Action
Smoke originating from wildfires in Canada significantly impacted air quality in Wayne County, Michigan (home to Detroit, the #5 Asthma Capital in 2023). With funding provided by the American Rescue Plan Act, the Wayne County Community Air Quality Project launched in 2023 and will span over three years. The project will provide 500 mobile air quality monitors to children and families and install 100 stationary air monitors in 43 communities across the county. Some of the mobile monitors will be placed on top of quick-relief inhalers used by children with asthma. The mobile monitor on the inhaler—as well as the nearest stationary monitor—will measure air quality at the time of an asthma exacerbation. The data will be used to help advocate for additional clean air standards for local industries contributing to poor air quality.
The county contracted with JustAir, a Michigan-based air quality monitoring company. JustAir’s co-founder and CEO, Darren Riley, developed asthma as a young adult when he moved into the southwest Detroit community. Darren’s passion for environmental justice and technology helped launch his company. Darren works with several local coalitions and organizations including the AAFA Michigan Chapter.
20 asthmacapitals.com
©2023 Asthma and Allergy Foundation of America
SPOTLIGHT: Indoor Air Quality and Healthy Buildings
Indoor air quality is just as important as outdoor air quality. Outdoor air can contain harmful pollution. But indoor air can be up to five times more polluted than outdoor air. Buildings can trap harmful air pollution and other asthma triggers inside. Reducing asthma triggers in homes, schools, and workplaces is an important part of asthma management. The following can negatively affect indoor air quality:
• Allergens, such as dust mites, animal dander, cockroaches, and mold
• Scents and fragrances from candles, scent diffusers, cleaning products, personal hygiene products
• Chemicals and volatile organic compounds (VOCs) from building materials, cleaning products, and new furniture
• Burning fuels and wood (from cooking food or heating the indoor space)
• Emissions from vehicles, gas-powered generators, and other machinery
• Outdoor air pollution that enters the building (like from wildfire smoke)
• High levels of humidity that encourage mold growth and dust mites
Due to limited data on the MSA level, AAFA’s Asthma Capitals report does not yet evaluate indoor air quality or housing quality as a risk factor for asthma. But this is a critical area to address in housing policy, building maintenance, school environmental policies, and workplace accommodations. Public buildings should improve their ventilation, use integrated pest management, and evaluate the products they use to reduce indoor air pollution.
Homeowners and rental tenants can use AAFA’s Healthier Home checklist to identify areas of their living spaces that may be contributing to asthma. It can be expensive to remediate an entire home, so AAFA recommends focusing on the areas where the person with asthma spends most of their time. This is usually the bedroom or sleeping areas.
Controlling Asthma Triggers and Allergens
Asthma management involves more than just taking medicine. People with asthma also need to reduce exposure to asthma triggers like air pollution, animal dander, pollen, dust mites, or mold.
There are ways to improve indoor air quality and reduce exposure to allergens and airway irritants. Many products make claims such as being “hypoallergenic.” But there are no federal regulations on these claims. To improve indoor environments for people with asthma and allergies, AAFA and Allergy Standards Limited developed strict standards and certify only the products that meet all the standards.
Look for the CERTIFIED asthma & allergy friendly® mark to confirm which products meet the standards to reduce exposure to allergens and improve air quality. Visit aafa.org/certified to search for CERTIFIED products and learn more about the asthma & allergy friendly® Certification Program.
©2023 Asthma and Allergy Foundation of America 21 asthmacapitals.com
Pollen Allergy
In the U.S., about one in four adults and one in five children have seasonal allergies such as pollen allergy.29 That number could rise in the coming years due to climate change.30 Many people have been experiencing worsening pollen allergy symptoms over the years.
Pollen is a common allergen that can cause allergic asthma (asthma triggered by allergens). Allergic asthma is most common in early childhood and steadily decreases through adulthood.
Pollen allergy seasons start earlier and end later in the year than they did previously. Research shows pollen seasons now start 20 days earlier and last 10 days longer, compared to 30 years ago.31,32
The longer growing seasons mean that in some areas, pollen begins to release in January and may not stop until November. Throughout the U.S., trees produce the most pollen from March through May. In the northern U.S., grass pollen usually appears in the late spring and early summer. Weed pollen appears in the late summer and fall and may continue until the first frost. In the South, tree pollen starts earlier, grass pollen may be year-round, and weed pollen may continue late into the year.
With warmer, longer seasons, allergy-causing plants can move into new areas. Ragweed, for example, is migrating northward due to climate change.
Warmer temperatures and increased levels of CO2 lead to longer growing seasons that change flowering time and increase pollen. Higher concentrations of pollen are linked to increased CO2 levels. (This is often worse in urban areas.) One study on ragweed pollen found that it could be seven times higher in a city that averaged 3.6° F warmer and had 30% more CO2 than the city’s rural surrounding area.33
ExtremeWeather Rising Temperatures Increased CarbonDioxide CLIMATE CHANGE CYCLE IncreasedGroundLeve l OzoneandAirPollution (Stimulatesmorepollen) (Longergrowingseasons (Causesbursts withmorepollen) ofpollen) (Stimulatesmorepollen) CO2 ©2023 Asthma and Allergy Foundation of America 22 asthmacapitals.com
Smoking Cigarettes, Cigars, Vapes
About one in five adults with asthma smoke tobacco products.34 Children who live with smokers have more frequent asthma attacks. More than 40% of children who go to the emergency department for asthma live with smokers.35
According to the CDC, smoking is the leading cause of preventable death in the U.S.36 Smoking is not only harmful to the person doing the smoking but also to those nearby who inhale secondhand smoke or come into contact with thirdhand smoke. People with asthma are at greater risk of harm from tobacco products. Many chemicals, gases, and small particles in secondhand and thirdhand smoke can irritate the lungs and airways, causing additional inflammation and swelling.
Secondhand smoke (SHS) – also known as environmental tobacco smoke (ETS) – refers to smoke that is released in the air when a smoker exhales, as well as smoke released from a burning cigarette, cigar, or pipe. Secondhand aerosols are also released by electronic smoking devices (e-cigarettes, hookahs, vapes). Thirdhand smoke is residue from tobacco smoke. When a nicotine product is smoked, chemicals in the smoke stick to surfaces and dust for months after the smoke is gone. The chemicals in the residue then react to other pollutants in the air, like ozone, to create harmful particles you can easily inhale.37
Tobacco smoke and aerosols (including secondhand and thirdhand smoke) are unhealthy for everyone. There is no safe level of exposure to secondhand smoke. But many non-smokers are exposed to ETS in public places, homes, vehicles, and workplaces.
These cities do the least to protect their residents and visitors from tobacco smoke and have fewer smoke-free laws†, comparatively:
Prohibiting smoking in indoor spaces protects nonsmokers (including children) from ETS. Many state and local jurisdictions have passed laws that ban smoking in some places. These smoke-free zones may include workplaces, restaurants, hotels, parks, public housing, and transit systems. Research your state or county to see what the laws are in your area.

†For each city included in the 2023 Asthma Capitals, AAFA obtained data
minors, non-hospitality workplaces, restaurants, bars, and multi-unit housing.
Metropolitan Area Overall Asthma Capital National Ranking Daytona Beach, FL 40 Miami, FL 25 Orlando, FL 14 Palm Bay, FL 48 Tampa, FL 32 Durham, NC 96 Greensboro, NC 78 Winston-Salem, NC 93 Oklahoma City, OK 79 Tulsa, OK 75 Harrisburg, PA 16 Chattanooga, TN 52 Memphis, TN 55
on whether there was a 100% smoking ban for cars with
©2023
of
23 asthmacapitals.com
Asthma and Allergy Foundation
America
Asthma Quick-Relief Medicine Use
Both control medicines (sometimes called “controllers”) and quick-relief medicines (sometimes called “rescue inhalers”) may be necessary for optimal asthma management. Quick-relief medicines help relieve asthma symptoms as they are happening. These medicines act fast to relax the constricting smooth muscles around the airways. This allows the airways to open up so air can flow through them. Frequent use of a quick-relief medicine (like albuterol) may indicate a higher number of asthma episodes and lack of asthma control.
For inhalers to work well they need to be used correctly but they can be difficult for people to use. There are different types of inhalers and this may cause confusion for patients and caregivers. More than half of all people who use inhalers don’t do each step correctly.38 It is important for patients, nurses, and doctors to learn proper inhaler technique and review inhaler use at every appointment.
Quick-relief medicine use is highest in these cities†:
†For each city included in the 2023 Asthma Capitals, AAFA obtained the total number of quick-relief medicine prescriptions for the respective census-designated metropolitan statistical area, or MSA, from 2022. Analysis included estimating the prescription rate per patient prevalence.
Oral corticosteroids (OCS) are a common treatment for acute asthma flare-ups to reduce inflammation and swelling in the airways. This medicine may be prescribed for the treatment of asthma attacks that don’t respond to other asthma medicines.
However, they are not without risk. OCS use is linked to glaucoma, high blood pressure, weight gain, memory and behavior changes. Long-term risks of OCS use include cataracts, diabetes, infections, and osteoporosis (brittle bones).
Asthma that requires treatment with OCS two or more times per year is a sign of uncontrolled asthma. While OCS can be an important tool in managing asthma in certain cases, their use should always be carefully monitored by an asthma specialist or a primary care provider with expertise in asthma.
Asthma Quick-Relief Medicine Use Ranking Metropolitan Area Overall Asthma Capital National Ranking 1 McAllen, TX 17 2 Columbus, OH 11 3 Rochester, NY 10 4 Virginia Beach, VA 57 5 Toledo, OH 28 6 Greenville, SC 20 7 Scranton, PA 74 8 Atlanta, GA 37 9 Dayton, OH 19 10 Lakeland, FL 2
24
McAllen, TX ©2023 Asthma and Allergy Foundation of America
asthmacapitals.com
Asthma Control Medicine Use
Both control and quick-relief medicines may be necessary for optimal asthma management. Control, or controller, medicines help prevent and control asthma symptoms. There are several kinds of asthma control medicines, including inhaled corticosteroids (ICS). ICS medicines prevent and reduce airway swelling, as well as reduce mucus in the lungs. Combination inhaled medicines combine ICS with a long-acting beta agonist (LABA). LABAs open the airways by relaxing the smooth muscles around the airways. Other types of control treatments include biologics or leukotriene modifiers.
Asthma control medicines are prescribed for persistent cases of asthma. A high number of these prescriptions may indicate that a city’s residents have more severe or uncontrolled cases of asthma.
These cities have the highest rates of asthma controller medicine use†:

†For each city included in the 2023 Asthma Capitals, AAFA obtained the total number of controller medicine prescriptions for the respective census-designated metropolitan statistical area, or MSA, from 2022. Analyses included estimating the prescription rate per patient prevalence.
Biologics are a newer type of controller medicine used to treat moderate-to-severe asthma. They can be a treatment option for people whose asthma remains uncontrolled even on high doses of other control medicines (such as inhaled corticosteroids or long-acting beta agonists). Asthma biologics work by disrupting cells and pathways that trigger inflammation. They are administered through an injection (shot) or intravenously (through a vein) and can be given at home or in a doctor’s office. Currently, there are six asthma biologics approved by the FDA, including biologics for severe asthma, eosinophilic asthma, and allergic asthma.
Asthma Long-Term Control Medicine Use Ranking Metropolitan Area Overall Asthma Capital National Ranking 1 Harrisburg, PA 16 2 Pittsburgh, PA 43 3 Virginia Beach, VA 57 4 Greenville, SC 20 5 Grand Rapids, MI 81 6 Scranton, PA 74 7 Charlotte, NC 82 8 Columbia, SC 49 9 Hartford, CT 60 10 Jackson, MS 63
©2023
25 asthmacapitals.com
Harrisburg, PA
Asthma and Allergy Foundation of America
Access to Specialists
Successful asthma management requires coordination of care between the person with asthma and their health care team. In addition to a primary care doctor, a person with persistent asthma might need to be in the care of a specialist. Pulmonologists, allergists, and immunologists, for example, can provide specialized care for people with asthma and may have more experience treating patients with severe asthma or allergic asthma than a primary care physician.
Access to appropriate medical care is dependent upon different factors, including socioeconomic status, insurance status, and availability of specialists in nearby locations. The lack of availability of nearby asthma specialists may be associated with poor asthma outcomes.
Living in an area where there are fewer specialists can mean traveling long distances for care. This can be a burden on personal finances and time, especially when frequent trips are needed. And it may take months to get an appointment.
These cities have the fewest asthma specialists per asthma patient†:

†For each city included in the 2023 Asthma Capitals, AAFA obtained data on specialists per 10,000 asthma patients for the respective census-designated metropolitan statistical area, or MSA, in 2022.
Find an Allergist

People managing asthma and allergies can find specialists in their area using the Find an Allergist tool from the American College of Allergy, Asthma & Immunology (ACAAI). The tool finds specialists by zip code and shows office locations and phone numbers. Use the Find an Allergist tool at acaai.org/find-an-allergist
Fewest Specialists Ranking Metropolitan Area Overall Asthma Capital National Ranking 1 Poughkeepsie, NY 6 2 McAllen, TX 17 3 Las Vegas, NV 24 4 New York, NY 15 5 Albany, NY 23 6 New Haven, CT 92 7 Fresno, CA 9 8 El Paso, TX 54 9 Stockton, CA 41 10 Bridgeport, CT 84
©2023
of America 26 asthmacapitals.com
Poughkeepsie, NY
Asthma and Allergy Foundation
Health Equity
This report acknowledges that where a person lives can significantly impact their health. Social, economic, and environmental disadvantages play a role in determining asthma outcomes. Many of the top Asthma Capitals are also facing major challenges and inequities that lead to health disparities.
AAFA’s Health Equity Advancement and Leadership (HEAL) program reinforces AAFA’s commitment to drastically reduce health disparities in communities that bear the heaviest burden of asthma. Through the HEAL program, AAFA provides funding and resources to local pilot programs tailored to at-risk populations most impacted by asthma.
In 2022, AAFA launched the HEAL program by announcing support for programs in Detroit, St. Louis, Los Angeles, and Chicago. In 2023, AAFA expanded the HEAL program by supporting two additional programs in New York City and Alabama
• The Detroit program (in collaboration with the AAFA Michigan Chapter) provides a holistic asthma management intervention. Participants are provided with comprehensive self-management asthma education, connected with an asthma specialist and a nutritionist, and receive a virtual home environmental assessment from a certified community health worker. Participants are also provided with a local farmers market food box, a membership to a local YMCA, and asthma-friendly products for their homes.
• The St. Louis program (in collaboration with the AAFA St. Louis Chapter) provides an intervention for adults ages 50+ with asthma. The program provides group asthma management education in virtual and in-person settings. Home visits are also provided to support asthma and allergy trigger remediation.
• The Chicago program (in collaboration with the American Lung Association) provides a virtual home assessment program for individuals with asthma. The home visit includes asthma management education and offers support to help households reduce their exposure to asthma triggers.
• The Los Angeles program (in collaboration with Breathe Southern California) provides an asthma management and education program that includes three visits with a health educator. The home visits include an in-home assessment for environmental asthma triggers and resources to reduce barriers to care. The focus of the program is on underserved communities of Southeast Los Angeles County that bear some of the heaviest burden of asthma due to their low socioeconomic status, proximity to high-polluting industrial facilities, and the presence of several major freeways.
• The New York City program (in collaboration with AIRnyc) is developing a unique asthma care program to help the Hispanic population in the Bronx and surrounding areas. In several high-poverty neighborhoods of the South Bronx—where the majority of residents are Hispanic or Black—rates of asthma deaths and burden are consistently higher than the rest of New York City.
• The Alabama program (in collaboration with Virtual Young Teen Asthma & Wellness Camp and the Alabama Asthma Coalition) will expand an existing virtual model to include asthma management home visits and provide asthma health education. The program will build a community health worker network to address the rural health disparity needs through collaborations with schools, local and state departments of health, and other state-based organizations and partners.
©2023 Asthma and Allergy Foundation of America 27 asthmacapitals.com
Though the HEAL interventions are still in progress, early enrollment and evaluation data show that HEAL is reaching and serving people experiencing a disproportionate burden of asthma. Many participants in the programs report having competing priorities and needs relating to their health. Food security, the risk of losing utilities, and the lack of reliable transportation are a few of the competing priorities households are facing that can conflict with their asthma management. Additionally, exposure to outdoor and indoor pollution continues to be a barrier to asthma management.
Across all HEAL sites, program participants complete a voluntary self-reported survey at baseline, 6-, 12-, and 24-months post-intervention. The survey collects data including:
• Participant demographics
• Asthma severity and control (using the AIRQ® tool)
• Asthma exacerbations and healthcare utilization
• Asthma-related quality of life
• Experience with asthma treatments
• Understanding of the participant’s healthcare team
• Perceived provider bias
• Asthma knowledge and confidence
• Comorbid conditions
• Social determinants of health
Baseline data from the HEAL program in Detroit (#5 Asthma Capital in 2023) confirms that the program is reaching adults and adolescents who are experiencing a disproportionate burden of asthma.
Among all participants enrolled in the Detroit HEAL program to date:
Demographics
71% identify as Black or African American 52% are covered through Medicaid and 19% through Medicare
55% report an annual household income of under $25,000 Exposure
Competing Needs and Priorities
87% say they live within 5 miles of an area with heavy traffic
42% live within 5 miles of a manufacturing plant 16% live within
miles of gas or oil refinery
42% say they have been exposed to smoking in the home in the past 7 days
39% say they are exposed to pests such as mice, ants, or bugs
32% say they are exposed to mold in their homes
71% say they have worried food would run out in the past 12 months
55% say their utilities have been threatened to be shut off in the past 12 months
29% say lack of reliable transportation has kept them from medical appointments, work, or from getting necessities
©2023 Asthma and Allergy Foundation of America 28 asthmacapitals.com
to Outdoor Pollution Exposure to Indoor Triggers
5
In Detroit (#5 Asthma Capital), preliminary data from 6-month follow-up evaluations show that the HEAL program is meeting its goals of improving asthma care and outcomes for participants. While more data and time are needed to fully evaluate the program, the preliminary results are promising.
Among participants who have been in the Detroit HEAL program for over six months: At the start of the program
Asthma Control: The survey uses the AIRQ® tool to measure asthma control through a series of questions about asthma symptoms, impact, and healthcare utilization.
Absenteeism/Presenteeism: Asthma can cause people to miss days of school or work, or not be as productive, which can lead to lost wages.
Asthma Knowledge/ Confidence: Asthma self-management education provides people with asthma with strategies to manage their asthma and live a healthier life. This education is another key component of the Detroit HEAL program.
Food Security: Food insecurity is also associated with poor asthma outcomes. The Detroit HEAL program provides participants with free weekly market boxes from the local farmer’s market.
Specialist Care: Asthma specialists are important members of the asthma care team. The Detroit HEAL program connects participants to specialists like pulmonologists.
After six months in the program
63% 44% say asthma symptoms woke them up from sleep within the past two weeks
63% 38% say asthma symptoms caused them to use a quick-relief inhaler or nebulizer every day over the past two weeks
50% 13% say it felt difficult to control their asthma over the past two weeks
63% 50% say asthma caused them to miss one or more days of work/school over the past 12 months
31% 19% say asthma impacted their ability to be productive at work/school more than 10 days over the past 12 months
feel “very sure” they understand how asthma impacts their lungs
feel “very sure” they understand how asthma medicines work
feel “very sure” they know how to reduce their asthma triggers
worry their food would run out before getting money to buy more
the food they had did not last without having money to buy more
saw a pulmonologist for their asthma in the past 12 months
saw an allergist for their asthma in the past 12 months
63%
56%
38% 50%
50%
31%
75% 56%
69% 56%
19% 44%
31% 31%
©2023 Asthma and Allergy Foundation of America 29 asthmacapitals.com
June Mack has lived with asthma most of her life. Living in Detroit (#5 Asthma Capital), asthma control has been challenging for her. Now, at 71 years old, June estimates she has visited the emergency room over 100 times because of her asthma.

June is thankful to have discovered and enrolled in AAFA’s HEAL program. The program connected her to a local allergist, and she started seeing improvement in her day-to-day asthma control.
June learned more about her asthma and how to better manage her symptoms. She received tools and tips on how to reduce triggers in her home that were making her asthma and allergies worse. With support from the HEAL program, June visited a specialist for the first time in her life. The specialist was able to put her on an asthma management plan that better controlled her asthma.
“I went down my basement stairs and back and was able to breathe,” shared June.
“I got instant relief from the new medicine that the specialist gave me. I also benefited from the specialist’s knowledge of asthma. I’ve been going to doctors all my life, but this was my first time seeing an asthma specialist.”
June is most looking forward to being more physically active and getting back to her neighborhood walking group. She plans to walk more, do her lawn work, and be more active in her community now that her asthma is better controlled.
The Role of Community Health Workers in Asthma Care
Community Health Workers (CHW) are frontline public health professionals. CHW is an umbrella term for many job titles, including public health worker, promotor de salud, community health educator, peer educator, health aide, and patient navigator. CHWs are trusted members of the healthcare team and are culturally-responsive within the communities they serve. With the ability to develop rapport and trust with a patient, they provide a critical component necessary for asthma intervention services.
CHW’s are essential in AAFA’s HEAL program and similar programs focused on decreasing asthma disparities in local communities. CHW-led interventions are known to enhance asthma management by bridging communication between families, providers, schools, and social service agencies. CHWs also help support asthma control by providing patient education and asthma trigger mitigation.39
AAFA is an allied member of the National Association of Community Health Workers (NACHW) and will continue to support NACHW’s national and local efforts to ensure that CHWs are supported and respected in asthma care.40
©2023 Asthma and Allergy Foundation of America 30 asthmacapitals.com
AAFA’s Health Equity Advancement and Leadership (HEAL) program is supported by generous contributions from the American College of Allergy, Asthma, & Immunology (ACAAI), Amgen, AstraZeneca, Genentech, Novartis, Pegasus Home Fashions, Rabbit Air, Renegade Brands, Sanofi, Regeneron, and Viatris.
Steps to Improve Asthma Outcomes
AAFA’s mission is to save lives and reduce the burden of disease for people with asthma and allergies through support, advocacy, education, and research. We are committing our resources to programs and policies with the aim to drastically reduce asthma rates, deaths, and disparities, as well as their impact on people and communities. We urge multiple stakeholders to join us to work harmoniously to improve and save lives.
This section outlines ideas for the following stakeholders:
• Federal, state, and local health officials
• Policymakers, legislators, and regulatory agencies
• Health care providers
• People with asthma and caregivers of children with asthma
• Health insurance companies
• Drug (pharmaceutical) companies
Federal, State, and Local Health Officials
Fund and support public programs for people with asthma
• Provide free asthma screenings
• Encourage flu, COVID-19, and pneumonia vaccines for people with asthma
• Build and implement asthma education and intervention programs
• Include people with asthma in all levels of planning for asthma-related interventions and programs
• Offer smoking cessation programs and fund tobacco-free youth campaigns that also teach about the dangers of vaping
Reduce air pollution and improve outdoor air quality
• Advance policies that support:
• Carpools, public transportation, cycle and pedestrian-friendly roads
• Electrifying buses and other public transportation
• Traffic reduction measures to reduce idling
• Rebates for electric cars and green energy solutions like solar panels
• Reduction of food waste
• Increased consumption of plant-based meals (reduction of meat intake)
• Reduction of industrial air pollution from methane, nitrogen oxides, carbon dioxide, and ozone
• Creation and protection of urban green spaces
• Burn ban enforcements and other fire prevention policies
• Transitions to cleaner heating (reduce fireplace and wood stoves)
• Composting and recycling
• Smoke-free zones (such as public parks)
Promote improvements in indoor air quality for people with asthma
• Ensure that all indoor, public buildings are smoke-free, and establish a buffer near entrances/exits (e.g., no smoking within 25 feet of a building door or window)
• Improve housing quality for rental units, including assisted rental units like public housing, through “healthy home” policies and green building practices
Improve asthma care in schools
• Ensure there are nurses in every school
• Encourage asthma management plans in schools
• Support tobacco cessation programs, tobacco prevention programs, and vaping/e-cig interventions for teens and children
• Continue efforts to stock undesignated quick-relief asthma medicine in schools, ensure schools are equipped to obtain asthma medicines, and train appropriate staff to administer medicines
©2023 Asthma and Allergy Foundation of America 31 asthmacapitals.com
Policymakers, Legislators, and Regulatory Agencies
Fund programs and research that benefit people with asthma
• Expand funding for the National Asthma Control Program (NACP) of the CDC
• Support and fund primary, secondary, and tertiary asthma prevention research
• Encourage and incentivize state and local health departments to adopt comprehensive community asthma programs
• Prioritize review and approval of asthma medicines, particularly first-in-class options for patients
Enact policies and regulations that prioritize clean air and mitigate effects of climate change
• Strengthen National Ambient Air Quality Standards (NAAQS) by setting an annual standard of 8 micrograms per cubic meter (µg/m3) and a daily standard of 25 µg/m3
• Reduce transportation-related emissions
• Limit emissions of nitrogen oxides (NOx) and greenhouse gases (GHG) from heavy-duty vehicles
• Transition to a clean energy economy through measures such as the EPA’s efforts to cut climate pollution from coal and natural gas-fired power plants
Improve access to health care and coverage of asthma guidelines-based care and treatments
• Adopt policies that prioritize Medicaid and Medicare expansion, affordable drugs and copayments, and coverage for people with preexisting conditions
• Remove prior authorization barriers and oppose step therapy for drug coverage that does not have adequate patient protections (which may force patients to take a drug that is not designed to treat their specific health circumstances, negatively impacting care)
Boost public awareness of asthma through dedicated awareness events
• Recognize May as National Asthma and Allergy Awareness Month
• Recognize the first Tuesday in May as World Asthma Day
• Recognize September as Asthma Peak Month
• Commit to reviewing the state of asthma annually in preparation for awareness events
Each year, AAFA asks the President to declare May to be National Asthma and Allergy Awareness Month. AAFA can also support proclamations for September Asthma Peak Month in your state. Contact info@aafa.org to work with AAFA on state and local proclamations!
Administered by the CDC, the National Asthma Control Program (NACP) is a program that awards competitive grants to states, territories and municipalities. This means the government gives funding to state and local health departments to help improve asthma surveillance (data collection), train health professionals, and educate people with asthma.
By working with state health departments on community-based care models, the NACP has been able to reduce the number of deaths, hospital stays, and emergency department visits. The program must have increased funding to continue this work with states and national organizations.
The NACP is currently only funded at $33.5 million which only allows it to fund 23 states, Puerto Rico, and Houston, Texas. For fiscal year 2024, AAFA requested an increase to $40 million. AAFA supports increased funding for NACP to sufficient levels that would allow all states and territories to have effective asthma control programs.
©2023 Asthma and Allergy Foundation of America 32 asthmacapitals.com
Health Care Providers
Prioritize asthma self-management education for patients
• Integrate principles of shared decision-making into practice
• Discuss environmental control at appointments and how to avoid asthma triggers such as tobacco smoke, mold, animal dander, dust mites, and air pollution
• Create an Asthma Action Plan with all asthma patients and tailor asthma management plans to meet patients where they are
• Incorporate interactive learning in the clinic to teach patients and caregivers how to recognize early warning signs and symptoms of asthma and the Green, Yellow, and Red Zones of an Asthma Action Plan
• Implement a way for patients and caregivers to report symptoms easily so that interventions are timely when a person is in the Yellow or Red Zone
• Discuss with patients and their caregivers what their asthma medicines are and why they are used (control, relief, or both)
• Teach patients and caregivers how to effectively use medicines and devices, and check the patient’s inhaler technique at each asthma appointment
Support patient navigation needs and research opportunities
• Assist patients with drug coverage questions, pre-authorizations, and insurance appeals
• Advocate for federal, state, and local policies that improve asthma care, health care access, and air quality
• Inform patients about opportunities to participate in clinical trials and patient-centered research
Address general health and well-being in people with asthma
• Create a plan to identify and co-manage comorbid conditions
• Encourage people with asthma to exercise and help them create a plan for managing and preventing exercise-induced symptoms
• Offer flu, COVID-19, and pneumococcal vaccinations
Provide referrals for additional care and services
• Refer patients to a specialist (e.g., allergist to conduct allergy testing; or an allergist or pulmonologist when a patient’s asthma is severe, persistent, or difficult to control)
• Refer patients to reputable local or national organizations that provide asthma support and education
• Refer patients to other health resources as needed (e.g., mental health or nutrition)
AAFA offers a variety of free continuing medical education (CME) programs for health care providers. The programs aim to expand provider knowledge on asthma and atopic diseases and associated treatment options, as well as provide resources for patient and caregiver support. Join live or watch on-demand later. to see the current programs available.
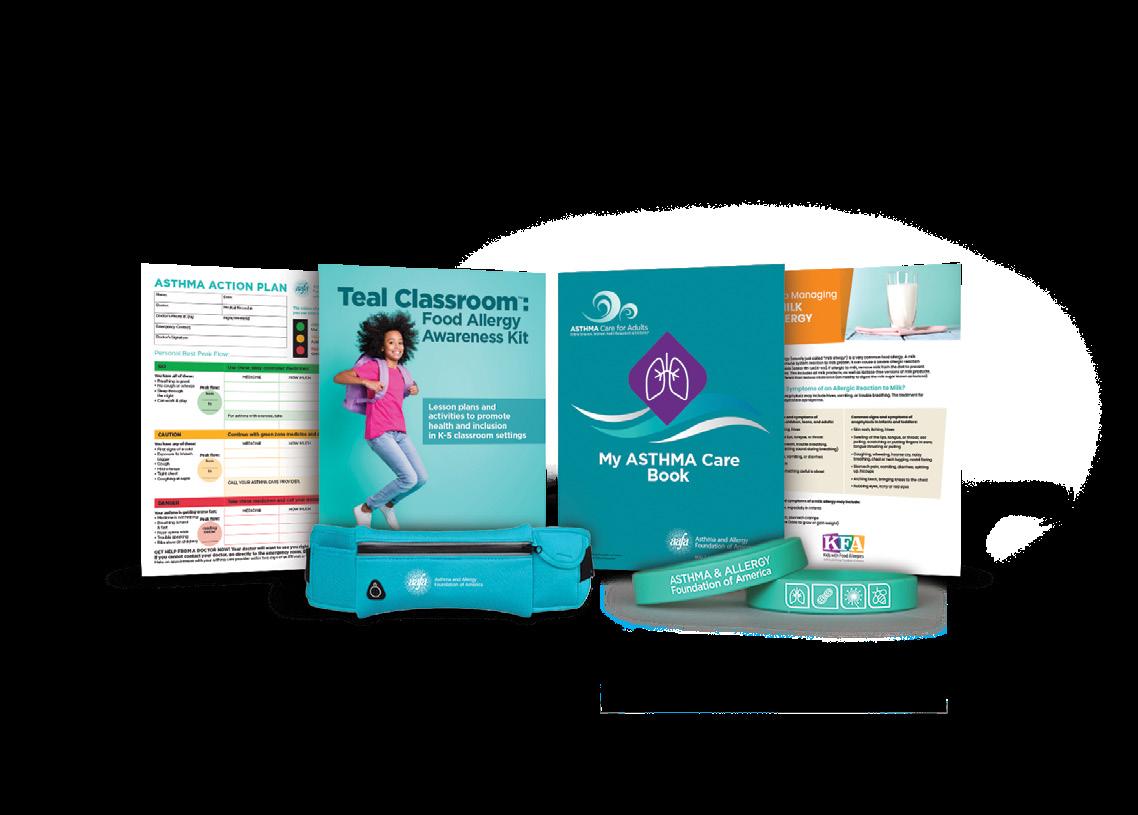
AAFA offers many asthma and allergy tools (including educational guides, handouts, kids’ activity books, etc.) that can be provided to patients and caregivers at the point of care. Visit aafa.org/store to place an order or call 1-800-7-ASTHMA for more information!
©2023 Asthma and Allergy Foundation of America 33 asthmacapitals.com
People with Asthma and Parents of Children with Asthma
Become empowered through education
• Take advantage of available education to help with asthma management
• Avoid asthma triggers at school, work, home, and outdoors (check your indoor environments for ways to reduce asthma triggers)
• Use inhaled corticosteroids and other prescribed medicines correctly (ask the nurse or doctor to check technique at every appointment)
• Ask for a referral to an asthma specialist if your asthma is difficult to control or severe and persistent
Take steps to improve air quality
• Become fire-wise to reduce wildfire risks
• Use CERTIFIED asthma & allergy friendly® products when you can to reduce exposure to allergens and asthma triggers (pillow encasements, vacuums, air cleaners, etc.)
• Establish the home as a smoke-free environment (for smokers—commit to quitting and sign up for a tobacco cessation program)
Take steps to reduce personal contributions to air pollution and climate change
• Walk or bike whenever possible
• Use public transportation or carpools
• Switch to cleaner energy if possible
• Reduce food waste
• Reduce meat consumption and replace with more plant-based meals
• Use LED lights and turn them off when not in use
• Use a smart thermostat to optimize your heating/cooling
• Reduce, reuse, recycle
• Reduce energy consumption
Advocate!
• Vote for asthma-friendly policies
• Speak at local city council meetings about asthma
• Spread asthma awareness on World Asthma Day and during National Asthma and Allergy Awareness Month in May
Sign up to receive AAFA’s Advocacy Action Alerts!
Would you like to help us advocate on behalf of people with asthma and allergies? Join our online community to receive Advocacy Action Alerts. Through the community, you’ll also be able to use our support forums, get alerts about other news, learn about research opportunities, and more.
©2023 Asthma and Allergy Foundation of America 34 asthmacapitals.com
Health Insurance Companies
Prioritize affordable access to asthma medicines
• Add all asthma medicines to formularies so every patient with asthma has access to the medicine their care provider prescribes
• Support drug pricing transparency and overhauling the rebate system so patients have access to affordable medicines which increases likelihood of adherence
• Include patient protections into any step therapy requirements so patients do not encounter delays and restricted access to medically necessary and effective drugs and treatments
Improve asthma care through expanded coverage
• Cover costs for asthma education and intervention programs (e.g., offer reimbursements for home visits by nurses and community health workers)
• Cover costs for multi-component environmental controls that reduce exposure to asthma triggers (e.g., air cleaners, carpet removal, allergen-barriers for bedding)
• Cover lung function tests and flu, COVID-19, and pneumonia vaccinations (at all locations and without pre-authorizations)
• Support tobacco cessation programs, tobacco prevention programs and vaping/e-cig interventions for teens and children
• Provide patient navigators to help people with asthma understand their coverage and care options
Commit to patient education and data collection
• Embed asthma education programs within patient portals
• Refer patients to an asthma education or intervention program after emergency visits
• Track asthma rates and the effectiveness of control measures so continuous improvements can be made in prevention efforts
Drug (Pharmaceutical) Companies
Increase commitment to asthma research
• Ensure diverse representation of patients in all clinical trial phases
• Implement patient-centered research design and include patients as equal advisors in all stages of drug development
• Study barriers to medicine adherence
• Commit to researching and addressing why older adults and Black women are at the highest risk of death from asthma
Help all patients access asthma treatments
• Offer patient financial assistance and co-pay support, especially for low-income patients
• Support drug pricing transparency and overhauling the rebate system so patients have access to affordable medicines which increases likelihood of adherence
• Improve access to pharmacological therapies by keeping prices affordable
• Improve drug labels to prioritize health literacy and user experience
Support patient education and advocate for better policies
• Advocate for federal, state, and local policies that improve asthma care
• Partner with patient advocacy groups and coalitions to mobilize patients and caregivers in support of better policies
• Fund patient education programs and awareness campaigns
©2023 Asthma and Allergy Foundation of America 35 asthmacapitals.com
Taking Action through Advocacy and Policy
Advocacy is a critical pillar of AAFA’s mission to save lives and reduce the burden of disease for people with asthma, allergies, and related diseases. In previous years, AAFA has used our Asthma Capitals reports to educate public officials on the challenges of living with asthma. We have primarily shared the reports with Congress to help promote policy solutions to improve the health and safety of people with asthma. This year, AAFA is calling on our community to join us in these advocacy efforts—including at the state and local level.
This report outlines significant risk factors that impact asthma outcomes as well as racial and ethnic disparities in those outcomes. There is no single policy solution to address the complex and structural issues the asthma community faces. AAFA therefore supports a “health in all policies” approach that recognizes the health implications of policy decisions in all sectors—including health, education, environment, labor, housing, social services, and city planning.
Keys areas of advocacy to improve asthma outcomes include:
Key Issues
Access to health care
Examples of Policy Strategies
Expand health insurance coverage for socioeconomically disadvantaged adults and children. Reduce drug costs for patients. Provide free vaccinations.
Economic stability
Implement tax policies that help low-income families accumulate more wealth.
Healthy schools
Reduce exposure to environmental triggers by improving school building conditions and improving air quality in and around schools. Improve school nurse-to-student ratios to ensure students have support to effectively manage their asthma and allergies.
Healthy homes
Reduce the use of building materials that contribute to poor indoor air quality. Promote green building principles. Support tenant’s rights to remediation of health hazards in rental properties. Build climate-resilient homes.
Physical environment
Combat environmental injustice and reduce exposure to pollution by strengthening clean air policies, reducing transportation-related emissions, restricting zoning of polluting sources, and transitioning to a clean energy economy. Support carbon reduction programs and other climate change mitigation strategies.
AAFA’s 2020 Asthma Disparities in America report outlines additional policy strategies in these categories that you can bring to your local, state, or federal representatives to initiate change in your community.
Your voice is critical to help build awareness in your community and to educate your elected officials who can lead change. On the following pages, we’ve included:
• Tips for identifying and contacting your state legislators
• Tips for requesting a meeting with your legislators
• Tips for communicating and advocating effectively
• Sample letter to your legislator
©2023 Asthma and Allergy Foundation of America 36 asthmacapitals.com
How to Advocate for People with Asthma to Lawmakers Find Your Legislators (Lawmakers)
If you live in one of the 50 states, you have one U.S. senator and one U.S. representative that represent you in the U.S. Congress. You also have legislators (state senators and representatives or assembly members) who represent your local district in your state’s government. You can find your senator and representative by going to openstates.org and entering your home address in the search bar. The results will include both your state and federal legislators. The state results will say either “upper” or “lower” chamber. Your state senator is a member of the upper chamber, and your state representative is a member of the lower chamber.
If you live in the District of Columbia or a U.S. territory, you can still use openstates.org to find your local representatives. You also have non-voting members of Congress at the federal level.
Call Your Legislator
Calling elected officials is an extremely easy and effective way to raise important issues. First, you will want to introduce yourself and let the staff member know that you are a constituent (someone who lives in their district). Do not be surprised if they ask for your zip code. This is because constituent concerns are prioritized. You will then want to briefly raise your concern or request for your legislator using our communication tips on page 39.
You may also ask to speak to the appropriate legislative assistant based on the topic. Here is a brief example: “Hi, my name is Jane Doe from Virginia, zip code 22202. As a mother of child with asthma, I am calling to encourage the senator to support legislation to combat environmental injustice in our community and to clean up polluting sources near our schools. Is there a legislative assistant who covers these types of issues that I could speak with?” You can also ask to talk about topics like access to medicines, health insurance, or funding for local asthma programs.
Write to Your Legislators
Writing to legislators is another advocacy tool you can use whether by physical mail or by email. Again, you will want to identify yourself as a constituent and make your request for support clear and concise at the beginning of the letter or email. You should then provide any relevant background information and personal stories related to the request. We have provided a sample letter in support of asthma policies on page 40
Request a Meeting with Legislators
The easiest way to request a meeting is by phone or email. Legislators all have public email addresses and/or contact forms on their websites. Using the tips above, contact your lawmaker’s office and request a meeting. You may need to be flexible on timing but be persistent. You will most likely meet with a member of staff and not the lawmaker themself.
Once a virtual or in-person meeting is scheduled, be prepared, on time, and concise. Review communication tips on page 39 prior to a meeting and be prepared with any additional background “leave-behind” materials, such as a copy of the Asthma Capitals report. It is also important to follow-up with a thank you note or email after the meeting.
©2023 Asthma and Allergy Foundation of America 37 asthmacapitals.com
Addressing Legislators
When addressing legislators in writing or in conversation, refer to the chart below:
State Senator
The Honorable (Full Name)
State Representative
The Honorable (Full Name)
Formal Address
(Name of State Legislature Upper Chamber)
(Address of State Legislature)
Salutation Dear Senator (Last Name)
(Name of State Legislature Lower Chamber)
(Address of State Legislature)
Dear “Mr./Ms./Mrs.” or “Representative” or “Assemblyman, Assemblywoman, Assemblymember” or “Delegate” (Last Name)
Conversation Senator (Last Name)
“Mr./Ms./Mrs.” or “Representative” or “Assemblyman, Assemblywoman, Assemblymember” or “Delegate” (Last Name)
Formal Address
United States Senator
The Honorable (Full Name)
United States Senate
Washington, DC 20510
United States Representative
The Honorable (Full Name)
United States House of Representatives
Washington, DC 20515
Salutation Dear Senator (Last Name) Dear “Mr./Ms./Mrs.” or “Representative” (Last Name)
Conversation Senator (Last Name)
“Congressman, Congresswoman” or “Representative” (Last Name)
Note: The names of upper and lower chambers of state legislatures vary by state. You can find information on your state legislatures by clicking on your state at congress.gov/state-legislature-websites
©2023 Asthma and Allergy Foundation of America
38 asthmacapitals.com
Tips for Communicating with Legislators and Their Staff
Legislators serve many constituents and address a wide range of policy issues. Here are some important points to keep in mind when communicating with legislators.
1. Remember that Legislators and Their Staff are Human Beings
• Conversations should not be argumentative or confrontational.
• In advocacy, respectful relationships build the foundation for change.
2. Share Personal Stories
• Personal stories are extremely powerful and are often remembered.
• Keep stories very brief (under two minutes) and tied to legislation and policy issues.
3. Identify Yourself as a Constituent
• Let your legislator know that you live in their district and identify yourself as a constituent.
• Legislators are more likely to focus on issues pertaining to their district and constituents.
4. Increase Number of Communications
• Advocates should craft key messages and consider asking friends and family to help in contacting legislators on important issues.
• The more communications a legislator receives about an issue the more likely they will act.
5. Repeat Your Main Points
• The frequency legislators hear about an issue plays a role in whether they favor a cause.
6. Keep Materials Brief, Straightforward, and Simple
• When sharing printed materials with a legislator, try to keep it to a one-page, bulleted fact sheet that reinforces the key points on the issue.
• Lengthy materials are often not read.
7. Clearly Communicate What You are Asking for
• Be specific on the action you want taken, such as support for a bill or policy. For example, you can say “I’m asking you to support Bill number XX because it will help improve health outcomes for people in our community.”
• Stay informed on where legislators stand on issues and actions they have taken.
8. Follow Up
• Thank legislators when they support the issue or take a public stance on it.
9. Share Media Coverage
• If a media story covers an issue you have previously raised with the legislator, share a copy of the article and remind them about the previous communication on the topic.
10. Take Notes
• Keep a record of your communications to maintain dialogues and foster relationships.
©2023 Asthma and Allergy Foundation of America 39 asthmacapitals.com
Sample Letter to Your Legislator
Dear [Legislator Title and Name]:
On behalf of the Asthma and Allergy Foundation of America (AAFA) and as your constituent, I am writing to encourage you to champion legislation to improve health outcomes for people with asthma in [your state name].
Approximately 27 million people in the U.S. have asthma and it is the leading chronic disease in children. Asthma causes your airways to become inflamed, making it hard to breathe. There is no cure for asthma. Over 3,500 people die each year from asthma—that’s about 10 people a day. These are preventable deaths.
Every year, AAFA releases its Asthma Capitals™ Report (www.asthmacapitals.com) which ranks the largest 100 U.S. metropolitan cities by how challenging they are to live in with asthma. This year, [your city name] ranked as the [your city’s ranking] most challenging city to live with asthma in the contiguous United States. This ranking is based on asthma prevalence, asthmarelated emergency department visits, and asthma-related deaths. The report also examines risk factors that can influence asthma outcomes: poverty, lack of health insurance, air pollution, poor indoor air quality, pollen allergy, medicine use, smoking, and access to asthma specialists.
Additionally, the burden of asthma falls disproportionately on the Black, Hispanic, and Indigenous populations in the United States. These groups have disproportionately high rates of poor asthma outcomes, including hospitalizations and deaths. In fact, as documented in AAFA’s 2020 Asthma Disparities in America Report (www.aafa.org/asthmadisparities), Black Americans are three times more likely to die from asthma than white Americans and five times more likely to be treated in an emergency room. Black women also have the highest death rates from asthma versus any other group.
To address the complex social and structural determinants of health that impact asthma outcomes, AAFA’s Asthma Disparities in America Report suggests 19 public policy solutions that I ask you to consider. These policy strategies aim to improve access to affordable, quality health care; promote economic stability; ensure safe learning environments for children; and address environmental harms that impact people with asthma.
Thank you for prioritizing the health of your constituents and I look forward to seeing improvements in asthma care and outcomes in our community.
Sincerely,
[Date]
©2023 Asthma and Allergy Foundation of America 40 asthmacapitals.com
[your name] [your home address, optional]
Methodology
The 2023 Asthma Capitals™ research and ranking is reported by the Asthma and Allergy Foundation of America (AAFA). The ranking is based on analysis of data from the 100 most-populated Metropolitan Statistical Areas (MSAs) in the contiguous 48 states as determined by the most recent U.S. Census Bureau population estimates (2021). The three (3) individual factors analyzed for the 2023 rankings are: estimated asthma prevalence; crude death rate from asthma; and emergency department visits due to asthma. Weights are applied to each factor and factors are not weighted equally. Total scores are calculated as a composite of all three factors, and cities are ranked from highest total score (city rank #1) to lowest total score (city rank #100).
Estimated Asthma Prevalence
For each MSA, AAFA estimated asthma prevalence using claims data for individuals who sought asthma care at any point in the 2022 calendar year. Data were obtained from the Komodo Health Prism Health Care Database for the most recent calendar year (2022). While this is not an exact measure of prevalence, it helps provide data that can be compared from city to city. Other prevalence estimates, such as those from the CDC, use self-reported data through surveys.
Crude Death Rate From Asthma
For each city, AAFA obtained the estimated asthma-related crude death rate per 100,000 people for the respective county using asthma ICD-10 codes as the underlying cause of death. Data were obtained from the CDC’s WONDER Online Database for the most recent 4-year period (2018-2021). Previous Asthma Capitals reports looked at the most recent 5-year data for mortality rates, but due to the CDC’s change from using bridge-race population estimates to “single-race” population estimates, statistics for the most recent data are only available for data years 2018 forward.
Emergency Department Visits Due to Asthma
For each MSA, AAFA obtained the total number of emergency department visits where an asthma ICD-10 code was included as a diagnosis. Data were obtained from the Komodo Health Prism Health Care Database for the most recent calendar year (2022). Emergency department visits were calculated per 10,000 asthma patients using prevalence estimates.
Risk Factors
Data on the following asthma-related risk factors were obtained and analyzed; however, these data did NOT factor into the scores or rankings. Data are from the most recently available calendar year(s).
• Annual Air Quality - Pollution levels and number of unhealthy outdoor ozone days, scored on a scale of A (best) to F (worst). Data were obtained from the American Lung Association 2023 State of the Air Report, which analyzed air quality monitoring data from 2019-2021.
• Medication Use – Number of long-term controller and quick-relief medication prescriptions per patient prevalence. Data were obtained from the Komodo Health Prism Health Care Database for the most recent calendar year (2022).
• Public Smoking Laws – Number of “100% smokefree” public smoking bans as of July 1, 2023. Data were obtained from the American Nonsmokers Rights Foundation.
• Poverty rate - Estimated population living in poverty. Data were obtained from the United States Census Bureau Small Area Income and Poverty Estimates (2021).
• Uninsured rate - Estimated population without health insurance. Data were obtained from the United States Census Bureau Small Area Health Insurance Estimates (2021).
• Access to specialists - The number of asthma specialists per patient prevalence. Data were obtained from the Komodo Health Prism Health Care Database for the most recent calendar year (2022).
©2023 Asthma and Allergy Foundation of America 41 asthmacapitals.com
Resources
Get general information on asthma: aafa.org/asthma
Get general information on allergies: aafa.org/allergies
Join AAFA’s patient support community for emotional support and asthma education: aafa.org/join
Follow our blog for news on asthma and allergies: aafa.org/blog
Find products to help you create a healthier home through our asthma & allergy friendly® Certification Program: aafa.org/certified
Learn how to improve your indoor air quality: aafa.org/iaq
Learn how to manage pollen allergies: aafa.org/pollen
Find school resources for managing your child’s asthma: aafa.org/school
Download an Asthma Action Plan: aafa.org/asthmaactionplan
AAFA’s Allergy Capitals™ Report: allergycapitals.com
AAFA’s COVID Resource Center: aafa.org/covid-19
Continuing Education for Health Care Professionals: aafa.org/ameo
AAFA’s Asthma Disparities Report: aafa.org/asthmadisparities
National Asthma and Allergy Awareness Month: aafa.org/awarenessmonth
Find an allergist or immunologist: allergist.aaaai.org/find
Follow the EPA’s air quality reports: airnow.gov
Follow daily local pollen counts: pollen.aaaai.org
American Lung Association’s State of the Air Report: stateoftheair.org
For help to quit or reduce smoking: smokefree.gov
cdc.gov/tobacco/quit_smoking
42
©2023 Asthma and Allergy Foundation of America
asthmacapitals.com
References
1. Sears, M. R., Johnston, N. W. (2007). Understanding the September asthma epidemic. Journal of Allergy and Clinical Immunology, 120(3), 526–529. https://doi. org/10.1016/j.jaci.2007.05.047
2. Mullen, A. (n.d.). Avoid the September Epidemic. National Jewish Health. https://www.nationaljewish.org/ conditions/health-information/health-infographics/ avoid-the-september-epidemic
3. Johnston, N. W., Johnston, S. L., Norman, G. R., Dai, J., Sears, M. R. (2006). The September epidemic of asthma hospitalization: School children as disease vectors. Journal of Allergy and Clinical Immunology, 117(3), 557–562. https://doi.org/10.1016/j.jaci.2005.11.034
4. National Center for Health Statistics. (2023). 2022 NHIS Adult Summary Health Statistics. U.S. Department of Health and Human Services. https://wwwn.cdc.gov/ NHISDataQueryTool/SHS_adult/index.html
5. National Center for Health Statistics. (2023). 2022 NHIS Child Summary Health Statistics. U.S. Department of Health and Human Services. https://wwwn.cdc.gov/ NHISDataQueryTool/SHS_child/index.html
6. Asthma and Allergy Foundation of America, (2020). Asthma Disparities in America: A Roadmap to Reducing Burden on Racial and Ethnic Minorities. https://www. aafa.org/asthmadisparities
7. Ferrante, G., & La Grutta, S. (2018). The Burden of Pediatric Asthma. Frontiers in Pediatrics, 6. https://doi.org/10.3389/ fped.2018.00186
8. Fleming, E., Afful, J. (2018). Prevalence of total and untreated dental caries among youth: United States, 2015–2016. NCHS Data Brief, no 307. https://www.cdc.gov/ nchs/products/databriefs/db307.htm
9. Agency for Healthcare Research and Quality. (2023). Healthcare Cost and Utilization Project (2020). U.S. Department of Health and Human Services, Centers for Disease Control and Prevention. https://www.cdc.gov/ asthma/healthcare-use/2020/table_a.html
10. Centers for Disease Control and Prevention. (2023). Most recent national asthma data. U.S. Department of Health and Human Services. https://www.cdc.gov/asthma/ most_recent_national_asthma_data.htm
11. National Center for Health Statistics. National Vital Statistics System: Mortality (2018-2021) U.S. Department of Health and Human Services, Centers for Disease Control and Prevention. https://wonder.cdc.gov/ucdicd10-expanded.html
12. Cloutier, M., Baptist, A., Blake, K., et al. 2020 Focused Updates to the Asthma Management Guidelines: A Report from the National Asthma Education and Prevention Program Coordinating Committee Expert Panel Working Group. The Journal of Allergy and Clinical Immunology. 2020;146(6):1217-1270. https://doi. org/10.1016/j.jaci.2020.10.003
13. World Health Organization. (2010). A conceptual framework for action on the social determinants of health. https://www.who.int/publications/i/ item/9789241500852
14. Centers for Disease Control and Prevention. (2023). Most recent national asthma data. U.S. Department of Health and Human Services. https://www.cdc.gov/asthma/ most_recent_national_asthma_data.htm
15. United States Environmental Protection Agency (2023). EJScreen Community Report. https://ejscreen.epa.gov/ mapper/
16. Office of the Assistant Secretary for Planning and Evaluation. (2023). HHS Poverty Guidelines for 2023. U.S. Department of Health and Human Services. https:// aspe.hhs.gov/topics/poverty-economic-mobility/ poverty-guidelines
17. Kaiser Family Foundation. (2023). Health Insurance Coverage of the Total Population. https://www.kff.org/ state-category/health-coverage-uninsured/healthinsurance-status/
18. Kaiser Family Foundation. (2020). The Effects of Medicaid Expansion under the ACA: Studies from January 2014 to January 2020. https://www.kff.org/report-section/ the-effects-of-medicaid-expansion-under-the-acaupdated-findingsfrom-a-literature-review-report/
19. Kaiser Family Foundation. (2022). Key Facts about the Uninsured Population. https://www.kff.org/uninsured/ issue-brief/key-facts-about-the-uninsured-population/
20. Kaiser Family Foundation. (2023). Status of State Medicaid Expansion Decisions: Interactive Map. https:// www.kff.org/medicaid/issue-brief/status-of-statemedicaid-expansion-decisions-interactive-map
21. Tiotiu, A. I., Novakova, P., Nedeva, D., et al. (2020). Impact of Air Pollution on Asthma Outcomes. International Journal of Environmental Research and Public Health, 17(17), 6212. https://doi.org/10.3390/ijerph17176212
22. American Lung Association. (2023). State of the Air Report 2023. https://www.lung.org/research/sota
43
©2023 Asthma and Allergy Foundation of America
asthmacapitals.com
23. Cleland, S. E.; Wyatt, L. H., et al. (2022) Short-term exposure to wildfire smoke and PM 2.5 and cognitive performance in a brain-training game: a longitudinal study of US adults. Environmental Health Perspectives. 2022;130(6). https://ehp.niehs.nih.gov/doi/full/10.1289/ EHP10498
24. Currie, K. (2023). 2022 Texas wildfire year worst in over a decade. KXAN. https://www.kxan.com/weather-trafficqas/2022-texas-wildfire-year-worst-in-over-a-decade
25. The News Herald (2022). ‘These heroes ran toward the danger’: Crews who battled Chipola Complex wildfires honored. Panama City News Herald. https://www. newsherald.com/story/news/local/chipola/2022/03/30/ florida-panhandle-first-responders-honoredbattling-bertha-swamp-adkins-avenue-star-avenuewildfires/7204289001/
26. Treisman, R. (2023). Maui’s wildfires are among the deadliest on record in the U.S. Here are some others. NPR. https://www.npr.org/2023/08/15/1193710165/mauiwildfires-deadliest-us-history
27. McArdle C.E., Dowling T.C., Carey K., et al. (2023). Asthma-Associated Emergency Department Visits During the Canadian Wildfire Smoke Episodes — United States, April– August 2023. Morbidity and Mortality Weekly Report. 72:926–932. https://www. cdc.gov/mmwr/volumes/72/wr/mm7234a5.htm?s_ cid=mm7234a5_w%0b
28. Meek H.C., Aydin-Ghormoz H., Bush K., et al. (2023). Notes from the Field: Asthma-Associated Emergency Department Visits During a Wildfire Smoke Event — New York, June 2023. Morbidity and Mortality Weekly Report. 72:933–935. https://www.cdc.gov/mmwr/volumes/72/ wr/mm7234a6.htm?s_cid=mm7234a6_w%0b
29. Centers for Disease Control and Prevention. (2023). FastStats - Allergies and Hay Fever. U.S. Department of Health and Human Services. https://www.cdc.gov/ nchs/fastats/allergies.htm
30. Climate Central. (2021). Pollen & Allergy Season. https:// www.climatecentral.org/climate-matters/pollenallergy-season
31. Anderegg, W. R. L., Abatzoglou, J. T., Anderegg, L. D. L., Bielory, L., Kinney, P. L., & Ziska, L. (2021). Anthropogenic climate change is worsening North American pollen seasons. Proceedings of the National Academy of Sciences, 118(7), e2013284118. https://doi.org/10.1073/ pnas.2013284118
32. Climate Central. (2023). Seasonal allergies: pollen and mold. https://assets.ctfassets.net/ cxgxgstp8r5d/6HEq6ZLb0QpvXxScvaM7sc/ ae3024a9c4f2bcdd9b563d09b1bd07c3/ FINALSeasonal_allergies_pollen_and_mold_2023__ EN_.pdf
33. Ziska, L. H., Gebhard, D. E., et al. (2003). Cities as harbingers of climate change: Common ragweed, urbanization, and public health. Journal of Allergy and Clinical Immunology, 111(2), 290–295. https://doi. org/10.1067/mai.2003.53
34. Centers for Disease Control and Prevention. (2022). Asthma and Secondhand Smoke. U.S. Department of Health and Human Services. https://www.cdc.gov/ tobacco/campaign/tips/diseases/secondhandsmoke-asthma.html
35. Patra, K. (2017). Tobacco and Children with Asthma. American Academy of Pediatrics. https://www. healthychildren.org/English/health-issues/conditions/ tobacco/Pages/Tobacco-and-Children-with-Asthma. aspx
36. Centers for Disease Control and Prevention. (2021). Health Effects of Cigarette Smoking. U.S. Department of Health and Human Services. https://www.cdc.gov/ tobacco/data_statistics/fact_sheets/health_effects/ effects_cig_smoking
37. Matt, G. E., et al. “Thirdhand Tobacco Smoke: Emerging Evidence and Arguments for a Multidisciplinary Research Agenda.” Environmental Health Perspectives, vol. 119, no. 9, 2011, pp. 1218–26. Crossref, doi:10.1289/ ehp.1103500.
38. Anderson, W., Gondalia, R., Hoch, H., Kaye, L., Szefler, S., & Stempel, D. (2019). Screening for inhalation technique errors with electronic medication monitors. The Journal of Allergy and Clinical Immunology: In Practice, 7(6), 2065–2067. https://doi.org/10.1016/j.jaip.2019.02.006
39. Coutinho, M. T., Subzwari, S. S., McQuaid, E. L., & KoinisMitchell, D. (2020). Community Health Workers’ Role in Supporting Pediatric Asthma Management: A Review. Clinical practice in pediatric psychology, 8(2), 195–210. https://doi.org/10.1037/cpp0000319
40. NACHW’s policy platform can be found at https:// nachw.org/2021/03/01/nachw-national-policyplatform
©2023 Asthma and Allergy Foundation of America 44 asthmacapitals.com
1235 South Clark Street • Suite 305 • Arlington, VA 22202 800-7-ASTHMA (800-727-8462) • aafa.org ©2023 Asthma and Allergy Foundation of America
