2024 Allergy Capitals™
Overall Rankings ■ Worse Than Average ▲ Average ● Better Than Average (Factors are not weighted equally. Total scores are rounded for the purposes of this chart.) 2024 Overall Ranking Overall Metropolitan Area Total Score (Avg. 75.49) Subtotal: All Pollen Subtotal: Medicine Use Subtotal: Specialists 1 ■ Wichita, KS 100.00 ▲ ■ ■ 2 ■ Virginia Beach, VA 87.43 ■ ■ ▲ 3 ■ Greenville, SC 87.34 ▲ ■ ▲ 4 ■ Dallas, TX 87.21 ■ ■ ▲ 5 ■ Oklahoma City, OK 86.83 ■ ■ ▲ 6 ■ Tulsa, OK 86.35 ■ ■ ▲ 7 ■ Richmond, VA 84.20 ▲ ■ ● 8 ■ Des Moines, IA 84.15 ▲ ▲ ■ 9 ■ Raleigh, NC 84.03 ▲ ■ ■ 10 ■ Fayetteville, AR 82.93 ▲ ■ ▲ 11 ■ Allentown, PA 82.83 ▲ ■ ▲ 12 ■ Baton Rouge, LA 82.66 ■ ▲ ▲ 13 ■ Sarasota, FL 82.34 ▲ ■ ▲ 14 ■ Houston, TX 81.93 ■ ▲ ▲ 15 ■ Columbia, SC 81.91 ▲ ■ ▲ 16 ■ Orlando, FL 81.07 ▲ ■ ▲ 17 ■ Little Rock, AR 81.02 ▲ ■ ● 18 ■ Chattanooga, TN 80.86 ▲ ■ ● 19 ■ Greensboro, NC 80.62 ▲ ■ ■ 20 ■ Kansas City, MO 80.41 ▲ ▲ ▲ 21 ■ Toledo, OH 80.22 ▲ ▲ ■ 22 ■ El Paso, TX 80.05 ▲ ▲ ■ 23 ■ Omaha, NE 79.69 ■ ▲ ● 24 ■ San Antonio, TX 79.67 ■ ● ▲ 25 ■ Colorado Springs, CO 79.44 ▲ ▲ ● 26 ■ Memphis, TN 79.29 ▲ ■ ▲ 27 ■ Buffalo, NY 79.21 ▲ ■ ▲ 28 ■ Baltimore, MD 79.03 ▲ ▲ ▲ 29 ■ Knoxville, TN 79.01 ▲ ■ ● 30 ▲ Jackson, MS 78.94 ▲ ■ ● 31 ▲ Worcester, MA 78.92 ▲ ▲ ■ 32 ▲ Nashville, TN 78.72 ▲ ■ ● 33 ▲ Lakeland, FL 78.69 ▲ ▲ ■ 34 ▲ New Orleans, LA 78.56 ▲ ■ ● 35 ▲ Las Vegas, NV 78.40 ▲ ▲ ■ 36 ▲ Daytona Beach, FL 78.36 ▲ ■ ▲ 37 ▲ Palm Bay, FL 78.25 ▲ ■ ▲ 38 ▲ San Diego, CA 78.16 ■ ● ▲ ©2024 Asthma and Allergy Foundation of America 5 allergycapitals.com
Overall Rankings ■ Worse Than Average ▲ Average ● Better Than Average (Factors are not weighted equally. Total scores are rounded for the purposes of this chart.) 2024 Overall Ranking Overall Metropolitan Area Total Score (Avg. 75.49) Subtotal: All Pollen Subtotal: Medicine Use Subtotal: Specialists 39 ▲ New Haven, CT 78.01 ▲ ▲ ▲ 40 ▲ Providence, RI 77.81 ▲ ▲ ▲ 41 ▲ Tampa, FL 77.71 ▲ ■ ▲ 42 ▲ Grand Rapids, MI 77.46 ▲ ▲ ▲ 43 ▲ Hartford, CT 77.30 ▲ ▲ ▲ 44 ▲ Cape Coral, FL 77.12 ▲ ▲ ▲ 45 ▲ Charleston, SC 77.06 ▲ ■ ▲ 46 ▲ Rochester, NY 76.97 ▲ ▲ ● 47 ▲ Winston-Salem, NC 76.55 ▲ ■ ▲ 48 ▲ Miami, FL 76.44 ▲ ▲ ▲ 49 ▲ Albany, NY 76.09 ▲ ▲ ▲ 50 ▲ Augusta, GA 75.90 ● ■ ▲ 51 ▲ Syracuse, NY 75.79 ▲ ▲ ▲ 52 ▲ Pittsburgh, PA 75.68 ▲ ■ ▲ 53 ▲ Portland, OR 75.53 ▲ ● ■ 54 ▲ Austin, TX 75.44 ■ ● ● 55 ▲ Charlotte, NC 75.40 ▲ ■ ▲ 56 ▲ McAllen, TX 75.31 ▲ ● ■ 57 ▲ Philadelphia, PA 75.07 ▲ ▲ ● 58 ▲ Poughkeepsie, NY 74.98 ▲ ▲ ▲ 59 ▲ Denver, CO 74.46 ▲ ▲ ● 60 ▲ Spokane, WA 74.35 ▲ ● ▲ 61 ▲ Cincinnati, OH 73.78 ▲ ▲ ● 62 ▲ Durham, NC 73.44 ▲ ● ▲ 63 ▲ Birmingham, AL 73.40 ● ■ ▲ 64 ▲ Harrisburg, PA 73.27 ▲ ■ ● 65 ▲ Riverside, CA 72.73 ▲ ● ■ 66 ▲ Dayton, OH 72.69 ▲ ▲ ▲ 67 ▲ Detroit, MI 72.45 ▲ ● ● 68 ▲ Bridgeport, CT 72.43 ▲ ▲ ● 69 ▲ Boston, MA 72.38 ▲ ▲ ● 70 ▲ Minneapolis, MN 72.38 ▲ ● ▲ 71 ● Jacksonville, FL 72.23 ● ■ ▲ 72 ● Chicago, IL 72.19 ▲ ● ● 73 ● Milwaukee, WI 71.61 ▲ ● ▲ 74 ● Indianapolis, IN 71.56 ▲ ▲ ▲ 75 ● Oxnard, CA 71.34 ▲ ● ▲ 76 ● St. Louis, MO 71.17 ● ■ ● 77 ● Boise, ID 70.95 ▲ ▲ ▲ 78 ● Fresno, CA 70.25 ▲ ● ▲ ©2024 Asthma and Allergy Foundation of America 6 allergycapitals.com
What Happened to Scranton?
As recently as 2022, Scranton, Pennsylvania, was the #1 Allergy Capital in the United States. Last year, Scranton came in at #3. This year, they are not found on the Allergy Capitals list. Why? It would be great if conditions improved for people in Scranton with allergies and it no longer ranked on the list. But that is not the case.
The Allergy Capitals ranking is based on data from the 100 most-populated Metropolitan Statistical Areas (MSAs) in the contiguous 48 states. The population counts come from the most recent U.S. Census Bureau population estimates (2022). As of 2022, Scranton is no longer a top 100 most-populated MSA. Instead, it has been replaced by Fayetteville, Arkansas.
Even though Scranton is no longer in the Allergy Capitals ranking, allergies are still a heavy burden for people living there. If Scranton was still in the top 100 most-populated MSAs and included in the report, it’s ranking this year would be #2. Scranton scores higher than average for both grass pollen and weed pollen. It also has a low number of allergy specialists compared to the number of people with allergies in the area. As illustrated by Scranton, people in cities of all sizes experience challenges living with allergies.
Overall Rankings ■ Worse Than Average ▲ Average ● Better Than Average (Factors are not weighted equally. Total scores are rounded for the purposes of this chart.) 2024 Overall Ranking Overall Metropolitan Area Total Score (Avg. 75.49) Subtotal: All Pollen Subtotal: Medicine Use Subtotal: Specialists 79 ● Springfield, MA 69.96 ▲ ▲ ▲ 80 ● Ogden, UT 69.76 ▲ ● ■ 81 ● San Francisco, CA 69.48 ▲ ● ● 82 ● Louisville, KY 69.45 ● ■ ● 83 ● Atlanta, GA 69.08 ● ▲ ▲ 84 ● Provo, UT 68.87 ▲ ● ■ 85 ● Los Angeles, CA 68.46 ▲ ● ▲ 86 ● Salt Lake City, UT 68.35 ▲ ● ▲ 87 ● New York, NY 67.75 ▲ ● ● 88 ● Seattle, WA 67.47 ▲ ● ▲ 89 ● Washington, DC 67.37 ● ▲ ● 90 ● Columbus, OH 67.34 ● ▲ ● 91 ● Bakersfield, CA 67.26 ▲ ● ■ 92 ● Tucson, AZ 66.95 ● ▲ ▲ 93 ● Stockton, CA 66.03 ▲ ● ■ 94 ● Sacramento, CA 65.14 ▲ ● ▲ 95 ● Phoenix, AZ 64.52 ● ● ▲ 96 ● Cleveland, OH 64.42 ▲ ● ● 97 ● San Jose, CA 62.76 ▲ ● ● 98 ● Madison, WI 62.66 ● ● ● 99 ● Albuquerque, NM 60.49 ● ■ ▲ 100 ● Akron, OH 60.18 ● ● ▲ ©2024 Asthma and Allergy Foundation of America 7 allergycapitals.com
About Allergic Rhinitis
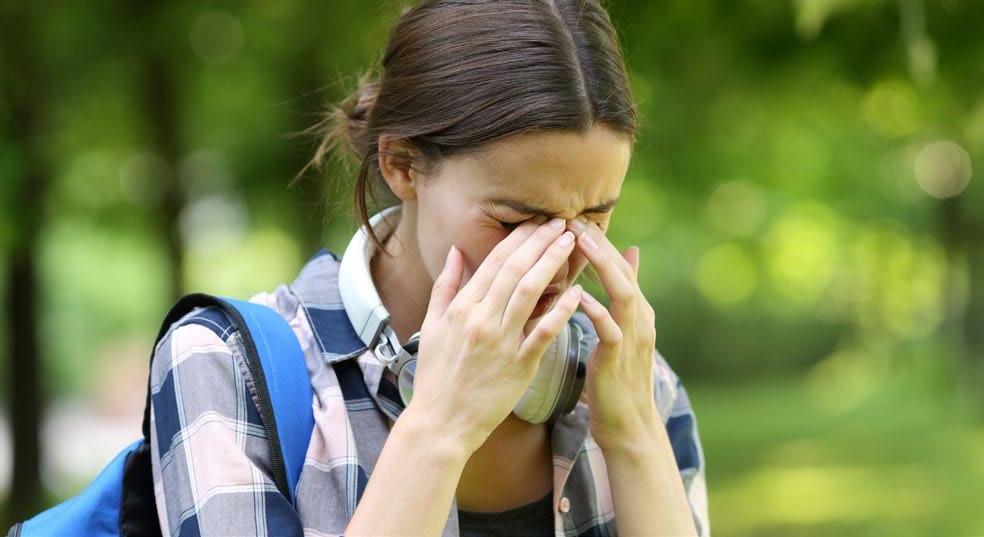
One of the most common allergic conditions is seasonal allergic rhinitis, sometimes called “hay fever” or “nasal allergies.” About 1 out of 4 adults and 1 out of 5 children have seasonal allergic rhinitis.1,2 It causes symptoms such as:
• Runny nose (also known as rhinorrhea – usually a thin, clear discharge)
• Stuffy nose (due to blockage or nasal congestion)
• Sneezing
• Red and watery eyes
• Itchy nose, eyes, ears, or mouth
• Swelling around the eyes
Symptoms of seasonal allergic rhinitis occur most often in spring, summer, and/or fall due to pollen allergy.

About Allergic Asthma
Many people with asthma also have allergies. Allergies can trigger or worsen asthma. This is called allergic asthma. Allergic asthma is most common in early childhood and steadily decreases through adulthood.
The common signs and symptoms of allergic asthma are the same as other types of asthma:
• Shortness of breath
• Cough
• Chest tightness or pain
• Wheeze (a whistling sound when you breathe)
• Waking at night due to asthma symptoms
• A drop in lung function
Asthma may lead to a medical emergency. During times of high pollen counts, more people have asthma emergencies.
©2024 Asthma and Allergy Foundation of America 8 allergycapitals.com


The Role of Climate Change
Climate change is leading to longer and more intense allergy seasons.4,5,6 Trees are releasing pollen earlier in the year. Research shows pollen seasons now start 20 days earlier, and last 10 days longer, compared to 30 years ago.7,8 With less snow and warmer temperatures, plants start growing sooner. Research also shows the end of the tree pollen season has remained largely unchanged. This means trees are releasing pollen for longer periods than in the past. Longer growing seasons increase exposure to pollen allergens that trigger asthma and allergic responses.9
Additionally, the amount of pollen released by trees appears to be higher and its allergenicity appears to be stronger than in the recent past. Allergenicity means the strength of the allergic response to pollen. Researchers found that increased carbon dioxide (CO2) gas in the air is linked to greater pollen production by trees. In other words, warmer temperatures mean plants start growing sooner and they produce a greater quantity of more highly allergenic pollen in response to rising CO2 concentrations in the atmosphere.
Researchers say that climate change is responsible for about 50% of the increase in pollen seasons and about 8% of the increase in pollen concentrations. Pollen particles in the air have known health effects, especially in the lungs and airways. Previous research has shown that increased pollen can have negative effects on allergies and asthma, viral infections, school performance, and emergency room visits.5
Tree Pollination and “Botanical Sexism”
Trees are effective tools at helping regulate climate. Many trees are monoecious, which means they have pollinating flowers and fruit-, seed-, and nut-bearing flowers on the same plant. But there are some fruit-, seed-, and nut-bearing trees that do not release pollen (these are called “female” trees). These trees rely on small animals and insects to transfer pollen. Other trees release pollen but do not produce fruit, seeds, or nuts (these are called “male” trees). They rely on the wind to carry pollen to other trees for pollination.
Wind-pollinating Trees
Sometimes called “male” trees
Release pollen but do not produce fruit, seeds, or nuts
Rely on the wind to carry pollen to other trees for pollination
Historically used by city planners because they don’t produce seeds, fruits, or pods
Fruiting Trees
Sometimes called “female” trees
Produce fruit, seeds, or nuts but do not release pollen
Rely on small animals and insects to transfer pollen
Increasingly used in tree planting events to help reduce the amount of pollen in the air ©2024
Asthma and Allergy Foundation of America 11 allergycapitals.com
More wind-pollinating trees can lead to increased pollen production. Since 1990, pollen seasons have 21% more pollen. Tree pollen levels saw bigger increases than grass or weed pollen.8
“Botanical sexism” (the preference to plant “male” trees), may be partly to blame for the increase in tree pollen. Historically, many urban planners have chosen wind-pollinating (“male”) trees instead of fruiting (“female”) trees when designing communities, streets, and parks. This practice leads to more pollen in cities and experts believe this is part of the reason why pollen counts have been increasing.10
Diversifying the types of trees in parks and urban areas may help reduce the amount of pollen in the air. Planting more female trees may help regulate surface temperature while also reducing the amount of pollen in nearby areas.
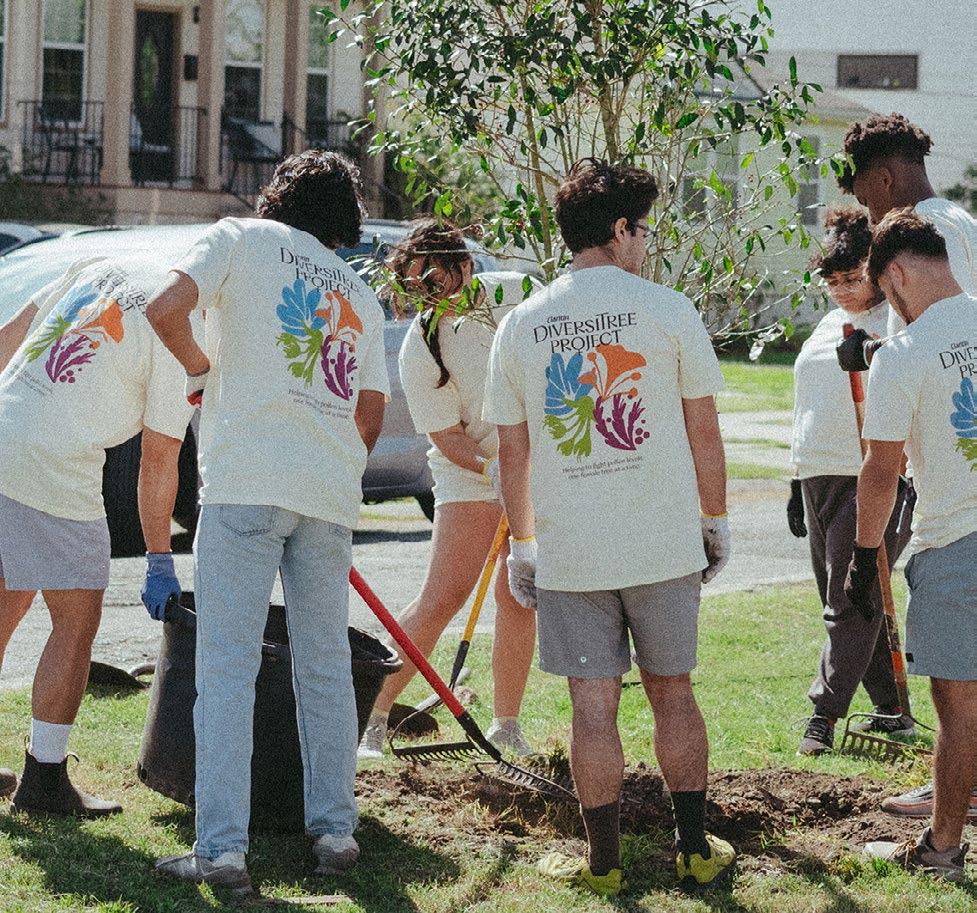
Claritin’s DiversiTree Project
Did you know that male trees produce pollen and female trees produce seeds?
In 1949, the USDA provided city planting guidance dictating that “only male trees should be planted.” This mandate led to an increase in pollen levels, expected to double by 2040. To help reverse this trend of planting male trees that’s contributed to allergies for the last 75 years, Bayer launched the Claritin DiversiTree Project in 2023.
Today, all types of allergies affect over 30% of adults and 40% of kids in the United States. This is why Claritin is extending its mission by planting more female trees where kids need it the most—schools, parks, and playgrounds. Claritin is undertaking this initiative because they believe the world would be better if we could live as if we don’t have allergies.

12 allergycapitals.com
©2024
Asthma and Allergy Foundation of America
Grass Pollen
Grasses cause most late spring and summer pollen allergy symptoms. Grass pollen is most common from April through early June.11 But grass pollen can also be found year-round in warmer parts of the country such as California, Texas, and throughout the south. Grass pollen season can overlap with tree pollen or weed pollen seasons in many cases.
When you have a grass pollen allergy, you will only have symptoms when the pollen you are allergic to is in the air. Even though there are hundreds of types of grasses, only a few cause allergy symptoms. The most common grasses that cause allergy symptoms are:
• Bahia • Johnson • Rye
• Bermuda • Kentucky blue • Sweet vernal
• Fescue • Orchard • Timothy
Did You Know?
Pollen may be responsible for allergic reactions to fruits or vegetables. Symptoms of an allergic reaction (like itchiness) in your mouth or throat when eating certain fruits, vegetables, or nuts may be related to pollen food allergy syndrome (PFAS), also called oral allergy syndrome (OAS). PFAS occurs because the proteins in some fruits, vegetables, and nuts are similar to some pollen, and your immune system can’t tell the difference. Birch, alder, and ragweed pollen cause many PFAS reactions. If you think you may have PFAS, talk with an allergist.
13
©2024 Asthma and Allergy Foundation of America
2023, San
“low”
Powered by Pollen Sense Technology 0 2000 4000 6000 8000 Jan-23 Feb-23 Mar-23 Apr-23 May-23 Jun-23 Grains per meter 3 Tree Pollen - Dallas, TX and Albuquerque, NM Dallas, TX Albuquerque, NM 0 50 100 150 200 250 Mar-23 Apr-23 May-23 Jun-23 Jul-23 Aug-23 Grains per meter 3
Pollen - San Diego, CA and Columbus, OH San Diego, CA Columbus, OH 0 1000 2000 3000 Jul-23 Aug-23 Sep-23 Oct-23 Nov-23 Dec-23 Grains per meter 3 Weed Pollen - Milwaukee, WI and McAllen, TX Milwaukee, WI McAllen, TX
In
Diego, CA had many peaks of grass pollen from April to August. Overall, San Diego had 216 days that were in the “high” range for grass pollen, as determined by existing risk scales for grass pollen. In Columbus, OH, grass pollen had peaks in April, June, and August, but overall had 200 days of the year in the
range.
Grass
allergycapitals.com
Weed Pollen
When it comes to weed pollen allergies, ragweed pollen is the worst offender. Ragweed allergy is the most common weed pollen allergy. About 1 in 7 people are allergic to ragweed pollen.12 Ragweed is an invasive annual weed that grows throughout the United States in areas that have been disturbed by human activity. Ragweed populations are expanding and are particularly high in the Eastern and Midwestern states.
One ragweed plant can produce billions of light, dry pollen grains, which can then travel for hundreds of miles. Depending on your location, ragweed season may last 6 to 10 weeks, peaking in mid-September in most areas in the United States.
Other weed pollen can cause symptoms as well. These plants cause the most pollen allergy symptoms in the fall:
• Burning bush • Mugwort • Russian thistle
• Cocklebur • Pigweed • Sagebrush
• Lamb’s-quarters • Ragweed • Tumbleweed
Weed pollen is prevalent in all 100 cities in our report. In fact, ragweed grows in every state except Alaska. Weed pollen is produced throughout the year, peaking around September. In 2023, Milwaukee, WI, had the highest sum of “high” and “very high” days for weed pollen, as determined by existing risk scales for weed pollen.
the lowest number. Powered by Pollen Sense Technology 0 Jan-23 Feb-23 Mar-23 Apr-23 May-23 Jun-23 Grains 0 50 100 150 200 250 Mar-23 Apr-23 May-23 Jun-23 Jul-23 Aug-23 Grains per meter 3
Pollen - San Diego, CA and
0 1000 2000 3000 Jul-23 Aug-23 Sep-23 Oct-23 Nov-23 Dec-23 Grains per meter 3
Pollen - Milwaukee, WI and McAllen, TX Milwaukee,
©2024 Asthma and Allergy Foundation of America 14 allergycapitals.com
McAllen, TX, had
Grass
Columbus, OH San Diego, CA Columbus, OH
Weed
WI McAllen, TX
Pollen Counting
Pollen reports are valuable tools in helping people manage their seasonal allergies. But not all reports are equal. Some reports are pollen counts and some are pollen forecasts. Pollen counts are taken from samples of pollen at monitoring sites (using pollen counters or sensors) and are based on actual data. Pollen forecasts are predictions of expected pollen counts based on historical data.
While pollen forecasts can be helpful, pollen counts are more accurate. The National Allergy Bureau (NAB), affiliated with the American Academy of Allergy, Asthma & Immunology (AAAAI), is the most well-known resource for pollen counts in the United States. The NAB has a network of pollen monitoring sites across the United States.
Pollen monitoring sites can be helpful for many purposes, such as helping diagnose and treat allergies, studying the impact of climate change, and producing crop forecasts.13,14 Most pollen counting sites use manual systems, where pollen is collected and placed on a microscopic slide and then counted by hand. Manual systems are the standard. But it can take up to 9 days for counts to be published.13 Another limitation with manual pollen counting sites is that many places across the U.S. don’t have stations.
More recently, automated pollen sensors are available for capturing pollen data. Automated sensors may reach areas manual counting cannot. Though this is a relatively new technology, pollen sensors continue to improve. There are several ways automated sensors can work, including using digital images or electric signals.14 Automated pollen counting allows pollen information to be captured in a reliable and timely manner. They can produce hourly counts instead of daily counts.13
Automated sensors also help remove some of the challenges that come with manual counting, like differences between counters, inaccurate samples caused by changes in airflow, and uncertainty with low pollen concentrations.15
Pollen in Alaska and Hawaii
Based on local data, we know that Alaska and Hawaii have pollen seasons that are likely different from the rest of the United States. Alaska is the only state that is not impacted by ragweed, but has large bursts of tree, grass, and other weed pollen during its short growing seasons. Hawaii has a wide variety of pollen-producing plants, and warm temperatures allow for year-long plant growth. However, Alaska and Hawaii are often not included in national pollen monitoring systems. These states instead rely on local efforts to collect and analyze pollen data or use pollen forecasts to make estimates based on historical data. AAFA supports efforts to include these states in pollen surveillance systems, which is needed to accurately compare pollen data across the entire United States.
©2024 Asthma and Allergy Foundation of America 15 allergycapitals.com
AK HI
Methodology
The 2024 Allergy Capitals™ research and ranking is reported by the Asthma and Allergy Foundation of America (AAFA). The ranking is based on analysis of data from the 100 most-populated Metropolitan Statistical Areas (MSAs) in the contiguous 48 states as determined by the most recent U.S. Census Bureau population estimates (2022). The individual factors analyzed for the 2024 rankings are pollen scores for tree, grass, and weed pollen, over-thecounter medication use (allergy), and number of allergy specialists.
For each factor, AAFA used the most recently available 12-month data. Weights are applied to each factor; factors are not weighted equally. Total scores are calculated as a composite of all four factors, and cities are ranked from highest total score (city rank #1) to lowest total score (city rank #100). Cities are assigned icons for ■ worse than average, ▲ average, and ● better than average. Icons were assigned based on 0.5 standard deviation from the average.
Pollen Scores
For each MSA, AAFA obtained daily pollen counts for each growth form (tree, grass, and weed) for the most recent calendar year (2023). Data were obtained from Pollen Sense, LLC Automated Particulate Sensors (APS). These sensors automatically image particulate matter collected from ambient air and use a neural network algorithm to identify individual pollen species and calculate daily pollen counts. Using these daily pollen counts, AAFA calculated the number of days each MSA had within the “high” or “very high” levels for each growth form, as determined by existing risk scales for each type. “Very high” days had a higher weight than “high” days for the final calculation of pollen scores.
Medication Use
For each MSA, AAFA obtained over-the-counter sinus and allergy medication sales data. Data were obtained from the Circana Medication Sales Database for the most recent calendar year (2023). Medicine use estimates were calculated per 10,000 allergy patients using the most recent prevalence estimates.
Number of Allergy Specialists
For each MSA, AAFA obtained the number of board-certified allergists/immunologists. Data were obtained from the Komodo Health Prism Health Care Database for the most recent calendar year (2023). Availability of allergy/immunology specialists per patient population was calculated using the most recent prevalence estimates.
Limitations
Data presented in this report have limitations that AAFA would like to acknowledge. Estimates for pollen and medicine use are limited in Alaska and Hawaii; therefore, data in these states are not included in this report. Estimates for prevalence included in the calculations for medicine use and specialist access were gathered from the most recent national data. There are no comprehensive prevalence data for seasonal allergy at the MSA or county level. More localized data are needed to get a better sense of medicine and health care use per patient population within each city. Additionally, pollen scores were calculated using existing scales for tree, grass, and weed pollen levels. Standardized risk levels for pollen collected by automated sensors have not yet been established. Additionally, pollen data were analyzed by how many days a city had pollen counts above the “high” and “very high” thresholds. However, this calculation does not account for how much higher above these thresholds the data can go, and some cities with pollen counts much higher than these thresholds can get diluted. Pollen data also do not account for the allergenicity of pollen or for population sensitivity to pollen. Finally, our medication sales data uses only estimates for over-the-counter allergy medication sales. While many people use over-the-counter medicine for pollen allergies, the data may not capture individuals who use only prescription medicines for allergies. Additionally, this category of medicine includes over-thecounter decongestants, which may be used for other purposes, such as colds.
©2024 Asthma and Allergy Foundation of America 16 allergycapitals.com
References
1. Ng, A.E. & Boersma, P. (2023). NCHS Data Brief, no 460: Diagnosed allergic conditions in adults: United States, 2021. National Center for Health Statistics. https://dx.doi. org/10.15620/cdc:122809
2. Zablotsky, B., Black, L.I., & Akinbami, L.J.(2023). NCHS Data Brief, no 459: Diagnosed allergic conditions in children aged 0-17 years: United States, 2021. National Center for Health Statistics. https://dx.doi.org/10.15620/ cdc:123250
3. Lo, F., Bitz, C.M., Battisti, D.S., & Hess, J.J. (2019). Pollen calendars and maps of allergenic pollen in North America. Aerobiologia, 35(4), 613–633. https://doi. org/10.1007/s10453-019-09601-2
4. Barnes, C. S. (2018). Impact of climate change on pollen and respiratory disease. Current Allergy and Asthma Reports, 18(11). https://doi.org/10.1007/s11882018-0813-7
5. Poole, J. A., Barnes, C. S., Demain, J. G., Bernstein, J.A., Padukudru, M. A., Sheehan, W. J., Fogelbach, G. G., Wedner, J., Codina, R., Levetin, E., Cohn, J. R., Kagen, S., Portnoy, J. M., & Nel, A. E. (2019). Impact of weather and climate change with indoor and outdoor air quality in asthma: A work group report of the AAAAI Environmental Exposure and Respiratory Health Committee. Journal of Allergy and Clinical Immunology, 143(5), 1702–1710. https://doi.org/10.1016/j. jaci.2019.02.018
6. Ziska, L. H., Makra, L., Harry, S. K., Bruffaerts, N., Hendrickx, M., Coates, F., Saarto, A., Thibaudon, M., Oliver, G., Damialis, A., Charalampopoulos, A., Vokou, D., Heidmarsson, S., Gudjohnsen, E., Bonini, M., Oh, J.-W., Sullivan, K., Ford, L., Brooks, G. D., & Myszkowska, D. (2019). Temperature-related changes in airborne allergenic pollen abundance and seasonality across the northern hemisphere: A retrospective data analysis. The Lancet Planetary Health, 3(3), e124–e131. https://doi.org/10.1016/ S2542-5196(19)30015-4
7. Anderegg, W. R. L., Abatzoglou, J. T., Anderegg, L. D. L., Bielory, L., Kinney, P. L., & Ziska, L. (2021). Anthropogenic climate change is worsening North American pollen seasons. Proceedings of the National Academy of Sciences, 118(7), e2013284118. https://doi.org/10.1073/ pnas.2013284118
8. Climate Central. (2023). Seasonal allergies: pollen and mold. https://assets.ctfassets.net/ cxgxgstp8r5d/6HEq6ZLb0QpvXxScvaM7sc/ ae3024a9c4f2bcdd9b563d09b1bd07c3/ FINALSeasonal_allergies_pollen_and_mold_2023__ EN_.pdf
9. Schmidt, C. W. (2016). Pollen overload: Seasonal allergies in a changing climate. Environmental Health Perspectives, 124(4). https://doi.org/10.1289/ehp.124-a70
10. Ogren, T. L. (2015, April 29). Botanical Sexism Cultivates Home-Grown Allergies. Scientific American Blog Network. https://blogs.scientificamerican.com/ guest-blog/botanical-sexism-cultivates-homegrown-allergies/
11. American Academy of Allergy, Asthma, & Immunology. (2022). Mowing Down Your Grass Allergies. https://www.aaaai.org/tools-for-the-public/ conditions-library/allergies/mowing-down-yourgrass-allergies
12. Salo, P. M., Arbes, S. J., Jaramillo, R., Calatroni, A., Weir, C. H., Sever, M. L., Hoppin, J. A., Rose, K. M., Liu, A. H., Gergen, P. J., Mitchell, H. E., & Zeldin, D. C. (2014). Prevalence of allergic sensitization in the U.S.: Results from the National Health and Nutrition Examination Survey (NHANES) 2005–2006. The Journal of Allergy and Clinical Immunology, 134(2), 350–359. https://doi. org/10.1016/j.jaci.2013.12.1071
13. Maya-Manzano, J. M., Tummon, F., Abt, R., Allan, N., Bunderson, L., Clot, B., Crouzy, B., Daunys, G., Erb, S., Gonzalez-Alonso, M., Graf, E., Grewling, Ł., Haus, J., Kadantsev, E., Kawashima, S., Martinez-Bracero, M., Matavulj, P., Mills, S., Niederberger, E., & Lieberherr, G. (2023). Towards European automatic bioaerosol monitoring: Comparison of 9 automatic pollen observational instruments with classic Hirst-type traps. Science of the Total Environment, 866, 161220. https:// doi.org/10.1016/j.scitotenv.2022.161220
14. Buters, J., Clot, B., Galán, C., Gehrig, R., Gilge, S., Hentges, F., O’Connor, D., Sikoparija, B., Skjoth, C., Tummon, F., Adams-Groom, B., Antunes, C. M., Bruffaerts, N., Çelenk, S., Crouzy, B., Guillaud, G., Hajkova, L., Seliger, A. K., Oliver, G., & Ribeiro, H. (2022). Automatic detection of airborne pollen: an overview. Aerobiologia. https://doi. org/10.1007/s10453-022-09750-x
15. Lucas, R., Bunderson, L. (2024). A Review of Pollen Counting Networks: From the Nineteenth Century into the Twenty-first Century. Curr Allergy Asthma Rep 24, 1–9. https://doi.org/10.1007/s11882-023-01119-5.
©2024 Asthma and Allergy Foundation of America 17 allergycapitals.com
1235 South Clark Street • Suite 305 • Arlington, VA 22202 800-7-ASTHMA (800-727-8462) • aafa.org ©2024 Asthma and Allergy Foundation of America