
FEDERAL GOVERNMENT OF NIGERIA/ AFRICAN DEVELOPMENT BANK SUPPORTED AGRICULTURAL TRANSFORMATION AGENDA SUPPORT PROGRAM PHASE ONE (FGN/AfDB - ATASP-1) ATASP-1 BENEFICIARY NEEDS ASSESSMENT IN THE FOUR STAPLE CROPS PROCESSING ZONES OF NIGERIA. 2017 AGRICULTURAL TRANSFORMATION AGENDA SUPPORT PROGRAM PHASE ONE


i Citation: Arabi, I.M., Egba, R.S., Manta I.H., Auwalu A.S., Abubakar A., Akwashiki H.K., Damian O.C., Ben A., Omotosho A.O., Alphonse E., Akogun E.O., Habila E.K., Bagy H.D., Akintunde A.P., Ejiogu L.C., Falmata Z.G., Onyekineso Jp.C., Mallam M., Diso H.B., Sani S.G., Bashir J.Y ISBN: 978-978-59560-1-6 © Agricultural Transformation Agenda Support Program Phase-1 (ATASP-1), 2022. All rights reserved. NOVEMBER 2017 REVIEWED BY: Arabi, I.M., Habila E.K., Bagy H.D., Ejiogu L.C., Akintunde A.P., Falmata Z.G., Onyekineso Jp.C., Mallam M., Diso H.B., Sani S.G., Bashir J.Y ATASP-1 BENEFICIARY NEEDS ASSESSMENT IN THE FOUR STAPLE CROP PROCESSING ZONES OFBYNIGERIA. POD AGRO CONSULTANCY DAMIAN O. CHIKWENDU BEN AHMED A.O. ALPHONSEOMOTESHOEMECHEBE
Executive
obtained indicate that the farmers had a mean age of 44 years. They were mostly literate. Only about 4% of them were illiterate, while17.6% had only Koranic education. The rest had one form of western education or the other. Majority of the farmers were male (85%). The mean household size was 11 persons. Majority of the respondents acquired their farmland by inheritance (82%), followed by those that purchased, rented or borrowed in that order. Share cropping and leasing were the least practiced methods of land acquisition. Their mean farm size was 1.8ha. A comparative assessment of the importance of the main crops based on the number of Summary ii
A study was therefore commissioned by the National Programme Coordinator of the Agricultural Transformation Agenda Support Program Phase 1 (ATASP-1) to identify the needs of ATASP-1 beneficiaries. The exercise took place in the seven states participating in ATSPS-1, namely Anambra, Enugu, Kano, Kebbi, Jigawa, Niger and Sokoto. The thstudy was conducted between August 21 and 28 and all the 33 Local Government Areas (LGAs) in these States were covered.
Both primary and secondary data were obtained. Primary data were obtained from farmers and other value chain actors in ATASP-1 participating communities. The respondents were involved in ATASP-1 priority crops, namely, rice, sorghum and Thecassava.results
lthough attempts have been made in the past to develop the rural areas, many of these attempts, have not been successful. Whenever positive development is achieved it often does not stand the test of time as soon as external supportA ceases. Development effort at local or grass-root level is worsened when targets of such programmes are either left worse off than before or the project measures were not relevant to the needs and aspirations of the people. This situation calls for peopleoriented programme, where intervention is designed to improve existing circumstances of the people; and it should begin and end with target of change. Such approaches which encourage self-reliance among communities and reduce dependence on external interventions by involving people in rural livelihood improvement programme right from needs assessment, prioritizing needs, identifying solutions, adequate planning, implementation as well as monitoring and evaluation of the programmes remain imperative. This is why the beneficiary needs assessment by ATAPS-1 is very important.
The major marketing needs of the marketers were access to market information, good roads and off-takers. The above needs were compared with results obtained from similar studies by some other projects and were found to be generally similar. The report concludes with specific recommendations geared towards addressing the needs of the beneficiaries. The recommendations will ensure that ATASP-1 is properly targeted, socially acceptable, implementable and effective in achieving its objectives. Strategy for deploying the recommended technologies was also proposed. iii
The main farmers' production needs were: credit facility, fertilizer, improved seeds and labour saving devises for land preparation. The main harvesting/storage needs were: harvesters, threshers and bags. In processing, respondents focused more on the need to have regular power supply, water for processing and processing machines. In the area of marketing, the most important needs of the beneficiaries were access to market information, transportation-especially good roads and off-takers. The fabricators' needs were regular power supply and soft loan to assist them in fabricating more complex equipment/machines.
those cultivating them showed that rice (45.7%), sorghum (38.9%) and maize (30.1%) were the most important crops. Millet came fourth with 20% and cassava fifth with 15.3%. More land on the average (1.64 ha) was devoted to rice cultivation; followed by thsorghum (1.55 ha) and yam (1.50 ha). Cassava came 4 with 1.3 ha, while maize and millet came fifth with 1.2ha respectively. The mean yields of ATASP-1 crops are still relatively low. For rice, it is 3tons, sorghum-1.7 tons and cassava 14.5 tons. The result of the comparative assessment of the profitability of the major commodities in each of the staple crop processing zones showed that among the ATASP-1 priority crops, return on investment was highest for rice production with Kebbi-Sokoto SCPZ recording N2.90, followed by Kano-Jigawa-N1.98 and Adani-Omor and Bida-Badeggi recording N1.48 respectively. Cassava production in Adani-Omor and Bida-Badeggi recorded higher return on investment than did sorghum in Bida-Badeggi and Kebbi-Sokoto. However, return on investment was higher for sorghum in Kano-Jigawa where for each naira invested, there was a return of N1.93. When compared with non-priority crops, the results showed that maize on the average performed best. In Kebbi-Sokoto zone, the return on investment for maize production was N2.45, while in Kano-Sokoto zone, it was N2.42. Based on the above results, it may be inferred that by all parameters considered, that maize is a very important crop especially in Kano-Jigawa and Kebbi-Sokoto SCPZs. For the three priority crops under ATASP-1, rice is the most important crop and should be given due attention.
Acknowledgment iv
e wish to express our gratitude to the leadership of ATASP-1 Project for giving us the opportunity to contribute to ATASP-1 Project. We are particularly grateful to the National Programme Coordinator and his teamW who gave us maximum cooperation and very useful advice throughout the period of this assignment. Our thanks go to the supervisors and enumerators in the various zones who contributed immensely towards successful completion of this work. Finally, we want to thank the members of various communities visited. Your attention was exceptional. We hope that the work we have started together will yield the desired result. Damian. O. Chikwendu
v Page Executive Summary ……………………………………………………………………….. ii Acknowledgment ……………………………………………………………………….. iv Table of Contents ….. v List of Acronyms ….. vii List of Tables ….. viii List of Figures ……………………………………………………………………….. ix List of Pictures ……………………………………………………………………….. x Introduction ……………………………………………………………………….. 1 Objectives of the Assignment ……………………………………………………. 3 Literature Review ….. 5 Methodology ……………………………………………………………………….. 12 Results and Discussion …………………………………………………………………… 17 - Socio Economic Characteristics …………………………………………… 17 Comparative Importance of Major Crops 19 Production Needs of Farmers 22 Harvesting and Storage Needs of Farmers ……………………………… 25 Processing Needs of Farmers ………………………………………………… 28 - Marketing Needs of Farmers …………………………………………………. 30 Needs of Other Value Chain Actors ……………………………………….. 31 Comparative Assessment of Field Findings with Results of Other Projects ……………………………………………… 34 Conclusion ………………………………………………………………………. 35 - Recommendations …………………………………………………………….. 35 References …. 46 Annex 1: Questionnaire For Beneficiary Needs Assessment Of ATASP-1 Farmers ……………………………….. 48 Table of Contents
vi Annex 2: Checklist For Discussion With Processors, Off Takers, Agro-Input Dealers And Fabricators ……………………… 63 Annex 3: Checklist For Discussion With Leadership Of Farmers' Groups And Opinion Leaders ………………………………. 65 - Annex 4: List of Other Value Chain Actors Interviewed and their Locations, Adani-Omor SCPZ ................... 67 Annex 5: List of Other Value Chain Actors Interviewed and their Locations, Bida-Badeggi SCPZ ……………….. 69 - Annex 6: List of Other Value Chain Actors Interviewed and their Locations, Kebbi-Sokoto SCPZ ……………….. 71 - Annex 7: List of Other Value Chain Actors Interviewed and their Locations, Kano-Jigawa SCPZ …………………. 74 - Report of Adani-Omor SCPZ …………………………………………………… 78 - Report of Bida-Badeggi SCPZ …………………………………………………. 117 - Report of Kebbi-Sokoto SCPZ …………………………………………………. 166 - Report of Kano-Jigawa SCPZ ………………………………………………….. 187
ADP Agricultural Development Programme ATA Agricultural Transformation Agenda ATASP Agricultural Transformation Agenda Support Programme DFRRI Directorate for Food Roads and Rural Infrastructure ECOWAS - Economic Community of West African States FAO Food and Agricultural Organization FGD - Focus Group Discussion GDP - Gross Domestic Product GR Green Revolution IAR Institute for Agricultural Research ICRISAT - International Crops Research Institute for Semi-Arid Tropics IITA International Institute of Tropical Agriculture KNARDA Kano State Agricultural and Rural Development Authority KII - Key Informant Interview NARI National Agricultural Research Institute NAFPP National Accelerated Food Production Programme NCRI National Cereals Research Institute NRCRI National Root Crops Research Institute PZ Processing Zone SCPZ Staple Crop Processing Zone OFN Operation Feed the Nation List of Acronyms vii
viii Page Table 1: ATASP-1 LGAs, Communities and Number of Sampled Farmers …………………………………….....……. 13 Table 2: Number of FGD Held and Other Value Chain Actors Interviewed ………………………………...……….. 15 Table 3: Distribution of Respondents According to Socio-economic Characteristics 17 Table 4: Distribution of Farmers Based on Land Tenure System ….......…… 19 Table 5: Distribution of Farmers According to Crops Grown, Mean Farm Size and Yield……………………….....…… 20 Table 6: Comparative Analysis of Profitability of Major Crops in the SCPZs ………………………...........................…. 21 Table 7: Major Production Needs of Farmers by Crops and SCPZ ….......…. 23 Table 8: Summary of Production Needs of Farmers ………………….…....….. 24 Table 9: Major Harvesting/Storage Needs of Farmers by Crops and SCPZ ………………………………………....……. 26 Table 10: Summary of Harvesting/Storage Needs of Farmers ……….....… 27 Table 11: Major Processing Needs of Farmers by Crops and SCPZ…......... 28 Table 12: Summary of Processing Needs of Farmers ………………….....…… 29 Table 13: Major Marketing Needs of Farmers by Crops and SCPZ……........ 30 Table 14: Summary of Marketing Needs of Farmers ……………………....…. 31 Table 15: Main Needs of Other Value Chain Actors …….........………………… 32 Table 16: Identified Needs by different Projects ………………………….....… 34 Llist of Tables
ix Page Fig 1: Production Needs of ATASP-1 Farmers ……………………………… 25 Fig 2: Harvesting/Storage Needs of ATASP-1 Farmers 27 Fig 3: Processing Needs of ATASP-1 Farmers ……………………………….. 29 Fig 4: Marketing Needs of ATASP-1 Farmers ………………………………… 31 List of Figures
x Page Pic 1: A Power Tiller ……………………………………………………………….....…. 37 Pic 2: A Mechanical Planter …………………………………………………….......…. 38 Pic 3: A Two-row planter (Animal drawn) ………………………………........…… 38 Pic 4: A Rice Harvester/Thresher ……………………………………………......….. 39 Pic 5: A Multi-Crop Thresher …………………………………………………......…... 40 Pic 6: A Flat Bed Dryer ……………………………………………………………......…. 40 Pic 7: A Rice Polisher/De-stoner ………………………………………………......…. 41 Pic 8: A Cassava Peeler …………………………………………………………….....…. 42 Pic 9: A Cassava Up-rooter ……………………………………………………….....…. 42 Pic 10: A Hybrid Dryer …………………………………………………………...…….. 43 List of Pictures
One of the major problems confronting Nigeria today is how to improve the quality of life in the rural areas, and so reduce the level of poverty. Indeed, poverty is a major problem in Nigeria today. Poverty is a condition of having little or no money or other economic endowment and not being able to get the necessities of life. The concept of poverty derives from long and protracted inability to generate productive resources for the purpose of generating desired levels of output in order to enhance the realization of an appreciable income. Most of the poor in Nigeria are based in the rural areas, and are usually resource poor. A resource poor farmer is one that farms a modest piece of land which may not belong to him; uses mostly family labour for farm operations; consumes most of what he produces; lacks funds to purchase inputs; uses low level of technology that is based on low risk and traditional practices, resulting in low productivity; lacks collateral and has no access to loans from financial institutions; and his poverty is further expressed in poor and crude tools, smallness of operation and poor output. The above description of a resource poor farmer characterizes the majority of the rural dwellers in Nigeria.
Over the years rural development in Nigeria has been closely associated with agriculture. This is not surprising as agriculture is the most important sector in the whole development process. Agriculture provides food and bulk of employment and income for the populace. It is also considered as engine for local industries because of its role as source for raw materials and market for output of these same industries. Nigeria, like many other African countries, relies on agriculture with the sector being important to both economic growth and poverty alleviation. It contributes about 30.9% to the country's GDP (World Fact Book, 2015) and provides employment for about 70% of the population. Of the 91.07 million hectares, arable land is estimated at 33%; grazing land at 44%; forests and woodland at 12% and others at 8%. Eighty per cent of the arable land is potentially cultivable for maize, sorghum, rice, millet, groundnut, cowpea, yams, cassava, okra, cocoa, palm oil, rubber and timbermported rice and wheat is expected to exceed 7 million tonnes in 2017. This was the reason why Agricultural Transformation Agenda (ATA) implemented from 2012-2016 focused on five key cropsrice, sorghum, maize, wheat and cassava, which are needed to make Nigeria self
Nigeria agriculture is largely in the hands of small scale farmers, whose farm holding is on the average estimated to be 0.5hectare (about 2acres) and who operate on an average of 2 plots per farmer (NBS, 2014). Productivity is low as a result of low farm input usage leading to deficiency in domestic food supply. The consequence is massive importation of food to augment domestic production. Rice and wheat are the major food imports to the country, and FAO (2017) reported that i 1
1.1. Past Efforts on Rural Development
1.0: INTRODUCTION
sufficient in food production. The Agricultural Transformation Agenda (2011) and Agricultural Transformation (ATA) Support Program Phase 1 (2015) seek to add 143,900 metric tons of food to domestic food supply by 2018 and to create 120,000 jobs. Progress in agriculture is closely linked to several key and often-interrelated factors. These factors usually comprise infrastructure, research, extension, farm inputs, rural credit, land policy etc. This is probably why there have been many agriculture-based programmes aimed at promoting rural development. These include the River Basin Development Authorities, National Accelerated Food Production Programmes (NAFPP), Operation Feed the Nation (OFN), the Green Revolution (GR), The Directorate for Food Roads and Rural Infrastructure (DFRRI), Agricultural Development Programmes (ADPs), Fadama I, II and III Projects, Agricultural Transformation Agenda, etc.
1.2: The Agricultural Transformation Agenda Support Program Phase 1 (ATASP-1) The Agricultural Transformation Agenda Support Program Phase 1 (ATASP-1), unlike previous interventions, which focused on agricultural production, is adopting a commodity value chain development approach in four Staple Crops Processing Zones 2
Development experts are of the view that participation is an essential ingredient to development. However, many efforts by governments, international development agencies, local organizations and non-governmental organizations with main focus in rural livelihood improvement, in the past few decades did not achieve the desired results in terms of positive impact and its sustainability. This is evident from the number of people in Nigeria and other African countries who still live below one dollar per day and not being able to cater for their basic human needs. In Nigeria, whenever positive development is achieved it often does not stand the test of time as soon as external support ceases. This is evident from various programmes such as the Agricultural Development Programme (ADPs) supported by World Bank loan. Development effort at local or grassroot level is worsened when targets of such programmes are either left worse off than before or the project measures were not relevant to the needs and aspirations of the people. This situation calls for peopleoriented programme, where intervention is designed to improve existing circumstances of the people; and it should begin and end with target of change. Such approaches which encourage self-reliance among communities and reduce dependence on external interventions by involving people in rural livelihood improvement programme right from needs assessment, prioritizing needs, identifying solutions, adequate planning, implementation as well as monitoring and evaluation of the programmes remain imperative. This is why the beneficiary needs assessment by ATAPS-1 is very important.
The objectives of the study are to:
v. Compile detailed and comprehensive needs of targeted farmers and make recommendations to ATASP-1 and its outreach program for intervention. 3
The specific objectives are to improve food and nutrition security, promote employment generation and increase, on a sustainable basis, the income of smallholder farmers and rural entrepreneurs that are engaged in the production, processing, storage and marketing of the selected commodity value chains. The direct beneficiaries are the 45,300 economically active small-holders living in the rural areas who are already participating in commercial agriculture. This number is expected to increase significantly when other economically active value chain entrepreneurs enlist in the Program. The indirect beneficiaries include existing or potential small, medium and large-scale entrepreneurs and business associations who provide services to rural households. Among the target group, women and youth play a major role in crop and animal production, processing, small enterprises operation and marketing. They will be specifically targeted for Program activities and benefits.
(SCPZs) (Adani-Omor, Bida-Badeggi, Kano-Jigawa and Kebbi-Sokoto). The Processing Zones (PZs) are specially delimited contiguous expanses of land in areas of high agricultural potential where the localized provision of a well-developed physical infrastructure such as access roads, electricity, as well as water are necessary for private sector led production, processing and marketing activities for strategic commodities such as rice, sorghum, cassava horticulture, cotton, cocoa, oil palm, livestock, fisheries, etc. The four PZs have high potential for rice, sorghum and cassava production and are among the 13 PZs established by the Federal Government as part of the Agricultural Transformation Agenda (ATA).
i. Identify the farmer clusters, farmer groups and farmer cooperatives in the four Staple Crops Processing Zones (SCPZs) of ATAPS- 1 intervention.
1.3: Objectives of the Assignment
ii. Determine the various crop enterprises that are grown in the seven participating states of Anambra, Enugu, Niger, Kano, Jigawa, Sokoto and Kebbi, stating the dominant crop having comparative advantage, mean farm sizes of farmers in the targeted LGAs/communities of focus for the study.
iv. Analyze and triangulate field findings with other documented farmers' needs.
iii. Identify and prioritize farmers' needs for rice, sorghum and cassava production, harvesting /storage, processing and marketing.
* Determine the agro- processing challenges by the farmers group.
* Determine the labour requirements for harvesting commodity per hectare.
* Identify the off-takers for rice, cassava and sorghum in the community
* Identify farmer groups by location with their membership composition on state basis with cognizance to gender inclusion.
* Suggest ways of collaboration between off-takes and farmer with a view to mopping up the produce after harvesting.
* Identify marketing challenges facing the farmers 4
* Determine land ownership/access to land for production.
* Determine varieties under cultivation and yield per hectare
* Determine the credit facilities accessible to the farmers for farming across the state.
* Determine average farm holding/farm size being cultivated by the farmers and average output on crop basis across the state.
* Determine the most common land preparation and cultivation methods and their labour requirements per hectare.
* Determine the types of storage facility used in the community
* Identify dominant farm enterprises with emphasis on rice, cassava and sorghum in the states.
* Determine the storage facility needs of the farmers.
* Identify the transportation needs to move farm produce from farm to the markets and from farm to village
* Determine the prevailing extension services that are available to the farmers,
* Determine the Agro – processing activities being carried out by the farmer.
* Determine production requirements per hectare for seeds, fertilizers, agrochemicals and labour cost.
Task 2: harvesting /storage needs of the farmers
* Identify the market opportunities for rice, cassava and sorghum in the state/ zones.
Task 1: determine production needs of the farmers.
More specifically, the needs assessment addressed the following tasks:
* Recommend the type of acceptable storage facility to use Task 3: processing needs of the farmers:
* Recommend best agronomic practices that could be extended to the farmers
* Determine ways to improve agro- processing activities by the farmers.
Task 4: marketing needs of the farmer.
* Identify Agro – processing facilities that are used in the community
* Determine farmer average income and range of income per hectare.
5
* Recommend marketing solution to the farmers. In like manner, for the other groups of beneficiaries, that is, processors, marketers, fabricators and agro-input-dealers, the study determined their needs 2.0: LITERATURE REVIEW 2.1: Agriculture and the Nigerian Economy
Globally, agricultural production is crucial to the overall wellbeing of the populace, especially in developing countries. This necessitates different countries to give high priority to agriculture and struggle to develop and sustain the sector, thereby ensuring sustainable food security, employment opportunities, and foreign exchange earnings amongst others. However, in Nigeria, where over 70% of the population, mostly rural dwellers, is involved in agricultural activities, yet accounting for less than 7% of the foreign exchange earnings, the sector remains largely traditional, subsistent and undeveloped. Mostly smallholder producers, who operate farmlands of no more than two hectares accounting for over 90%of agricultural outputs (Azih, 2008), dominate the Nigerian agricultural sector. The food crops dominate production and the major food crops are rice, sorghum, millet, maize, cassava and yam. These are produced in less than 50% of the 79 million hectares of available arable land area (Manyong et al., 2005). The sudden increase in agricultural growth rates experienced has been attributed mainly by expansion in areas planted to staple crops. Productivity has remained flat and yields of most crops are actually declining (Oni et al., 2009). Public intervention and investments under the National Food Security Programme and Agricultural Transformation Agenda were aimed at sparking off a sustainable Green Revolution in the country. As it has been observed, Nigeria may not be able to meet its food production and poverty reduction goals without a significant and sustainable production increase in the agricultural sector. Furthermore, the global food crisis of early 2008 has not removed Nigeria from the unpredictable shortages of global food and price spirals of the period thus worsening Nigeria's ability of making food available and accessible at affordable prices to the teeming consumers. Reliance on food imports to supplement local production and demand remains the only option unless the sector is given more attention and enabling policy environment to improve farmers' productivity and efficiency As common to traditional agriculture, the returns to farmers are not attractive due to high cost of production and low productivity. According to Ojehomon et al. (2009), the only way out to achieving self-sufficiency in Nigeria is to have a policy mix that embraces institutional restructuring, strategic investments and coordinated efforts at all levels to empower farmers and provide improved conditions in rural areas. Such efforts would focus on rehabilitating degraded rural infrastructure, adopting productivity and efficiency enhancing measures and taking steps to stimulate competitiveness.
Root Crops and Tubers. Root crops and tubers dominate agricultural production, accounting for eighty-nine million tonnes in 2009, i.e. 69% of the regional supply. These crops amount to more than two-thirds of staples grown in Nigeria. Production is estimated to have tripled in the last twenty years because of an increase in the amount of land devoted to these crops. Nigeria is the world's leading producer of cassava, yams and taro root, and the second largest producer of sweet potatoes. Domestic cassava production has increased greatly since the late 1990s, rising 44% in seven years to attain 44 million tonnes in 2009. Grains. Nigeria alone grows about 50% of the grain crops produced in West Africa. Production has doubled over the years. As is the case in nearly all West African countries, the rise in grain production is due more to the extension of cultivated land than to any significant improvement in yields. Millet and sorghum (59% of total grain production by volume) yields have either stagnated (sorghum) or progressed at a very slow pace, putting the average yield for these two crops at 1-1.5 t/ha over the 20002006 period. Production increased by a factor of 3.8 (millet) and 3.4 (sorghum) between 1980 and 2008, and now stands at approximately 9 million tonnes for each of these two Ricecrops.and maize stand out, attaining yields of close to 2 t/ha. However, while maize yields have risen from about 1 t/ha in the early 1990s to about 2 t/ha in 2006, rice yields have stagnated at around 2 t/ha since 1990. Maize has performed well in Nigeria, and its production volume rose from around 1 million tonnes in 1980 to over 7.5 million tonnes in 2008. The volume of rice produced increased by a factor of 3.4 between 1980 and 2008, reaching 4.2 million tonnes of rice in 2010. Legumes and Oilseed Plants. Nigeria is the world's largest producer of cowpeas, with about 3 million tonnes grown in 2008 (58% of regional production). The country also produces 3.9 million tonnes of groundnuts, or 57% of all groundnuts grown in West WhileAfrica.the overall trends of agricultural production in Nigeria can be ascertained, very little is known about the structure of the demand for staple crops. This demand is strongly influenced by a number of factors, and divided between domestic needs and demand from neighbouring countries (in particular for grains). This relative lack of 6
2.2: Staple crops production and consumption in Nigeria Nigeria is the largest agricultural producer of staple crops in ECOWAS. Production is thought to have grown by 30% to 40% between 2000 and 2009. The most important crops for Nigeria are root crops and tubers on the one hand, and grains on the other.
A baseline survey of the Kano Rice Value Chain identified three major types of rice production ecologies, namely Upland, Lowland and Irrigated perimeter (PrOpCom, 2007a). According to the report, in the Kano clusters, 26.8%, 33.2% and 40% of farmers were operating in the upland, lowland and irrigated perimeter production systems, respectively. By contrast, in Jigawa clusters, 84% and 16% operated in the irrigated perimeter and Upland systems, respectively. Factors limiting optimum output and quality included: (i) Water availability and level of input utilization at the farm level, and (ii) High cost of inputs, especially fertilizer, labour and land preparation. Farmers indicated that inability to secure adequate fertilizers and water for supplementary irrigation could cause reduction in output quantity and quality. (PrOpCom, 2007a) also found some favourable changes observed by farmers included: (i) introduction of high yielding, pest and disease resistant varieties; (ii) establishment of public irrigation schemes in Kano and Hadejia; and (iii) increase in demand for locally produced rice. With respect to rice processing, (PrOpCom, 2007a) found that parboiling is a women dominated enterprises in all clusters, with 71.2% and 66.7% of parboilers being women in Kano and Jigawa States, respectively. These parboilers generally used firewoods as source of energy for parboiling. By contrast rice millers in the study locations were men, with milling units being either diesel – powered or electricity – powered, although the latter was preferred because it is more efficient, with respect to quality of product and cost of operation. It was noted that ownership and operation of milling enterprises are, in most cases different in such a way that an owner employed an operator, who is a skilled person, who then hired casuals to assist him. Millers provided milling services to their customers, for a fee, which was usually charged per bag of paddy milled.
Some of the current literature and published information on the value chains of interest, namely, rice, sorghum and cassava are reviewed below.
2.3.1: Rice Value Chain
2.3: Value Chain Review
knowledge about import and export flows with neighbouring countries makes it difficult to establish an overall food assessment. Nigeria's food regime is based essentially on two foods: grains, which provide 46% of calories and 52% of proteins consumed, and root crops/tubers, which provide 20% of calories and 8% of proteins consumed. Consumption of grains and root crops/tubers amounts to 150 kg and 214 kg respectively per person and per year in 2013.
7
A different study by PrOpCom (2007b), mapped production and processing cluster in Kano, Jigawa, Katsina and Kaduna States. The results of the study showed that rice in Kano State was produced mainly by smallholder farmers, with farm size less than 5 ha in all clusters except Tudun Wada and Kinkiba where majority of farmers devoted 5 – 10 ha to rice production. Up to 47% of farmers in all clusters were aged 30 – 49 years, except for Hadejia where more than 70% of the farmers were over 50 years. It was reported that majority of farmers in all clusters were educated and majority used fertilizers. However, only farmers in Kura and Hadejia used improved varieties and herbicides. Kura and Hadejia farmers recorded the highest cost of production (NGN 113,170 and NGN 143,055) and yield (76 and 63 bags) per ha, respectively. In the same study (PrOpCom 2007b), farmers stored their paddy mostly in their houses, for 2 – 6 months, before Theselling.major
On rice trading, PrOpCom, (2007a) identified three types of traders, namely: (i) Traders involved in purchasing paddy rice from farmers and selling it to other traders or processors (ii) Traders involved in purchasing paddy rice from farmers and other traders and subsequently processed the paddy into milled rice and sell it to both retailers and consumers.
mean of transportation to village markets were wheel-barrows, motorcycles, and pick-up vans, the transportation cost varying from NGN 75 per bag in Dandume to NGN 280 in Garko; all markets had middlemen. Flow of rice from cluster to Kano was mainly in form of milled rice. Items of transaction costs included: union and LGA fees, loading/offloading, storage and middlemen charges. The units of measure used in all clusters were bags and mudus, with number of mudus in a bag varying from 20 t0 80 and average weight/mudu being 2.48 – 2.52 kg for milled rice. But in Kinkiba, half a mudu (tiya) is used. It is noted that Dandume is a marketing cluster rather than a producing cluster, while 8
(iii) Traders who purchase only processed rice and sell to other traders, consumers and other buyers, directly. In the Kura – Kano axis, the second category was the predominant, while in the Dawanau, Rimi and Sabon Gari markets, the third was predominant. In Garko and Tudun Wada the second and the first predominated, while in Hadejia the second category was predominant. The factors that influenced choice of product by people were product quality. In Kado, 87% in and Jigawa 93.3% of the customers showed higher preference for quality compared to price. The quality attributes used by traders included: long and well-filled grain, whiteness and dryness. For economic reasons, consumers tended to sacrifice quality.
· Provision of farming implements comprising: 100 mini rice milling machines; 100 single row planters; 100 double row planters; 100 minithreshers; 300 hand-held harvesters, and 574 manual sprayers.
The Jigawa State Government has very recently embarked on a massive drive to drastically increase both rain-fed (400, 011 ha) and irrigated (210 ha) rice production in the state. According to a report in TRIBUNE Newspaper of June 13, 2017, and contributed by Collins Nnabuife, the Jigawa government is providing the following incentives to smallholder farmers:
· Provision of subsidized inputs on loan to farmers who repay at after harvest.
· Trained mechanics on repairs of harvesters, threshers and tractors; these mechanics provide mobile service to farmers.
· Providing multi-rice harvester and threshers to youths who then act as service providers to smallholder farmers;
· Reduction of fertilizer price and insecticide cost.
Similarly, Dangote Rice Ltd will launch 25,000 ha rice outgrower scheme in 14 states, beginning with Jigawa in February 2017. This was reported in 'The Cable News and Views' unlimited on February 13, 2017 by Oliseyi. According to the report, Dangote Rice will produce 225,000 tonnes of parboiled, milled rice by the end of 2017 The company will distribute improved seed to primary local farmers, and upon harvest, purchase the produce from them for milling and final processing. In this process Dangote Rice will off take rice paddy and transport it to one centralized mill which will mill stored paddy from the various sites.
· Bulk purchase of inputs, which are then sold at very affordable prices to farmers.
The present promotion of rice production in Kano and Jigawa has attracted heavy investments by the private sector. For example, BUA group of company is establishing a 200,000 tonnes rice processing plant in Jigawa State, in addition to already existing one in Kano State, according to February 2, 2017 report by Ibrahim Musa Giginyu in Daily Trust Newspaper. The group has signed MoU to build an outgrower scheme that will involve the provision of improved seeds, technical expertise, as well as BUA milling and processing infrastructure that will drive the group's processing capacity from 200,000 tonnes to 1 million within the next 4 years.
Kinkiba is essentially a producing cluster, being the only cluster without a market. Also Hadejia is an irrigated producer cluster and is the highest supplier of paddy to Kano.
9
Sorghum is a traditional crop grown mostly by smallholder farmers in all states in northern Nigeria. It is produced either as sole crop or in mixture with other crops, often with little purchased inputs. For example, Maiangwa and Ogungbile (2008) evaluated chemical fertilizer use by farmers in Kano, Jigawa and Katsina States and found that application rates of NPK used in the states fell short of the recommended quantities for sorghum (200 – 300 kg NPK/ha).
Although Nestle Nigeria Plc is mainly concerned with transformation of sorghum grains into foods and beverages, it has recently recommended that the Federal Ministry of Agriculture should seek ways to make mechanisation and agriculture financing available to local farmers because mechanisation and finance are key to Nigeria's agricultural development (This Day Newspaper, 23 August, 2017). The company also appealed to the Federal Government to support farmers by providing agro-inputs such as fertilizers, chemicals and seed at subsidized prices (Nigerian Tribune Newspaper, August 2, 2017).
Sorghum production, even in mixture with legumes, is confronted by several constraints. In a recent report of their study in Kano State, Mohammed et al. (2015) found that there were several constraints to sorghum production. These included high costs of inputs; insufficient funds; inadequate and untimely delivery of farm inputs; inadequate collaterals/security for loan access; inadequate credit facilities; inadequate storage, processing and marketing facilities; pests and diseases; and shortage of extension services. The researchers recommended that the government and development agencies, like ADP, should address the challenges of shortage of extension services, credit access to farmers, improved marketing system, input supply and affordable price of inputs.
The value addition companies have been major drivers in promoting the sorghum sector. Thus farmers, representing 89 farming communities that supply sorghum grains to Nestle Nigeria Plc from Gombe, Kaduna, Kano and Katsina, commended Nestle Nigeria Plc for utilizing their produce to manufacture foods such as Nestle Milo, Maggi and Golden Morn (Nigeria Tribune Newspaper, August 2, 2017). The farmers supply Nestle Nigeria Plc with white sorghum grains that have minimal foreign bodies such as hubs, stones and metals. Through this arrangement, Nestle reached 30,000 farmers across Kano, Kaduna and Katsina and plans to add Jigawa by end of 2017 In a related development, IITA News (2017) in a report of meeting of ATASP – 1, Sorghum Innovation Platform stakeholders in Kano in 2017, noted that Honeywell Group provided farmers with improved seed in 2017 and would purchase 80,000 tonnes of grain in 2018. Farmers in this arrangement require high-yielding, sorghum varieties, such as CSR – 01 and SK5912. 10
2.3.2: Sorghum Value Chain.
2.3.3: Cassava Value Chain.
Another company, Northern Nigeria Flour Mills Plc, has invested NGN 2 billion in a new sorghum plant in Kano (Economy News of Business Day, August 28, 2017). This stateof-the-art, ultramodern sorghum milling plant, commissioned in Kano in 2017, is the largest sorghum processing plant in sub-Sarahan Africa. It has an installed capacity of 100,000 tonnes and will provide over 40,000 new jobs.
Another online publication by Darlington Omeh: How to Start Cassava Farming in Nigeria (Step by Step) has provided useful guides on site selection, cassava varieties, land preparation and planting, as well as types of fertilizer and their rates of application. Reports on the experiences of other Nigeria states on commercial cassava farming are available. Examples include reports from Delta State (Omoregbee and Banmeke, 2013) and Ogun State (Aderinto et al., 2010). In developing cassava sector in any community, 11
Although cassava cultivation in Kano and Jigawa has been practiced for a very long time, there is virtually no effort to develop or promote its production and commercial uses (Abdulkadir Aliyu, KNARDA, personal communication, November, 2017). However, the government and people of Jigawa State have been making efforts for the past five years in boosting cassava production in the state. It is grown by smallholder, subsistence farmers in some niches and used as snack food and localized home consumption. Thus, there is virtually no published information about efforts to promote production of cassava as a food crop or an industrial crop in Kano and Jigawa States; yet, one of the common, cassava-derived foods (garri) is widely consumed in many parts of the two Cassavstates.a is one of the most important food and industrial crops in Nigeria. Apart from its consumption in form of garri throughout Nigeria, cassava can be processed into a number of products such as starch, chips, ethanol, glucose syrup and flour. It is noted that cassava flour is now used in Nigeria to make composite wheat – cassava bread containing 20% of cassava flour. Information about commercial production of cassava can be obtained from either the National Root Crop Research Institute (NRCRI), Umudike, which has the national mandate for cassava research and development, or the International Institute of Tropical Agriculture (IITA), Ibadan, which has an African mandate for cassava research and development. The IITA has produced a guide on cassava production captioned: “Starting a Cassava Farm”; it was published in January, 2012. The guide was prepared to help in selecting sites for cassava farms, provide methods to improve soil for good cassava growth, select suitable cassava varieties for planting, as well as selecting, preparing and planting healthy stem cuttings.
1. Administered ten questionnaires to ten ATASP-1 farmers, 2. Conducted one Focus Group Discussion (FGD) to a group of farmers, 3. Conducted Key Informant Interviews (KII) to a processor, marketer, agroinput dealer and fabricator (one each). 12
one of the more noticeable prerequisite is developing good roads and providing cheap transportation.
3.1: Study Area and Sampling Procedure
3.0: METHODOLOGY
The study was conducted in the seven states participating in ATSPS-1, namely Anambra, Enugu, Kano, Kebbi, Jigawa, Niger and Sokoto. As shown in Table 1, a total of 33 LGAs in these States were covered. A multi-stage sampling technique was adopted to reach the respondents. The sampling procedure in each state involved listing of the participating LGAs in the state, listing the identified farming communities and production villages and already profiled farmer groups across the agro-ecological zones in the state. Major processors, marketers, agro-dealers and fabricators were also listed. All the LGAs were selected. Secondly, all the communities in each of the selected LGAs were clustered and 30% were selected using purposive sampling technique. This approach was to ensure that the major communities producing the commodities of interest were selected. Within these communities the available farmer clusters, groups and cooperatives were identified and selected for the study. From the farmer clusters in each community selected, 10 respondents were randomly selected for interview. Similarly, leadership of all farmer groups and cooperatives identified and their members were interviewed using focus group discussion. Key informants in each community were also identified and interviewed. Other category of beneficiaries (processors, fabricators, marketers and agro-dealers) were also identified and interviewed. In line with the agreed sampling plan, seven enumerators were selected and trained for Adani-Omor and Bida Badeggi SCPZs respectively; eight were trained in Kebbi-Sokoto and eleven trained in KanostJigawa SCPZ. The trainings in the various zones were conducted on 21 of August. Field thdata collection commenced immediately and lasted until 28 of August.
In the various communities, the survey conducted the following activities:
An FAO study revealed that access to markets and transport were related to the quantity of cassava sold by producers. Thus, producers located on the road or within 5 km of the market were more likely to sell more than 50% of home consumption, compared with those located more than 5 km away from the road.
S / N N a m e o f Z o n e N o o f T a r g e t S t a t e s N a m e s o f S t a t e s N o o f T a r g e t L G A s N a m e s o f T a r g e t L G A s N u m b e r o f C o m m u n i t i e s N o o f C o m m u n i t i e s s a m p l e d T o t a l N o o f s a m p l e d C o m m u n i t i e s C o m m o d i t y S e c t o r s 1 A d a n i O m o r 2 E n u g u 3 1 U z o U w a n i 5 2 1 2 R i c e , C a s s a v a 2 U d e n u 4 1 3 . I s i U z o 5 2 A n a m b r a 4 1 . O g b a r u 5 2 R i c e , C a s s a v a 2 . O r u m b a N o r t h 5 2 3 . O r u m b a S o u t h 4 1 4 . A y a m e l u m 5 2 2 B i d aB a d e g g i 1 1 . A g a i e 9 3 1 8 R i c e , C a s s a v a , S o r g h u m 2 . G b a k o 9 3 3 . L a p a i 8 2 N i g e r 7 4 . L a v u n 1 0 3 5 . K a t c h a 6 2 6 . M o k w a 1 1 3 7 . W u s h i s h i 6 2 lbTae1: A T A S P1 L G A s , C o m m u n i t i e s a n d N u m b e r o f S a m p l e d F a r m e r s 13
3 K e b b i S o k o t o 2 1 . A r g u n g u 5 2 1 6 R i c e , S o r g h u m 2 . B a g u d o 5 2 K e b b i 7 3 . B i r n i n K e b b i 5 2 4 . D a n d i 5 2 5 . N g a s k i 5 2 6 . S h a n g a 5 2 7 . S u r u 5 2 S o k o t o 1 1 . K w a r e 5 2 R i c e , S o r g h u m 4 K a n o J i g a w a 2 1 . R a n o 6 2 2 2 R i c e , S o r g h u m 2 . B u n k u r e 7 2 K a n o 6 3 . B a g w a i 5 2 4 . D a w a k i n K u d u 5 2 5 . G a r u m M a l l a m 5 2 6 . B e b e j i 5 2 1 . A u y o 5 2 R i c e , C a s s a v a , S o r g h u m J i g a w a 5 2 . M i g a 5 2 3 . K a f i n H a u s a 6 2 4 . M a l l a m M a d o r i 6 2 5 . G w a r a m 8 2 T O T A L 7 3 3 1 9 5 6 8 6 8 14
T a b l e 2 : N u m b e r o f F G D h e l d a n d o t h e r V a l u e C h a i n A c t o r s I n t e r v i e w e d S C P Z N o . o f F G D H e l d N o . o f F a b r i c a t o r s I n t e r v i e w e d N o . o f P r o c e s s o r s I n t e r v i e w e d N o . o f A g r i i n p u t D e a l e r s I n t e r v i e w e d N o . o f M a r k e t e r s ( O f f T a k e r s ) I n t e r v i e w e d A d a n iO m o r A n a m b r a S t a t e E n u g u S t a t e T o t a l 8 6 1 4 3 1 4 4 1 5 4 1 5 4 1 5 B i d aB a d e g g i 2 8 2 8 2 8 2 8 2 8 K e b b iS o k o t oK e b b i S t a t eS o k o t o S t a t e T o t a l 1 4 - 1 4 4 - 4 6 - 6 3 - 3 2 - 2 K a n oJ i g a w aK a n o S t a t eJ i g a w a S t a t e T o t a l 1 2 1 0 2 2 8 7 1 5 5 6 1 1 6 6 1 2 6 6 1 2 F G D F o c u s G r o u p D i s c u s s i o n 15
Both primary and secondary data were collected for the purpose of assessment. Primary data were collected from farmer groups and cooperatives using focus group discussion. Primary data were also collected from individual farmers in the communities using structured questionnaires. In addition to the above, primary data were collected from processors, marketers, agro-dealers and fabricators using checklists. Trained enumerators in each state collected the primary data. Secondary data were obtained from the ATASP-1 office, NARIs, ADP in each State and Local Government Councils.
3.2: Data Collection
Primary data were collected for the farmers' socio-economic characteristics, crops grown by the farmers and the varieties, method of land preparation, their farm sizes, areas devoted to each crop, their agronomic practices and challenges, their output levels and yield, their income level, costs and returns in production of various commodities, land ownership access and pattern, labour use pattern, availability of extension services, their level of use of farm inputs including agricultural credit, their livelihood pattern, their production needs, their harvesting and storage practices, needs, their input needs, their credit needs, their processing practices, their marketing needs, crop harvesting and storage practices and needs, commodity processing practices and needs, their current marketing practices, challenges and needs, etc. For other categories of beneficiaries data were collected on their currents production systems and practices, their levels of production, productivity, income, challenges as well as their needs. The Secondary data collected were on already documented farmers' needs, the major crops grown in the state, results of studies on crops that have comparative advantage in each of the states, recommended farm inputs and rates for each of the crops in each state, available market outlet for each commodity in each state, available off-takers for each commodity in each state, availability of extension services, marketing practices and needs, harvesting and storage practices and requirements, commodity processing practices and requirements.
3. 4: Analysis of Data
The data collected through the instruments of the survey (well-structured questionnaires and checklists used in focus group discussion and key informant interview) were analysed using SPSS and Microsoft Excel. Descriptive statistics such as frequencies, statistical tables, bar charts and pie charts were used in describing the information got from farmers on the field.
16
3.3: Types of Data Collected
4.0: RESULTS AND DISCUSSION 4.1: Socio-economic Characteristics of Respondents The social characteristics of the farmer clusters and farmer cooperatives are done by examining the age distribution, educational status, gender and family size. Age–A global view of age distribution of farmers shows the age range of members the farmers is 20-81 years with a mean age of 44.5 years. Thus, the group members on the average are still fairly young and therefore strong for farming activities. Those over 60 years were just about 6%, while those less than 20 years were just 0.31%. The bulk of the farmers were between 21 and 60 years. This shows that majority of the farmers are still young enough for farming and more importantly are well experienced (Table 3). VARIABLES FREQUENCY PERCENTAGE Age MinMaxMeanT>6051413121<2130405060otal SEducationaltatus TeducationNoMassPSecondaryPrimaryKoranicostsecondaryliteracyschformalotal Gender TFMaleemaleotal 640925640261316816730611320814464044135205185692.548 1001485.6342.0326.2526.0947176.8721.0932.0328.9110.0.3178.66.81.06.37 Table 3: Socio-economic distribution of farmers of ATASP-1 17
Educational Status - Among the respondents, majority (41%) had primary education, followed by those with post-secondary school education and Koranic education. Those without any formal education were about 4% (Table 3). This shows that overwhelming majority of the respondents have one form of literacy or the other and could be open to accepting new ideas.
Size –With regard to household size, the results on Table 3 show that at the National level the mean household size was 11. The maximum size was 50, while the minimum was 1.Most of the respondents had large family sizes. This could be helpful in providing family labour to production activities.
18
Household size 1 5 6 MinMaxMeanT>2016111015-20otal 150116406175136244122 9.5311.21.2538.1219.0672
Land Tenure System- Farm size distribution is a major means of ascertaining the wealth of farmers. Farm size is influenced by the land tenure system. As shown on Table 4 below, farmland acquisition is majorly by inheritance (82%), followed by purchase (30%), rent (16%) and borrowed (14%). There are also less practiced methods of acquisition by share cropping practice (7%) and leasing (2%).
Gender- In terms of gender participation, 85% were male while 14% were female. There is deep variation on this according to the zones. In Sokoto State for instance all the respondents were males suggesting that female participation in the programme is Householdlow.
*Multiple responses were allowed. Farm size- As mentioned above, the land tenure system is a major determinant of land available for cultivation by farmers in any area. Also, the number and type of crops grown by a farmer are dependent on the available land. The average farmer cultivates multiple crops and the total land area devoted crop production was about 1.8ha.
4.2: Comparative Importance of major crops With regards to comparative importance of the crops grown by farmers, Table 6 shows that rice (45.7%), sorghum (38.9%) and maize (30.15%) were the most important crops cultivated by farmers in the zones. Millet came fourth with 20% and Cassava came fifth with 15.3% of the farmers indicating they cultivate it. These are mostly farmers from Adani-Omor SCPZ. With regards to land devoted to these crops, the results on the table also show a similar pattern. More land on the average (1.64 ha) was devoted to rice thcultivation; followed by sorghum (1.55 ha) and yam (1.50ha). Cassava came 4 with 1.3ha while maize and millet came fifth with 1.2ha. The mean yields of ATASP-1 crops are still relatively low. For rice it is 3tons, sorghum-1.7 tons and cassava14.5 tons. This indicates that either the farmers are still using unimproved inputs / practices or that they are using them at sub-optimal level. There is room therefore for the Project to make impact here by introducing improved seeds and other complementary inputs and services. An improved agricultural extension delivery service is vital. 19
Table 4: Distribution of farmers based on the land tenure System Tenure system Frequency Percentage Inheritance 531 82.97 Purchase 196 30.62 Rent 108 16.88 Borrow 93 14.53 Share cropping 45 7.03 Lease 16 2.5 Mean Farm Size 1.8ha
Table 5 : Distribution of farmers according to crop grown, mean farm size and yield for ATASP -1 crops. CROP ENTERPRISE CROPS FREQUENCY Percentage Average farm size Average yield (kg) ATASP 1 Crops OTHER CROPS Rice Sorghum Cassava Yam Okra Vegetable Maize Potato Tomato Cocoyam Millet Groundnut Cowpea Soyabean Wheat Onion 293 249 98 32 5 3 193 1 4 3 132 42 73 16 16 9 45.78 38.91 15.31 5 0.78 0.47 30.15 0.15 0.62 0.47 20.63 6.56 11.40 2.5 2.5 1.4 1.64 1.55 1.33 1.5 0.6 1 1.24 1 0.8 0.9 1.2 0 75 1 1 0.7 1.1 3099 1712 14586 *Multiple Responses A comparative assessment of the profitability of the major commodities in each of the staple crop processing zones was also carried out. Table 6 shows that among the three crops considered under ATASP-1, return on investment was highest for rice production with Kebbi-Sokoto SCPZ recording N2.90, followed by Kano-Jigawa-N1.98 and AdaniOmor and Bida-Badeggi recording N1.48 respectively. The results show that rice production was profitable in all the zones but most profitable in Kebbi-Sokoto zone where for every naira invested there was a return of N2.90. Cassava production in Adani-Omor and Bida-Badeggi recorded higher return on investment than did sorghum in Bida-Badeggi and Kebbi-Sokoto. However, return on investment was higher for sorghum in Kano-Jigawa where for each naira invested, there was a return of N1.93. 20
Based on the above results, it
be inferred that by all parameters considered,
SCPZs. For the three target crops under ATASP-1,
is a very important crop especially in
the most important crop and should be given due attention. Table 6: Comparative Analysis of Profitability of Major Crops in the Various SCPZs Crops/Indicators Adani-Omor Bida-Badeggi Kebbi-Sokoto Kano-Jigawa Rice Yield (Kg/ha) 2464 2550 3979 2692 Gross farm income (N) 246400 293250 437690 296120 Gross margin (N) 147304 174941 325527 196950 Return to naira invested (N) 1.48 1.48 2.90 1.98 Sorghum Yield (Kg/ha) 1651 1876 2689 Gross farm income (N) 181610 187600 268900 Gross margin (N) 92752 100879 177138 Return to naira invested (N) 1.04 1.16 1.93 Cassava Yield (Kg/ha) 18586 15500 11500 Gross farm income (N) 371720 317750 184000 Gross margin (N) 218354 197450 97000 Return to naira invested (N) 1.42 1.64 1.11 21
When compared with other crops, the results show that maize on the average performed best. In Kebbi-Sokoto zone, the return on investment for maize production wasN2.45, while in Kano-Sokoto zone, it was N2.42. The return on investment for millet was high in Kano-Jigawa-N2.95, but much lower in Kebbi-Sokoto-N1.0. may that maize Kano-Jigawa and Kebbi-Sokoto rice is
Maize -Yield (Kg/ha) - - 2484 2598 -Gross farm income (N) 248400 259800 Gross margin (N) 176480 186747 Return to naira invested (N) 2.45 2.42 Millet Yield (Kg/ha) 1131 1879 Gross farm income (N) 124410 206690 Gross margin (N) 62330 148676 Return to naira invested (N) 1 004 2 56
4.3: Production needs of Farmers Production needs of farmers in order of importance for various crops in each of the SCPZs are shown in Table 7 below. These needs were further pulled together and summarised on Table 8. Fig. 1. shows graphically these needs. For cassava, access to land is the most important need in Adani-Omor SCPZ, while in Bida-Badeggi SCPZ it is credit followed by availability of improved cuttings. Availability of improved cuttings was also reported as an important need in the Adani-Omor zone. For rice the needs are similar but vary according to level of importance in various zones. Access to land, availability of fertilizers, improved seeds, extension services, credit, availability of pesticides and land preparation were the most frequently mentioned needs. For sorghum the needs again were similar but vary according to level of importance. Access to improved seeds, credit, fertilizer, land preparation and Pest & diseases (insecticides) control were the most frequently mention. As shown in Fig. 1, when pooled together, fertilizer turned out to be the most important production need of the farmers. This is understandable as farmers rely a lot on chemical fertilizers for increased crop productivity. By working closely with different fertilizer companies, the Project can facilitate access of farmers to high quality fertilizers. They also require improved seeds as many of them still use unimproved seed varieties. 22
ATASP-1 can develop a seed programme with relevant research institutes for the benefit of the farmer. Working with NCRI and AfricaRice on rice, IITA and NRCRI on cassava, IAR and ICRISAT on sorghum, the project can obtain foundation seeds and help the farmers start community seed programme. This will ensure farmers' continuous access to improved seeds and develop entrepreneurship among them on the seed sector. Alternatively, the project can facilitate access to quality seeds by working closely with reliable private seed companies to supply quality seeds to farmers. The next reported need of the farmers is credit. A lot of farmers still cannot access credit facilities from the banks. It is important for the project to help link the farmer to banks. The next important need was land preparation equipment/tool. This is quite understandable given the drudgery involved in tilling the land especially for rice under the heavy soils. This confirms the need to provide mechanization tools/equipment like tractors, work bulls and their implements under hiring arrangement to support farmers' production activities. Specifically, farmers are asking for power tillers that can be hand-operated, tractors and animal pulled mould-board ploughs. Control of pests and diseases is another important need. The problem of Quella birds on cereal crops in the dry savanna of Nigeria is well documented in literature. There is therefore need to provide bird scaring tools and also control pests and disease outbreak on farms in the SCPZs.
Table 7: Major Production Needs of Farmers by Crops and SCPZs S/N Crop Adani Omor SCPZ Bida Badeggi SCPZ Kebbi Sokoto SCPZ Kano Jigawa SCPZ 1 Cassava 1. Land 2. Labour 3. Improved cuttings 4. Credit 5. Fertilizer 1. Credit 2. Improved cuttings 3 Land Preparation 4. Fertilizer 5. Herbicide 1. Fertilizer 2. Credit 3. Improved cuttings 4. Extension services 5. Herbicides 23
2 Rice 1. Land 2. Labour 3. Improved seeds 4. Credit 5.Fertilizer 1. Credit 2. Fertilizer 3. Extension Services 4. Pesticides (Pest & diseases) 5. labour Sourcing 1.land preparation 2.pest and diseases 3.improved seeds 4.fertilizers 5.credit 1. Fertilizer 2. Improved Seeds 3. Credit 4. Extension Services 5. Herbicides 3 Sorghum 1. Improved Seed 2. Credit 3. Fertilizer 4. Land preparation 5. Pest & diseases (insecticides) 1.fertilizer 2.improved seed 3.land preparation 4.credit 5.extension services 1. Improved Seeds 2. Fertilizer 3.Extension Services 4 Credit 5 Herbicides Table 8. Summary of Production Needs of Farmers Production needs Frequency Percentage Rank Land Credit Fertilizer Improved seeds Extension Services Labour sourcing Land preparation Pest and disease control (insecticides) 214 357 459 426 193 203 291 277 33.44 55.78 71.72 66.56 30.16 31.72 45 47 43.28 6th 3rd 1st 2nd 8th 7th 4th 5th 24
4.4: Harvesting and Storage needs of Farmers Harvesting and storage needs of farmers in order of importance for various crops in each of the SCPZs are shown in Table 9 below. These needs were further pulled together and summarised on Table 10. Fig. 2. shows graphically these needs. As shown on Table 10, availability of uprooting machines and appropriate bagging of both the roots and stems st ndwere ranked 1 and 2 among cassava farmers in Adani-Omor SCPZ. For farmers in Bida-Badeggi zone it is improved cuttings, machines for drying and appropriate bagging. The most important identified need by rice farmers is harvesting machine in Adani-Omor and Bida-Badeggi SCPZs. For the other zones it is the thresher. The other needs are dryers and appropriate bagging for the paddy. Similar to rice, harvesting machines and threshers appear to be the most important needs of the sorghum farmers. 25

Table 9 : Major Harvesting Needs of Farmers by Crops and SCPZs S/N Crop AdaniOmor SCPZ Bida-Badeggi SCPZ Kebbi-Sokoto SCPZ Kano-Jigawa SCPZ 1 Cassava 1.Uprooting machine 2.Bagging 1. Cuttings 2. Drying (drying slabs, drying machines) 3. Bagging - 1. Uprooting machine 2 Drying slab 3. Bagging 2 Rice 1.Harvesting machine 2. Thresher 3.Bagging 1. Harvesting machine 2. Thresher 3 Bagging 4. Drying 1.Thresher 2.Drying 3.Bagging 4. Harvesting machine 1. Thresher 2. Bagging 3. Harvesting machine 4. Drying 3 Sorghum 1. Harvesting machine 2. Thresher 3. Bagging 4. Drying 1.Thresher 2.Bagging 3. Drying 4. Harvesting machine 1. Drying 2. Thresher 3. Harvesting machine 4. Bagging Fig. 2 depicts a summary of the harvesting needs of the farmers. It clearly shows that the need for threshers is the most important, followed by bagging, harvesting machines and dryers in that order. This clearly indicates the level of drudgery in using manual means in harvesting and threshing of the commodities. At present most farmers use knife, sickle or cutlass for harvesting operations. Threshing is mostly done manually. Threshing and winnowing machines are needed while storage facilities beyond the 26
as well as
and
into the
methods of
will also help to reduce the levels of these contaminants as well as reducing attacks by
of
of
are
and
like
normal bags are also required. Farmers also require cemented slabs, tarpaulins heat blown machines hygienic drying their produce. The current unhygienic drying a major source mycotoxins aflatoxin fumonisin produce like aluminium. Appropriate bagging and storage rodents pests.
as well as other contaminants
The use of PICS bags for grains may be considered. Table 10 : Summary of Harvesting Needs of Farmers Harvesting needs Frequency Percentage Rank Harvester Dryer Thresher Bagging 435 427 534 470 67.97 66.72 83.44 73.44 3rd 4th 1st 2nd 27
for

4.5: Processing needs of Farmers Table 11 shows that for cassava, access to improved milling machines; peelers, electricity, water and dryers are the most important needs of the farmers. Other processing machines are: gari and cassava flour modern processing machines, gari fryers and chipping machines. For rice, the table shows that electricity, water, modern processing machines and dryers were the important needs. Still on the farmers' processing needs on rice, modern and more efficient small milling machines, de-stoners and parboilers are also needed. Sorghum farmers ranked processing machines, electricity, water and dryers highest. Fig. 3 further shows that when the data were pooled, the most important needs were clearly modern machines, electricity, water and dryers in that order. Electricity and water appear to be a common need of all processors. The project may consider exploring the use of bio-gass digesters as well as solar energy. Table 11: Major Processing Needs of Farmers by Crops and SCPZs S/N Crop Adani Omor SCPZ Bida Badeggi SCPZ Kebbi Sokoto SCPZ Kano Jigawa SCPZ 1 Cassava 1.Milling machine, 2.cassava peeler 3. Power 4. Water. 1. Power 2. Access to processing machine 3. Water 4. Access to drying 5. Maintenance - 1. Power 2. Processing machines 3. Water 4. Drying 2 Rice 1. Threshing machine 2.Power 3.Water 4. Access to drying 1. Access to Processing Machine 2. Power 3. Access to drying 4. Water 5. Maintenance 1.Power 2.processing machine 3.Drying 4.Water 5.Machine maintenance 1. Power 2. Water 3 Processing Machine 4. Drying 5. Machine maintenance 28
3 Sorghum - 1. Access to processing Machine 2. Power 3. Water 4. Access to drying 5. Cost of acquisition 1.Drying 2.Processing machine 3.Power 4.machine maintenance 5.Water 1. Water 2. Processing Machine 3. Power 4. Drying 5. Machine Maintenance Table 12. Summary of Processing Needs of Farmers Processing needs Frequency Percentage Rank AccePWaterowerss to Drying Access to processing machines Cost of acquisition Maintenance 213140519384498472 33.21.81.607773.75.81098728 3rd 2nd 4th 1st 6th 5th 29

4.6: Marketing needs of Farmers Cassava marketers in Adani-Omor zone ranked good roads, market information and off takers as their most important needs (Table 13). For those in Bida-Badeggi and KanoJigawa zones, the need for off-takers was ranked highest, followed by transportation means and access to market information. Rice farmers ranked off-takers, good transportation and market information highest in that order. The pattern was similar for sorghum farmers. Table 14 and Fig. 4 show that good transportation was the most important need of marketers. This is followed by off-takers and market information. Table 13 : Major Marketing Needs of Farmers by Crops and SCPZs S/N Crop Adani Omor SCPZ Bida Badeggi SCPZ Kebbi Sokoto SCPZ Kano Jigawa SCPZ 1 Cassava 1. Good roads 2. Access to market information 3. Off takers 1. Off takers 2. Transportation 3. Access to Market Information 1. Off takers 2. Transportation 3. Access to market information 2 Rice 1. Good roads 2. Access to market information 3.Off takers 1. Off takers 2. Transportation 3. Access to market information 1.Transportation 2. market information 3 Off takers 1. Access to market information 2.Transportation facilities 3. Off-takers 3 Sorghum 1. Off takers 2. Access to market information 3. Transportation 1. Market information 2.Transportation 3.Off takers 1. Access to market information 2.Transportation facilities 3. Off takers . 30
Processors: The needs of processors varied from zone to zone. Those in Adani-Omor ranked water supply, electricity and availability of paddy as the most important needs. 31
Table 1 4: Summary of Marketing Needs of Farmers Marketing needs Frequency Percentage Rank Access to market information Transportation Off takers 482 549 491 75.31 85.78 76.72 3rd 1st 2nd
4.7: Needs of Other Value Chain Actors
Hitherto, we discussed the needs of farmers. Some of there farmers were also processors and marketers. Apart from them the study also assessed the needs of other value chain actors. These include fabricators, processors, agri-input dealers and off takers. Their specific needs are presented in Table 15 below and discussed below.
stFabricators: Credit facility was ranked 1 in three of the zones. This is followed by rdelectricity, which was ranked second in two of the zones and 3 in another zone. ndSimilarly, access to modern equipment was ranked 2 in two of the zones.

For those in Bida-Badeggi zone,it is credit facility, processing machines and electricity.
Ta
Training of input dealers is very important, as many dealers need to be aware of the various ways to use the inputs the sell safely. As the first point of call by farmers, agriinput dealers should be knowledgeable enough to give the farmers the right advise.
S/N Value
The processors in Kebbi-Sokoto zone on the other hand, expressed need for high quality paddy, spare parts for their machines and credit as their needs. This almost similar to the needs of processors in Kano-Jigawa zone, where, high quality paddy, credit and modern machines are the most important needs.
SCPZ 1 Fabricators 1. Credit 2. Power supply 3. Source of raw materials for fabrication 4. Safety gears 1. Access to credit 2. Access to modern equipment 3. Power 4. Market linkage 1.Power 2. modern welding machine 3.Drilling machine 4.Workshop building 5.Insufficient capital 1. Credit 2. Power 32
Agri-Input Dealers: Credit is the most important need of agri-input dealers. It was st ndranked 1 by respondents from three of the zones and 2 by respondents from one zone.
Off-Takers: Access to credit, power supply, transport and availability of paddy are the most important needs of the off-takers interviewed. ble 15: Main Needs of other Value Chain Actors in the SCPZs Chain Actor Adani-Omor SCPZ Bida-Badeggi SCPZ Kebbi-Sokoto Kano-Jigawa
SCPZ
Agri-input dealers in Kebbi-Sokoto zone ranked training as their most important need.
2 Processors 1. Regular water supply 2. Credit 3. More rice paddies from producers 1. Access to credit 2. Access to processing machine 3. Power 4. Water 5. Transportation 1.High quality of paddy 2. Availability of spare parts 3. Credit 4. More supply of paddy 1. High quality paddy 2. Credit 3. Modern machines 3 Agri input Dealers 1. Credit 2. Good roads 3. Organized market outlet 1. Training 2. Access to credit 3. Access to Market information 4. Availability of input 5. Transportation 1.Credit 1. Credit 2. Market information 3. Market outlet 4 Marketers (OffTakers) 1. Good roads 2. Power 1. Access to credit 2. Transportation 1. Power supply 2.Paddy availability 1. Credit 2. Rehabilitation of roads 33
One of the objectives of this study was to compare the identified needs of ATASP-1 beneficiaries with those needs identified by beneficiaries of other projects. There are however, very few such reports available. Reports of baseline studies of PropCorn and WAAPP were used and complimented by personal experience from TRIMING Project.
4.9: Comparative Assessment of Field Findings with results of other Projects
Table 16: Identified Needs by Different Projects Category of Needs 1
ATASP
PropCorn WAAPP TRIMING Production 1. Fertilizer 2. Improved Seeds 3 Credit 4. Land Preparation 5. Pest and disease control 1 Irrigation Water 2. Fertilizer 3 Labour 4. Land Preparation 5. Improved seeds 1. Fertilizer 2. Improved seeds 3 Credit 4. Water pumps 5. Pesticides 1 Irrigation water 2. Credit 3 Land preparation 4. Improved seeds 5 Harvesting/Storage 1.Harvester 2.Dryer 3. Thresher 4.Bagging 1 Threshers 2. Harvesters 3. Dryers 1 Harvester 2. Thresher 3. Dryers 4 Cleaners 34
The findings are presented in Table 16 below. The table shows clearly that the production needs of ATASP-1 beneficiaries are similar to the production needs identified by the beneficiaries of other projects, the only exception being irrigation water/irrigation pump, which were mentioned by other projects. Similarly, harvester, thresher and dryer were the three main harvesting and storage needs of ATASP-1 beneficiaries and these other projects. While WAAPP and TRIMING as well as ATASP-1 beneficiaries identified good transportation and off-takers, the processing needs of ATASP-1 beneficiaries are more than those of TRIMING. In general however, the needs are similar. It may therefore be inferred that the needs are genuine and should be addressed by the Project.
The needs of the value chain operators, if met will to a large extent assist in improving the yield of the producers and ameliorate the challenges faced by other operators, thereby improving the income of the people and lifting them further away from the poverty line. It is in line with this that the following recommendations are proffered:
i. Power supply: Power supply should be made more regular. Other sources of power supply such as solar energy and biogas can be explored and installed in the communities to improve the power situation in the zones.
ii. Improved Seeds: Improved seeds should be supplied to farmers in the zones to boost their production. ATASP-1 can develop a seed programme with relevant research institutes for the benefit of the farmers. Working with NCRI and AfricaRice on rice, IITA and NRCRI on cassava, IAR and 35
4.9: Conclusion
Based on the findings of the study, the main farmers' production needs were: credit facility, fertilizer, improved seeds and labour saving devises for land preparation. The main harvesting/storage needs were: harvesters, threshers and bags. In processing, respondents focused more on the need to have regular power supply, water for processing and processing machines. In the area of marketing, the most important needs of the beneficiaries were access to market information, transportation-especially good roads and off-takers. The fabricators' needs were regular power supply and soft loan to assist them in fabricating more complex equipment/machines. The major marketing need of the marketers was access to market information, good roads and off takers. 4.10: Recommendations
Processing 1.Processing Machine 2.Power 3.Water 4.Dryer 5.Maintenance 1. Polisher 2. De stoner 3. Parboiler Marketing 1 Access to market information 2 Transportation 3. Off takers 1. Transportation 1. Off takers
v. Roads: Farmers and other operators in the value chain can be mobilised through their cooperatives/group to repair roads in their communities through self-help initiatives.
ICRISAT on, sorghum, the project can obtain foundation seeds and help the farmers start a community seed programme. This will ensure farmers' continuous access to improved seeds and develop entrepreneurship among them on the seed sector. Alternatively, the project can facilitate access to quality seeds by working closely with reliable private seed companies to supply quality seeds to farmers.
iii. Credit: As many beneficiaries still cannot access credit facilities from the banks, it is important for the project to help link the beneficiaries to financial institutions as well as off-takers. This combined approach will make it easier for banks to grant loans to beneficiaries as both the project and the off-takers will stand as guarantors. Processors complained of irregular supply of rice paddy from the producers, while the producers complained of the absence of processors/off-takers to off-take their rice paddy. Efforts should be geared towards bringing these two parties together to complement each other. The extension agents should enlighten the farmers on the need to produce the varieties needed by the off-takers, and the off-takers should be made to honour their agreement with the farmers by paying a certain amount of money as up-front to the farmers to show commitment. The extension agents should serve as a link between the producer and the off-takers
vi. Farming equipment/tools and other Labour Saving Devices: It is recommended that the Project should assist the beneficiaries in acquiring some relevant equipment for agricultural production, harvesting/storage and processing. The equipment being recommended are readily available in Nigeria and can be dismantled and repaired by local fabricators. For land preparation we recommend deployment of power tillers with all accompanying accessories. Different types of mechanical planters are also recommended. Combined rice harvesters/threshers are recommended for rice farmers, while combined rice polishers/de-stoners
iv. Fertilizers and other agro-chemicals: The project should identify in each SCPZ reputable fertilizer and agro-chemical companies/dealers, with the objective of linking the beneficiaries to them so that they can source genuine fertilizer and other agro-chemicals on time and at the right price. The beneficiaries should approach these companies as a group. This should not be a problem as they are already in groups. By working closely with different fertilizer and other agro-chemical companies, the Project will facilitate access of farmers to high quality products.
36
are recommended for rice processors. We also recommend multi-crop threshers that can be used by both rice and sorghum farmers. For drying of the commodities, we are recommending deployment of flat-bed dryers as well as hybrid dryers. For cassava farmers, we recommend cassava tuber up-rooter for up-rooting the tubers as well as cassava washing and peeling machines for washing and peeling the tubers. Brief description of the specifications of the recommended machines as well as their pictures are presented below: (A) Power Tillers with the following minimum specifications. A 15hp diesel engine. Gear V120, with reverse tyre size 6.00-12, 6.00-14. The Length x Width x Height are 2260 x 1000 x 112. Gearbox type – meshing spur gear and sliding. Accessories usually included with this are single plough, disc plough, rotator, trailer, planter and fertilizer accessory. Pic. 1: A Power Tiller (B)Mechanical Planters with the following specifications are also recommended. 6row planter with fertilizer buckets. Light weight, 6 row adjustable from 75cm – 90cm. Can be lifted by 3 – 6 cylinder tractor 37

Pic 2: A Mechanical Planter Pic. 3: A Two-row planter (animal-drawn) 38


(C)Rice Harvester/thresher: Machine, type-project 4L – 0.5.Matching chassis GN81 dragging machine; Type-Fringe Harvest full feeding threshing; Size length x width x height 3620 x 1450 x 1320; Structure quality (kg) – 590; Rated feeding amount (kg/sec) 0.5; Effective cutting rate (cm) 110; Matching power (kw) 8.53 – 9.38 (11.5 – 12 horse power); Oil consumption (kg/mu) 0.90. Pic 4: Rice Harvester/Thresher (D)Multi-crop Thresher: This thresher is referred to as multi crop as it is designed to handle Rice, Sorghum, Millet, maize and Soya Beans. ---Driven by 13-15HP provided with concave sieves for each of the above crops. Machine is mounted on pneumatic tyres for mobility in the farm. It has Single Cylinder horizontal type diesel engine, water cool system, four stroke, and Pre-composition chamber Rated power: 12 hours; Fuel Consumption: 280.2g/kw/hr; Oil consumption: 4.76g/kw/hr. Water consumption 1360g/kw/hr; Capacity: 1 ton/hr. 39

Pic 5: Multi-Crop Thresher (E)Flat Bed Dryer: Electrical/mechanical flatbed drier. It has electric elements of 5kw and 5ph blower for fan. Mechanical – Heat exchange (coal, husk and briquettes). Capacity: 700-1400kg/batch 4kw electrical motor or diesel engine 175: 6hp single cylinder horizontal type, water cool system, four stroke, and pre-composition chamber. Fuel consumption: 280.2g/kw/hr; Oil consumption: 4.76g/kw/hr. Water consumption 1360g/kw/hr. Pic 6: Flat bed Dryer 40

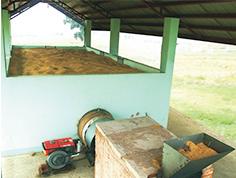
(F) Rice Polisher/ De-stoner: The De-stoner consists of feeding hopper, casing, screen body (screen boat and Blower) repelling chamber, eccentric structure, and suspension rod structure. Screen: Sliding angle 10-12 Degree, Angle of outlet 60 degree & whole size 14x1.0mm. Screen of repelling chamber: size 150x100mm & whole size 12x1.0mm. Eccentric Structure: Eccentric size 4.5mm, Angle connecting rod 25-28 degree & frequency 395T/Min. Blower: Blade size (LXW) 265x90mm & Speed 1200rpm. Power required: 0.25kw & Weight 75kg. Capacity: 500kg/hr. 3HP electric motor, 1440rpm.
Pic 7: Rice Polisher/De-stoner (G) Cassava Peeler: The cassava washing and peeling machine can peel cleanly. The cassava washing and peeling machine can be made of carbon steel or stainless steel. The machine adopts the brush principle, as cleaning and peeling. This machine can either separately clean, or can wash and peel at the same time. Equipment good appearance, convenient operation, cleaning (peeling) of large volume, high efficiency, and energy consumption is small, can work continuously. Brush roller materials processed with special craft, so can be durable. 41

Pic. 8. A Cassava Peeler (H) Cassava Up-rooter The Cassava Up-rooter is a robust equipment used for cassava harvesting on both clay and sandy soils. Minimum Power Requirements: 80 HP (coupled to 3-point hitch) Working Capacity: Harvests 2 rows at the same time with cassava planting distances from 80 to 100cmSoil disturbance is minimum leaving the cassava plant at the same site with no roots damaging. Attachments: Equipped with front disk and depth control wheels. Average Yield: 3 - 4 ha / day. Weight is 340 kg. Main Advantages: less drudgery, fast and efficient work, easy to handle machine and costs reduction. Pic. 9: A Cassava Up-rooter 42


(I) Hybrid Dryer Pic. 10: A Hybrid Dryer 43

Some Criteria for deploying Improved Technologies to Groups
The group members are in need of the technology being provided; They are willing to adopt the technology; They are willing to pay a token for the technology; Group members are willing to allow their wives and youth to be involved the management of the technology; They are willing to ensure proper use of the technology, hence will keep both technical and financial records; They see the use of the technology from business perspective.
vii. Technology deployment: Introduction of improvedagricultural technologies are key drivers of achieving the objectives ATASP-1. Increase in yield of crops per unit area, efficient control of pests and diseases, enhanced commodity quality, improved processing and value addition are all dependent on the scale of deployment of respective technology. Agricultural technologies can assist reduce vulnerability. It is recommended that ATASP-1 deploy improved technologies through groups. The following criteria may be considered.
7. Train the sub-group on the use of the technology
Deployment Strategy
3. Agree on the payment modalities with the association/group;
4. Agree on the modalities of managing the technology with them;
2. The association/group is willing to pay 10% of the cost of the technology;
8. The sub-group to use the technology as an income generation activity;
10.The sub-group must agree to pay 30% of their profit to the main group.
9. The sub-group must agree to keep accurate record of their income and expenditure;
1. Identify a 'performing' association/group;
viii. Community Seed Multiplication: The priority agricultural commodities that ATASP-1 is presently promoting are rice, sorghum and cassava. Scarcity of improved and appropriate varieties of agricultural seed has been one of the constraints to high agricultural productivity in Nigeria. The quantity of certified seed produced by local seed companies is meeting less than 10% of the national requirement. The Federal and State governments have tried various forms of procurement subsidies and incentives to address the problem, but the scarcity of high-quality seeds for the nation's priority crops has persisted. Under a broad strategy aimed at contributing to significant increases in 44
5. In case of mechanical technology, work with the members to establish subgroups within the groups;
6. Sub-groups could be youths and women, and between 5-10 persons in number;
the national supply of improved genetic materials, ATASP-1 should strive to make intervention to increase the production and supply of agricultural seeds. This involves targeted scheme-wise increases in the production of improved varieties of certified seeds by supporting community-based seeds multiplication to sustain rural agricultural seed sufficiency in the project areas. The following procedure is suggested.
1. ATASP-1 to procure some quantities of foundation seeds from the Mandate National Agricultural Research Institutes (NARIs).
3. The criteria for selecting these selected farmers' associations are to be setup by the Project and made known to the farmers' associations.
4. The Project and NARIs will work with each farmer's association to identify farmers in the groups that would multiply the foundation seeds to certified seeds.
6. ATASP-1 is to link up with the seed council for monitoring and certification of the seeds multiplied.
11.That attempts by seed companies to buy off seeds at lowest prices from the ATASP-1 assisted seed farmers during harvest time should be resisted by the ATASP-1 and NARIs, in order to protect the aims and objectives of ATASP-1 intervention in community seed multiplication. 45
5. The Project and NARIs are to guide the farmers in the entire process of the multiplication.
7. That after harvesting, declaring and getting inspection and certification for their certified seeds, each participating farmer in the ATASP-1-assisted community seeds multiplication project shall share at least 10kg of the seeds with at least 10 other farmers within the community, with the details carefully documented by the Project and NARIs.
2. These foundation seeds are to be distributed in conjunction with the with the research associates of the outreach program to carefully selected farmers' associations in the zones.
8. That the Project and NARIs should take the initiative in ensuring appropriate bagging, branding, inspection, certification, tagging, and appropriate storage for the seeds, whether in central or decentralized storage as may be appropriate to scheme.
10. That, as a last resort after the seed needs of the state have been fully met for each commodity, ATASP-1, with the assistance of the NARIs, could negotiate good prices and sell the remaining seeds in bulk to private seed companies;
9. That the ATASP-1 and NARIs would explore seed markets in the states, where to sell off their surplus seeds, if any; and that appropriately bagged, branded, certified and tagged seeds would increase the presentation and marketing appeal for the seeds; and
FAO (2017) References 46
Aderinto, A, S.F. Adedogin and O.M. Dada (2010). Extension Needs of Cassava farmers in Yewa North Local Government Area of Ogun State, Nigeria. Nigerian Journal of Rural Sociology, 10 (11): 67 – 74.
Economy News of Business Day (2017), August). Northern Nigeria Flour Mills Invests NGN 2 billion in New Sorghum Plant in Kano.
Ahmad Tijjani and Abubakar M. S. (2016) Draft Report of Kebbi State Rice Farmers Baseline Survey Anonymous: Promoting productivity in the priority crops in Kebbi State-linking data and Anonpolicyymous (Free Online Course – Undated). My Naija Naira: How to Start Rice Farming Business in Nigeria. Azih, I. (2008). A Background Analysis of the Nigerian Agricultural Sector (1998 to 2007). OXFAM NOVIB Economic Justice Campaign in Agriculture Report. Pp 49 Collins Nnabuife (2017). Rice Production: As Jigawa Prepares to Feed the Nation. In: Nigerian TRIBUNE Newspaper, June 13, 2017. Darlinton Omeh (undated). How to Start Cassava Farming in Nigeria (Step by Step). Retrieved from: https://www/wealthresult.com/agriculture/cassava-farming.nigeria.
FAO Corporate Document Repository 5. Development Clusters in Nigeria (2007) Retrieved from: . Country Brief- Nigeria, February 15 Ibrahim Musa Giginyu (2017). BUA to Establish 200,000 tonnes Rice Processing Plant in Jigawa. In: Daily Trust Newspaper Report, June 15, 2017. IITA Guide (2012): Starting a Cassava Farm. Retrieved from: . IITA News (2017). ATASP – 1 Holds First-ever “Sorghum Innovation Platform” in Kano. Maiangwa, M.G. and A.O. Ogungbile (2008). Seed varieties and quantities of chemical www.fao.org/docreport/007/y5548e00.htm
Manyong, V. M., Ikpi, A., Olayemi, J. K., Yusuf, S. A., Omonona, B. T., Okoruwa, V. and Idachaba, F.S. (2005). Agriculture in Nigeria: identifying opportunities for increased commercialization and investment. IITA, Ibadan, Nigeria. Pp 159.
Ojehomon, V. E. T., Adebayo, S. B., Ogundele, O. O., Okoruwa, V. O. Ajayi, O., Diagne, A. and Ogunlana, O. (2009). Rice Data Systems in Nigeria, Building Rice Data System for Sub-Saharan Africa. A National Rice Survey Report. Pp 78. Oliseyi (2017). Dangote Rice Targets 14 States to Empower Local Farmers. In: The Cable News and Views Unlimited, February 13, 2017. Omoregbee, F.E., and T.O.A. Banmeke (2013). Information needs of cassava farmers in Delta State of Nigeria. Tanzania Journal of Agricultural Sciences, 12 (2). Oni O., Ekonya E., Pender J., Phillips D., Kato E. (2009). Trends and Drivers of Agricultural Productivity in Nigeria. International Food Policy Research Institute. Nigeria Strategic Support Programme (NSSP) Report 1 PrOpCom (2007a). Baseline Survey of the Kano Rice Value Chain: Final Report, pp 127. PrOpCom (2007b). Mapping of Production and Processing Cluster in Kano, Jigawa and Katsina State. Monograph Services No. 19 [Prepared by: Community Empowerment Initiative of PrOpCom (Making Nigerian Agricultural Market Work for the Poor)]. 2015 NBS (2014) World Fact Book 47
fertilizer used in agricultural production in Northern Nigeria. Global Journal of Agricultural Sciences, 7 (1): 77 – 83.
Mohammed A.B., A.H. Wudil, M.I. Daneji, J.M. Jibrin, M.A. Hussaini, and I.B. Mohammed (2015). Economics of on-farm sorghum – legume strip cropping in Kano State, Nigeria. Journal of Agriculture and Sustainability, 7 (1): 99 – 113. Report of LSMS Integrated Agriculture General Household Survey Panel (2012-2013) in collaboration with the FMARD and the World Bank- NBS farm household survey 2012-2013
ANNEX 1: QUESTIONNAIRE FOR BENEFICIARY NEEDS ASSESSMENT OF ATASP-1 FARMERS A. Background Information 1. Name of farmer ……………………………………………………... 2. Name of community/village……………………………………… 3. LGA ………………………………………………………………………… 4. State:……………………………………………………………………… 5. Age of farmer:………………………………………………………… 6. Marital status: Married [ ] Single [ ] Widow [ ] Separated [ ] Divorced [ ] 7. Sex: Male [ ] Female [ ] 8. Are you head of your household? Yes [ ] No [ ] 9. What is the number of people presently living with you?................................................... 10. What is your highest educational attainment? Koranic [ ] - Primary [ ] Secondary [ ] Post-secondary [ ] - Mass literacy school [ ] No formal education[ ] B. Membership of Associations/groups 1.Are you a member of any association or group? Yes [ ] No [ ] 2. If yes what is the main business of the association. MarkCreditFarmingeting - Religious/cultural 3. What benefits do you derive from the association? (Tick as applicable) - Credit linkage [ ] Yes [ ] No Fertilizers [ ] Yes [ ] No Other inputs [ ] Yes [ ] No Market outlet [ ] Yes [ ] No - Social network [ ] Yes [ ] No 48
C: Farming System 1. Do you own a farm: Yes [ ] No [ ] 3. How did you acquire your farm land? Inheritance [ ] Yes …………….(ha) Purchase [ ] Yes …………………..(ha) Rentage [ ] Yes …………………..(ha) Borrowed [ ] Yes ………………….(ha) Shared cropping [ ]Yes ……………..(ha) Lease [ ] Yes ……………………………(ha) 4. What is your crop enterprise? …………………………………………. 5. What other crop enterprise do you have? i) -------------------------------------- ii) -------------------------------------iii) --------6.-----------Whatare the average farm sizes devoted to above crop enterprises and their yields in your farm in the last planting season? Crop enterprise Farm size of the enterprise (ha) Yield from enterprise (Kg) Crop (ATASP-1) Crop 1 Crop 2 200 49
7. For above enterprises, give your current level of input usage per hectare. Input Crop (ATASP-1) Crop 1 Crop 2 Qty of fertilizer Qt(bags)yof organic manure (specify Qtunit)yof herbicides (litres or kg) Qty of WPlaLandaLabQtkg)pesQtorinsecticides(litreskg)yofticides(litresoryofseeds(Kg)our(manys)dclearingntingeedingHarvesting 50
8. What were the costs of the following farm inputs in the community in 2016 rain fed cropping season? Farm input Unit Unit price Total cost NPK fertilizers Bag (50kg) Urea fertilizers Bag (50kg) Farm Yard Manure Specify unit Insecticides I litre Herbicides 1 litre Improved Seeds: Kg Rice Sorghum Cassava cutting No. Labour: Man day Ridging Planting Weeding Fertilizer application Agro chemical spray Harvesting 51
9. Of crops named in Q4, state the type of variety you cultivated last season Crop cultivVarietyated* Name of variety Source of the variety Yield from 1 hectare of farm (kg) CropCrop1ATASP-121 Improved variety; 2. Local variety 10. How is the farmland prepared before cultivation? i) Slash and burn (ii) use herbicide 11. What is the main method used to cultivate your farmlands? i) Zero tillage ii) Manual ridging iii) Tractor iv) Animal traction 12. What are the available sources of farm advisory/extension services to Sourcesyou? of servicesadvisory/extensionfarm Frequency of services: 1= 1 2 contact/year 2= 3 5 contact/ year 3=>5 contact/year Quality of services 1=receivednotso good 2= 3=verygoodgood ATASP LOtherStateRice/ICRISA1/IITA/AfricaTADPProjectsGAAgricDeptstaff 52
NGOs Private Company extension/off takers Lead farmers Not available at all 13. What are the credit sources you use? Sources of farm credit Tick Is the credit coming from this source always adequate? 1= Yes, 2=No Family members Personal savings Commercial bank Cooperatives/Groups Government projects Bank of Agriculture NGOs Money lenders Commodity Dealers/processors/Off takers 53
14. Which of these improved agronomic practices are you aware of, using and if not, why? ? Improved agronomic practices Additional two columns for aware and use Awareness (Tick) Use (Tick) If not using, why? 1= not compactable with our mixed cropping practice 2= Too labour demanding 3= Too costly to practice 4= It does not protect the soil 5=Not aware Crop fertilizer recommendation Spacing of crops within row Spacing of crops between rows Sole cropping Crop spraying Use of improved crop varieties Separating crop of different varieties at harvesting and bagging 54
16. Indicate your main production needs and rank them in order of Productionimportance*Activity What is needed Rank *1 Very important, 2 important, 3 less important land, credit, fertilizer, improved seeds, extension, labour sourcing; land preparation, planting, weeding, pest and disease control D: HARVESTING /STORAGE NEEDS OF THE FARMERS 1. How do you harvest your crops from the fields? Please tick i) Manually with sickle and knife (ii) Hand operated harvesteriii) combined harvesters 55
2. How much do you pay to harvest your crop enterprise below: Crop enterprise Farm size (ha) Cost of harvesting labour * Per ha cost ATASP 1 Crop 1 Crop 2 * If in Kind, please cost it 3. How are your produce moved from farm to homes after harvesting ? Mode of transportation Unit Cost per unit Average distance (Km) Head portage Cart load Donkey/Camel load Motor cycle Pick up van Bicycle Tricycle (Keke Napep) 5 ton lorry Trailer 56
4. How are your Produce moved from farm/homes to market? Mode of hometransportation Unit Cost per unit Average distance (Km) Head portage Cart 5.TNapep)TBicyclePickMotorloadDonkloadey/Camelcycleupvanricycle(KekerailerHowareyour produce stored at home ? Method of storage Unit Cost per unit 1. Rice Paddy in bags Bags in store metal PrivCommunitWMetalPlasticbinsdrum/Jericandrumsarehousesystoragestoreatesilos 57
6. Indicate your main harvesting needs and rank them in order of importance.* Harvesting Activity What is needed Rank * *1 – Very important, 2-important, 3-less important Cutting, drying, threshing, bagging 7. DO you use chemicals to store your produce? Yes [ ] No [ ] 8. If yes, name the storage chemical ……………………..................................used................................... 9. On which crop did you use the storage chemical ……………. 10. What are your main ……………………………………………………………………challenges………………………………………………………………………………………………………………………… E: PROCESSING NEEDS OF FARMERS 1. Who processes your farm produce? -Self Wife -Hired Labour Take to a Mill - Group processing - Do not process 58
1. What are the post harvest operations carried out before harvested crops are sold? Please tick as appropriate Post harvest operations Rice Sorghum Cassava Threshing Cleaning/sorting Milling for flour Milling for grain Peeling Cutting into chips and drying Garri Fufu/akpu Starch Packaging in small size bags for sale Storage for at least 3months 3. What agro processing facility(ies) are functioning in your community? (government or private owned) i) ----------------------------------ii) --------------------------------iii) ------------------4. What type of processing facilities that farmers want and are not available in your i)community?------------------------------------------------- ii) --------59
5. Indicate your main processing needs and rank them in order of importance* Processing Activity What is needed Rank *1 Very important, 2 important, 3 less important Water, power, access to drying, access to processing equipment, cost of acquisition, 6.maintenance,Whatchallenges do you face with processing of your ATASP-1 farm produce? i) ------------------------------------ ii)------------------------------iii) ----------------------F: MARKETING NEEDS OF FARMERS 1. Where do you sell your produce? Market type Rice Sorghum Cassava At home LocalFarm market Regional market takCompany/processors/Offers Identify regional markets 60
3. What arrangement do you have in place for the up-take of the commodity? Rice -1-----------------------------4Cassav……………………………………………………………………--------------------------Sorghum…………………………………………………………………………………………………………………………………………--------2------------------……………………………………………………1----------------------------------------------2-------------------------------a-1---------------------------------------------------------------------------------------------------2------------------.Whatvolume/quantitiesofthesecommoditiesdidyouselllastseason?a)Paddyrice--------------------------------b)Milledrice-------------------------c)Sorghum-----------------------------------------d)CassavaChips-------------------------------e)Cassavatubers------------------------------f)Cassavaflour------------------------------g)Cassavacuttings………………………………………………………..h)Cassavastarch……………………………………………………………i)Garri--------------------------------j)Akpu/fufu…………………………………………………………………… 2. Are there off takers (dealers/companies) of these ATASP 1 crops in which you are involved? Crop Name of off taker (s) Rice Sorghum Cassava 61
*note: convert the local units to Kg 5. Indicate your main marketing needs and rank them in order of importance* Marketing Activity What is needed Rank *1 as the most important Access to market information, transportation, off-takers arrangement 6. What are the problems you face in marketing your farm produce? c)--------------------------b)--------------------------a)------------------------------------------------------------------------------------------------------------------------------------------------------62
ANNEX 2: CHECKLIST FOR DISCUSSION WITH PROCESSORS, OFFTAKERS, AGRO-INPUT DEALERS AND FABRICATORS PROCESSING NEEDS OF THE PROCESSORS: 1. Name of Processor 2. Name of the company/group 3. Office address, emails and phone numbers 4. Commodity of business 5. Installed Capacity 6. Current capacity utilization 7. Financial strength 8. Access to credit 9. Access to insurance 10.No. of Employees 11.Sources of produce for processing 12.How many months in a year operational 13.How do you dispose what you process 14.Apart from yourself, whom do you process for? 15.What type of relationship do you have with the farmer? 16.What challenges do you have in recovering advances made to farmers if any? How do you resolve this problem? 17. How do you source your raw materials? 18.How is the price for the raw material determined? 19.How is the processing fee determined? 20.How is the price of the processed commodity determined 21.What are the Challenges with obtaining raw materials for processing? 22.What are your major processing needs? 23.What are your suggestions for meeting the above needs MARKETING NEEDS OF OFF-TAKERS 1. Name of Off-taker 2. Name of the company 3. Office address, e-mails and phone numbers 4. Commodity of business 5. Installed Capacity 6. Current capacity utilization 7. Volume of off-take from farmers 8. Financial strength 9. Access to credit 10.Access to insurance 11.No. of employees 12.What type of relationship do you have with the farmer? 63
13.Do you have challenges in recovering advances made to farmers? How do you resolve this problem? 14.Sources of produce for processing 15.How many months in a year do you operate? 16.Do you process what you off-take or you sell to others? 17. What arrangement do you have with farmers regarding 18.-gr-pricing?ading?-quantity?Variety?Whatarethe Challenges you face as an off-taker? 19.What are your major needs? 20.What are your suggestions for meeting the above needs AGRO-INPUT DEALERS NEEDS 1. Name of agro-input dealer 2. Name of the company 3. Major inputs company deals on -Equipment-P-Herbicides-fSeeds/cuttingsertilizersesticides 4. Sources of Seeds and other inputs 5. Does the company offer advisory service to clients 6. What are the major Challenges? 7. What are your major needs? 8. What are your suggestions for meeting the above needs AGRO-EQUIPMENT FABRICATORS' NEEDS 1. Name of fabricator 2. Name of the company 3. What type of equipment and tools do you fabricate 4. Capacity of the company 5. Number of workforce 6. Does the company offer advisory service to clients 7. What are the challenges you face? 8. What are your major needs? 9. What are your suggestions for meeting the above needs 64
65
4 Method
ANNEX 3: CHECKLIST FOR DISCUSSION WITH LEADERSHIP OF FARMERS' GROUPS AND OPINION LEADERS Task 1: Production Needs of farmers 1. Name of SCPZ 2. Name farmer groups in the community/SCPZ 3. Names of main respondents and their positions 4. Name of Community 5. How do farmers acquire farm lands in the SCPZ (rank in order of importance) 6. What are the dominant crops in the SCPZ 7. What are the dominant crop enterprises (crop combinations on the farmer fields) in the SCPZ? 8. What are the average farm sizes devoted to above crop enterprises and their yields in the zone? 9. For above enterprises, give the current level of input usage per hectare in the 10.SCPZWhat were the average costs of the following farm inputs in the SCPZ in 2016 rain-fed and dry season cropping season? 11.Varieties of crops cultivated last season from question 4 12.How is the farmland prepared before cultivation? 13.Various methods used to cultivate the farmlands in SCPZ 14.What are the available sources of farm advisory/extension services to farmers in SCPZ? 15.Which of the advisory/extension services is most available to farmers in the 16.zone?Whatare the credit sources used by farmers in the zone? 17. Improved agronomic practices carried out by farmers
5.
2.
3.
1.
1.
2.
Task 2: Harvesting/Storage Needs of the farmers How are crops harvested from the fields in the zone? Cost of harvesting one hectare of crop enterprise Method of transporting farm produce from the farm to homes after harvesting in the zone of transporting harvested crops from farm/homes to market in the zone Storing harvested crops at homes in the zone Task 3: Processing Needs of the Farmers Size of your operation? Small, Medium or Big Where do you sun dry/thresh your produce?
3. Which part of your machine do you replace regularly and how much does it cost? 4. How do you package your product? 5. How do you grade and standardize your product? 6. Level of post-harvest operation carried out by farmers before harvested crops are sold in the zone. 7. What are the agro-processing facilities that are functioning in the community? 8. Type of processing equipment that farmers need 9. Challenges faced by agro-processors in the zone 10.How do you think ATASP-1 could improve your processing challenges? Task 4: Marketing Needs of the farmers 1. Where farmers sell farm produce 2. Are there off-takers (companies) of these crops in the zone? 3. What are the arrangements for the mopping up of these commodities with off-takers in the zone? 4. Challenges farmers face in marketing their farm produce in the zone 5. What is the average volume/quantity of these commodities traded in the zone? 66
Annex 4: List of Other Value Chain Actors Interviewed and their Locations Adani-Omor SCPZ S/n Name of Value Chain Actor Company Name Location Capacity 1 Fabricators 1. Ihegazio Ifeanyi 2. Uguronwa Onyekacki 3.Ifeanyi Ugwu 4. Obiezu Igwe Jehova bu Eze Uguronwa Onyekachi Ifetex fabricating and welding comp Ebekuodike Ezira Ayamelum Mbu Ogbaru Idustrial-2 Processors 1. Pius Okoli 2.Gabriel Nwakamma 3.Nnacheta Francis 4. Ugwuodo Samuel 5. Olisah Azubuike Pius Okoli Allied Farmers’ cooperative Chetason Mills Ltd Ugwuodo Samuel New Garden Eke Ezira Omunebo Ogbunka Ikpa Ikenga Village, Anaku Nkwo market, Mbu Ogbakuba/ Nkochie village 25bags of 100kg of garri/day 3bags of 50kg of garri/day 7tons of rice/day67
3 Marketers (Off-Takers) 1. Isaac Irechukwu 2. Timothy Okeke 3. Obidike Charle 4.Ani Agartha 5. Ikwuazor Lilian Isaac Irechukwu Timothy Okeke Altex Agro Rice mill ltd Ani Agartha Ogbakpu Ezira Omunebo Ogbunka Anaku Mbu Umunkwo, Ogbakuba20bags of 100kg of garr/day 30ton/day4 Agri-Input Dealers 1. Mmaduka Okoli 2. Mrs Esiobu Theresa 3. Okechukwu Ada 4. Eze Judith 5.Onuba Emmanuel Organiru Ezira Farmers’ Ass. Theresa Esiobu C.J. Agro chemicals Eze Judith Emma Container Ezira Ogbunka Ayamelum Nkwo Mbu Ogbaru--68
Annex 5: List of Other Value Chain Actors Interviewed and their Locations in Bida-Badeggi SCPZ S/n Name of Value Chain Actor Company Name Location Capacity 1 Fabricators 1. Baman AbdulJeli JELI Technical Work Ltd Siriko Lavun LGA 200 milling machines per year 2. Solomon Jiya Solomon Welding Works Muwo 3 crusher per week 3. Ebenezer Olutowe Ekossa Gbachetako Agaie 4 milling machines per week 4. Aliyu Ibrahim Aliyu Welding Works Emi-woro Wushishi 3 threshing machines per week 2 Processors 1. Dr. Salihu Alkiili Makila Dev Concept Ltd NAMDA Zonal Office Bida 5 6 tones/day 2. Hajiya Aishatu Nnadu Muwo Muwu 4 5 tones/week 3. Esther David Yandako Canciki company Muwo 4 5 tonne 4. Jibrin Mohammed Mokwa LGA Agaie 2 – 4tonnes/week 69
3 Marketers (Off-Takers) 1. Zacceus Salawu J.S Ltd Adjacent Police station Doko Lavun 310tonne/year 2. Aishetu Mohammed Muwo Muwo Mokwa LGA 4tonnes/week 3.Mohamed Ndastu Lochitagi company Emi Lochitachi Kutiriko 4tonnes/week 4. Abdullahi Salihu Salihu company Shabalegbo 3 4tonnes/week 4 Agri-Input Dealers 1. Mohammed E gana Gana Agro chemicals Ltd Lemu Market Gbako LGA 2 million naira 2. Alh. Rubiru Ibrahim Ndabenu Gbako Ndabenu Agro Muwo Mokwa LGA 1 million naira 3. Bala Mohammed Chemical Young Shall Grow Chemical Sonaghiko 500,000 naira 4. Maimana Mallam Sanni Ena woro company Emi liman kuku mantuntu 150,000 naira 70
Annex 6: List of Other Value Chain Actors Interviewed and their Locations in Kebbi-Sokoto SCPZ S/n Name of Value Chain Actor Company Name Location Capacity 1 4.3.2.1.Fabricators 1. Shafiu Samaila 2. Welding)Ahmed4.Mafara3.AhmedA-MustaphaAbdullahiIbrahim(Lamidi ---- NANANANA 2 4.3.2.1.Processors 1. WACOT Rice 2.LtdLabana Rice Mills Ltd 3. Attajiri Rice Mill KM SokotoRoad,KalambainaNewNo.KebbiBirninRoad,AbachaSaniKmArgunguRoad,Sokoto2,Off22-24,Arkilla 130,000MT paddy/year18,000MT-paddy/yearofof 71
4. Mall. Aminu Enterprises)processingWara6.N5.YusufAbdullahomaAliyuMasana(masana Yar NgaskiBaguCommunity,KwallaKwareKware,Area,YahayaLGALGA.LGA 7 2MT/day2.2MT/dayMT/day 3 Marketers (Off-Takers) 1. 2. 3. 4. 1. WACOT Rice Ltd 2. Attajiri Rice Mill KM Sokoto Road, Argungu 22-24, New Arkilla Kalambaina Road, Sokoto 130,000MT of paddy/year 18,000MT of paddy/year 72
4 Agri-Input Dealers 1. 2. 3. 4. 1. Abubakar Kwaido 2. Alh. Garba Kware 3. Muhammad ShagariKware Yar Bargu NA NA NA 73
Annex 7: List of Other Value Chain Actors Interviewed and their Locations in Kano-Jigawa SCPZ nS/ Name of Value Chain Actor Company Name Location Capacity 1 1.FabricatorsEngr.Ilyasu Nazifi 2. Musa Ya’u 3. Ibrahim Bature 4. Alh. Na Yalli 5. Idi Makeri 6. Ibrahim Bilya 7. Dan Baba 8. Sale Makeri 9. Alhassan Aminu 10. Abdullahi Garba 11. 15.F/Dutse14.Sara13.12.MaazuBulamaAbdullahiMakeriHarunaMakeriAdamuMakeriAbdulwahabu Makeri Wak Prime Wave Ltd. Kofar Yamma Makera Chirin TsakunwaRahamaBabbar-NayalliMakeraAgroChemicalsMakeraG/malamProcessingCentreAgroEquipment KarfiWakCikinF/DutseSaraGwanjoMakaddariFadaUnguwarTonikutarKuduDawakinKuduDawakinUnguwarGwariG/malamMakeraSabonKanoKanoBunkureKanoGariKuduGari-Dogon SmallSmallMediumSmallMedium 74
2 Processors 1. Imran Muhd. Aminu 2. Hamza Sharif 3. Murtala Uba 4. Raji Mai Inyi 5. Abba Burji 6. Yahanasu Ibrahim 7. Murtala Muhammed 8. Ibrahim Muhammed Mailunji 9. Saminu Usaini Sara 10. Yakubu Mamuda 11. Yusif Babalo Wak Alwabel Star Trading Ltd (Rice mill) Bunkare Yan’tsaba Processing Stall Chirin-Cikin-gari Processing Stall Inyin RajiGidan Ibrabim Takule Makaddari Processors Association Bakin Kasua Rice Processing Centre Yakubu Sorgum Milling Machine Yusif Processing Centre Kano Yan’tsaba ChirinCikin-gari Garun Malam Burji Gwari Yamma Tonikutar Unguwar Yamma Makaddari Barkin Sara Farin Dutse WakDakatsalle 25 tons/da y Small 75
3 Marketers (OffTakers) 1. Umar Salisu 2. Umar Ado 3. Abubakar Lawan 4. Muhammad Danfuma 5. Musa Haruna 6. Mal. Abdu 7. Alh. Sani Yusuf 8. Abdullahi Garba 9. Garba Ibrahim Tonikutara 10. Habu Makaddari 11. Mahmud Idris 12. Adamu F/Dutse 13. Akilu Ibrahim Panda Shagon Umar gindin dimiri Bunkare Yan’tsaba Marketing Stall Abubakar Grains Stall Furse Rice Millers Musa Haruna & Co. Sani Yusuf and Brother Nagari zrice Mill Shinku Store F/Dutse Kakin- kasuwa Store Panda Agro-allied groups Yan’tsaba ChirinCikin-gari Kano Kano Dangyatin Makwalla Kofar Yamma Dawakin Kudu Tonikutar Unguwar Yamma Tonikutar Makaddari Bakin Kasuwa Sara WakDakatsalle 80bags of grains/d ay 670bags /day 70 bags 30tons/ year 50bag/ month 76
4 Agri Input Dealers 1. Balarabe Shehu 2. Mamuda Dan 10.Makaddari9.Sani8.Dawaki7.6.Mal.Tak6.5.Isyaku4.Akilu3.BelloMuhammaduAbdulrahamanBelloMaigidaMuazuMusaMaiiBalarabeAminuIdrisDanladiUmarUmarTasiuAbubakar11.AhmedYusuf12.BilyaminuIsah Greenspores Agric Ltd. Shagon Mamuda BilyaShagonShagonMakaddariChemSarikinTripleFARISDaddaudaShagon-MuhammaduMNomaAgro-icalCompanyArewaAlh.TasiuMalamYusifAgro-sellersShop DakatsalleWak-DutseFarkinSaraBakinMakaddariYammaUnguwarTonikutarYammaKofarMakwallaKasuwaBakinDanguyatinKanoKanoDaddaudaKanoKanoKanoKasuaBakin SmallSmallMediumMedium 77
The communities in the local government areas of the various states in the zone are shown in table 4.1. In Anambra state, farmers' cluster more in Orumba North local government area. The farmers were found in six different kindreds in two major communities – Omogho and Ndiowu. In the two major communities sampled in Ayamelum, farmers were clustered around four villages as shown. The two major communities were Anaku and Omor. Other LGAs in Anambra State were Ogbaru and Orumba South with two villages/communities sampled respectively. In Enugu State, IsiUzo LGA had the most villages in the two communities sampled (Amufu and Mbu).
Table 4.1: Farmers clusters and cooperatives/group State LGA Communities Name Cooperofative/group
REPORT OF ADANI-OMOR SCPZ 4.0 RESULTS AND DISCUSSION: 4.1 Socio-economic Characteristics of respondents
The socio-economic characteristics of producers in the study area were analysed and interpreted. The section describes the socio-economic variables and how they influence the level of crop production in the study area. The socio-economic variables examined included: farmers' age, household size, membership of cooperative/group and educational status. Others were: gender, land tenure system, farm size and yield of major crops 4.1.1 Social Characteristics
Anambra Orumba North Ndiowu/UmughoNdiowu/UwudiaborNdiowu/UhuezeNdiowu/UbahaOmogho/IOmogho/Umanalasianachi
Ezinwanne farmers’ co operative society, Omogho 78
4.1.1.1 Farmers' clusters and cooperatives/group
Enugu OrumbaOgbaru South IUzoAyamelumUwanisiUzo Ezimo-Agu-OrbaOgbodoEjionaUwuamiEjionaAmedeOguruguAdaniOmorAnaku/UmuriaAnaku/IkAnaku/UmuezeaguOgbunkaObuotuOgbakubaAtani/AbohEziraengaEhaAmufuMbuMbuMbuMbuAgu Ifedi groupNwfgroupUmunnabuikfofgroupgroupObinwpurposedimkpaChibuikfNwChibuezeDoyEzircooperEnIChinonsoNwOgbakubacooperfarmers’ativesociety,anneamakagroup,groupgwebuike,Ezigboyi,Champion,OgadiativegroupagroupenYouthFarmers,group,annedinambaarmers’group,emgroup,Afofarmers’multicooperativesannefarmers',Chiderafarmers',Obiomagroupsfarmers,Oganiruarmersgroup,efarmers',Igwebuikearmers'group,achinekefarmers'.-Udenu 79
4.1.1.2 Age distribution Tables 4.2A&B show the age distribution of ATASP-1 farmers in the study area. The study revealed that 70% of the farmers were within the active age range of 21 – 50 years in Anambra State while 80% of the respondents in Enugu State were within the same age bracket. However, 30% and 15% of the farmers were more than 50 years old in Anambra and Enugu States respectively. The average age of the farmers was 45 years in Anambra and 44 years in Enugu. This implies that the mean age of farmers in both States are still active and can positively influence farming activities in the study area. Table 4.2A: Distribution of respondents according to age in Anambra State Age Frequency Percentage 21 30 31 40 41 50 51 – 60 >60 7 21 28 20 4 8.75 26.25 35 25 5 METOTALAN Max Min 80 45.06 81 24 100 Table 4.2B: Distribution of respondents according to age in Enugu State Age Frequency Percentage 21 30 31 – 40 41 50 51 60 >60 4 24 20 9 3 6.67 40 33.33 15 5 METOTALAN Max Min 60 43.5 70 21 100 80
Household size (Number) Frequency Percentage 1 5 6 10 11 15 >15 26 46 7 1 32.5 57.5 8.75 1.25 TOTAL MEAN Max Min 80 7.04 20 2 100 Table 4.3B: Distribution of respondents according to household size in Enugu State Household size (Number) Frequency Percentage 1 5 6 10 11 15 >15 20 38 2 0 33 33 63.33 3.33 0 TOTAL MEAN Max Min 60 6.5 13 1 100 81
The household size determines the available labour force to be employed in carrying out production activities in an average Nigerian farm family. The major source of laboursupply in peasant farming system, which is labour intensive, is family labour. Tables 4.3A&B show that 58% of respondents in Anambra State had a family size of 6 – 10 persons, while 63% of respondents in Enugu State had a family size of 6-10 persons; followed by a household range of 1 – 5 representing 32% and 33% of the total farmers in both States, while 9% of the respondents had a household size of between 11 – 15 persons in Anambra State. Only 1% of the farmers had a family size greater than 15 persons in Anambra State. The mean household size for Anambra and Enugu was 7 persons inferring that family labour could be a ready source of labour on the respondents' farm. Distribution respondents according to household size in Anambra State
4.1.1.3 Household size
Table 4.3A:
of
Table
Educational level Frequency Percentage SePrimarycondary Post secondary Mass literacy No formal education 3827843 10483454 TOTAL 80 100
All the respondents interviewed belonged to cooperative societies. This is a pointer to the fact that there is awareness in the benefits accruable to group formation in the study area. This implies that intended aids/assistance planed for the farmers may not be abused because of the group formation.
4.1.1.5 Educational Status
Most farmers in the study area had one form of education or the other. Result presented in Tables 4.4A&B show that 34% and 36% of the respondents had primary education in Anambra and Enugu States respectively, while 48% and 43% had secondary education in the Anambra and Enugu States. Ten percent (10%) had tertiary education while only 4% had no formal education in Anambra State. These results indicate that education in the study area is of high importance. The high level of literacy in the study area implies that the respondents have the propensity to accept and adopt innovations brought to them by extension agents which will positively affect their productivity and subsequently, income. 4.4A: Distribution of respondents according to educational status Anambra State Table 4.4B:
in
Distribution of respondents according to educational status in Enugu State Educational level Frequency Percentage SePrimarycondary Post secondary Mass literacy No formal education 12262200 4336.67.332000 TOTAL 80 100 82
4.1.1.4 Membership of cooperative/group
4.1.1.6 Gender distribution
The result from the field on gender distribution of ATASP-1 farmers indicated that both male and female were engaged in agriculture in equal proportion in Anambra State as both gender were equally represented (50%). However, in Enugu State, 68% were male while 32% were female. The analysis revealed that females are almost as equally involved in agriculture in the study area. This may be attributed to the fact that women are encouraged to farm in the study area.
Table 4.5A: Distribution of respondents according to gender in Anambra State Gender Frequency Percentage Male Female 40 40 50 50
The system of land ownership among the respondents in the study area is captured in Table 4.6. About 83% and 58% of respondents acquired their land by inheritance in Anambra and Enugu States respectively, while 22% purchased their land for farming in Anambra State. About 53% rented their farm land in Enugu State. The response was a multiple response, implying that a farmer can acquire his/her land through more than one source. 83
TOTAL 80 100 Table 4.5B: Distribution of respondents according to gender in Enugu State Gender Frequency Percentage Male Female 41 19 68.33 31.67
TOTAL 80 100 4.1.1.7 Land tenure system
The major crops cultivated in the Adani-Omor (Anambra-Enugu) zone were Cassava, Rice, Yam and maize. This was determined by the number of farmers involved in the cultivation of these crops and the average farm sizes devoted to their cultivation. In Anambra State, the major crop cultivated was cassava with an average farm size of 1.61ha of farm land cultivated for its production. This is one of the two ATASP-1 crops cultivated in the State. The second being rice with an average farm size of 1.22ha. However, maize and yam had average farm sizes of 1.6 and 1.4 hectares respectively, while an average of 1.22ha of land was used in rice cultivation. This implies that cassava was the predominant crop cultivated among the farmers followed by maize, yam and rice respectively. Also, apart from the ATASP-1 crops, maize and yam had the greater number of respondents cultivating them as 55 and 28% cultivated maize and yam 84
Table 4.6A: Distribution of respondents based on land tenure system in Anambra State Land tenure system Frequency Percentage Inheritance Purchase Rent Borrowed Shared cropping Lease 66 17 17 2 0 6 83 22 22 3 0 8 TOTAL 80 Table 4.6B: Distribution of respondents based on land tenure system in Enugu State Land tenure system Frequency Percentage Inheritance Purchase Rent Borrowed Shared cropping Lease 35 0 32 4 0 8 58.33 0 53.33 6.67 0 13.33
TOTAL 60 4.1.2 Economic Characteristics
Table 4.7: CROP ENTERPRISE FOR ANAMBRA STATE CROP ENTERPRISE CROPS FREQUENCY Percentage Average farm size Average yield (kg) ATASP 1 OTHER CROPS Rice Cassava Maize Yam Vegetable Okra 42 38 22 11 3 3 52.5 47.5 55 27.5 7.5 7.5 1.22 1.61 1.6 1.4 1 0.6 2464 14586 85
respectively. About 52% of ATASP-1 farmers in Anambra State cultivated rice while 48% cultivated cassava. About 88% of the rice farmers cultivated improved varieties of rice seeds. The names of the improved rice varieties cultivated were FARO 44, FARO 57 and FARO 60. The average yield for rice was 2,464kg/ha, while the average yield for cassava was 14,586kg/ha. This information is captured in Table 4.7. The improved variety of cassava cultivated was TSM 414. The local varieties cultivated were Anunka, Sandpaper and Azia. In Enugu State, according to the average farm size cultivated, rice was the major crop with an average farm size of 1.8ha. Yam and cassava were next to rice production with average farm sizes of 1.78 and 1.71 respectively. Other crops cultivated in the State were tomato, cocoyam, melon and okra. Apart from the ATASP-1 crops in the State (rice and cassava), 25% and 13% of respondents cultivated maize and yam respectively, with an average farm size of 1ha for maize cultivation as shown in Table 4.8. Both improved and local varieties of seeds were used in cultivation. One hundred percent (100%) of rice farmers in the State cultivated improved variety of seeds – FARO 44. The farmers got the improved seeds from ATASP-1 and AfricaRice. Also, 100% of cassava farmers in the State cultivated local varieties of seeds. The names of the local varieties of the cassava cultivated were Nwanyijooka, Nwaiwa and Ere akpota igwe. The farmers got the local cassava stems from the local market. The cultivation of local variety seeds for cassava in Enugu State might explain the reason why the yield for cassava is low in the state. The average yield of rice in the state was 2,235kg/ha, while the average yield of cassava was 12,435kg/ha.
Table 4.8: CROP ENTERPRISE FOR ENUGU STATE CROP ENTERPRISE CROPS FREQUENCY Percentage Average farm size Average yield (kg) ATASP 1 OTHER CROPS Rice Cassava Maize Yam Tomato Cocoyam Melon Okra 20 40 15 8 2 3 1 2 33.33 66.67 25 13.33 3.33 5 1.67 3.33 1.8 1.71 1 1.78 2235 12435 4.1.2.1 Processing of major crops Value addition to agricultural produce gives more importance to the produce and fetches the farmer more income. Farmers embarked on Processing of agricultural produce at the study area to add more worth to their produce. As captured in Table 4.9, 68% of farmers in Adani-Omor zone took their produce to the mill for processing while 53% processed at home using family labour. About 13% of the respondents did not process their crops, suggesting that they might have sold them off at farm gate and consume the rest. The high rate of processing among producers (either by self or by milling) suggests that not much of the crops were mopped up by off-takers especially cassava with no formal arrangement because most of the cassava farmers took their commodity to the mill for processing. The response from the farmers is a multiple response. 86
Table 4.9: Processing of major crops in Adani-Omor Zone Processing method Frequency Percentage Family Hired labour Mill Group processing Do not process 73 9 95 1 18 53 7 68 1 13 4.1.2.2 Marketing channels of major crops After produce-harvest from the farm, the respondents employed different avenues to market their commodities. The dominant channel of selling their commodities was through the local market. Table 4.10 shows the various ways in which the major crops in Adani-Omor zone were sold. About 84% of the rice farmers sold their commodities at the local and regional markets while 33% sold off their produce to off-takers without formal arrangement. About 66% of the respondents sold their cassava tubers and stems through the local market while 25% sold off their produce to off-takers without formal arrangement. This implies that farmers go into the planting season without arranging with off-takers to take up their produce at harvest. The reason adduced to this by the farmers is that the off-takers do not respect the arrangement earlier reached at the beginning of the planting season, thus it is better off for them to take their commodities to the market for sale. Figure 1 shows the marketing channels of the major commodities in the zone (Adani-Omor). Table 4.10: Marketing channels of major crops in Adani-Omor zone Rice Cassava Marketing channel Frequency Percentage Marketing channel Frequency Percentage Off takers Regional market Local market 20 21 31 33 34 50 Off takers Regional market Local market 19 41 51 25 53 66 87
4.2.1 Gross margin analysis
Results of the profitability analysis carried out for rice and cassava in the study area are presented in Table 4.11. The results show that the Total Variable Cost (TVC) per hectare for rice production in the study area was N99,096 while the TVC per hectare for cassava production was N153,366. Variable cost comprise of most of the expenditure used in the production of rice/cassava in the study area. Among the variable costs recorded by the rice/cassava producers, labour recorded the highest cost of N52,990 representing 54% of the total cost of rice production per hectare. This was followed by fertilizer cost of N30,426 representing 31% of the total cost of rice production per hectare. Labour cost in cassava production also recorded the highest of N72,500 representing 48% of the total cost of production per hectare. Fertilizer cost was next to the cost of labour with the cost put at N39,866 which represents 26% of the total cost of cassava production per hectare in the study area. 88
Off-takers
Farmers Local market Regional market
4.2 Comparative importance of major crops
The major crops cultivated in Adani-Omor zone were rice and cassava. These were also the primary commodities of ATASP-1 in the zone. It costs an average farmer N99,096 to cultivate an hectare of rice farm and a profit margin of N147,304 was realised with a return to every naira invested put at 1.48. For an average cassava farmer, the total cost of cultivating an hectare of cassava farmland was N153,366 with a profit margin of N218,354 and a return to investment of 1.42. This implies that cassava production in the zone is more profitable compared to rice production but rice production has more value in terms of return to a naira invested.
Fig. 1: Marketing channels of major commodities in Adani Omor zone
Table 4.11A: Profitability of rice production in Anambra/Enugu Variables Value Percentage Variable cost Planting material (Number) NPK Fertilizer (kg) Urea fertilizer (kg) Farm yard manure Insecticides Herbicides Labour land clearing Labour planting Labour weeding Labour fertilizer application Labour harvesting I. Total variable cost Farm income Yield (2464kg/ha) Price/100kg bag (paddy) II. Gross farm income III. Gross margin IV. Return to naira invested 9000 16026 12890 1500 2390 4300 11935 9300 12055 6900 12800 99096 10000 246400 147304 1.48 9.08 16.17 13.00 1.51 2.41 4.34 12.04 9.38 12.16 6.96 12.92 100 89
4.11B: Profitability of cassava production in Anambra/Enugu Variables Value Percentage Variable cost Planting material (Number) NPK Fertilizer (kg) Urea fertilizer (kg) Farm yard manure Insecticides Herbicides Labour ridging Labour planting Labour weeding Labour fertilizer application Labour harvesting I. Total variable cost Farm income Yield (18586kg/ha) Price/100kg bag II. Gross farm income III. Gross margin IV. Return to naira invested 30000 20666 18000 1200 5000 6000 18000 15000 16500 8000 15000 153366 2000 371720 218354 1.42 19.56 13.47 11.73 0.78 3.26 3.91 11.74 9.78 10.76 5.22 9.78 100 90
4.3 Respondents' access to credit The various sources with which respondents access credit for farming purpose are shown in Table 4.12. About 84% of the farmers financed their farming activities through their personal savings, while about 49% got credit for their agricultural activities through family members. About 7% approached the cooperative society for credit and 19% got their credit from money lenders. Agriculture is an enterprise that requires good capital for optimum production. Using personal savings from peasant farmers may limit the production of the farmers and subsequently farmers will have low income. Table 4.12: Respondents’ access to credit Credit source frequency Percentage Family members Personal savings Cooperative society Money lenders 68 117 10 27 48.57 83.57 7.14 19.28 4.4 Respondents' access to extension services Extension services were provided by ATASP-1/IITA/AFRICARICE, State ADP and other projects to farmers. ATASP-1/IITA/AFRICARICE provided the most service as 39% of the respondents saying the services was provided twice a year, while 38% received extension services from them thrice a year. Other projects such as FADAMA also provided extension services to the farmers. The available sources of farm advisory/extension services are shown in Table 4.13 91
Table 4.13: Available sources of farm advisory/extension services Frequency Source of Extension service 1-2 contact/yr % 3-5 contact/yr % >5 contact/yr % ATASP1/IITA/AFRICARICE State ADP Other projects 21 10 4 15 7.14 2.86 55 15 4 39.28 10.71 2.86 53 2 2 37.86 1.43 1.43 4.5 Needs assessment of communities in Adani-Omor The needs of the farmers were classified into production, storage/harvesting, processing and marketing. The needs assessment was done per commodity and per community. A total of nine communities weresampled for their farming needs and the results are presented below. 4.5.1 Needs Assessment of Omogho Community 4.5.1.1 Production needs of Rice farmers in Omogho Community, Orumba North The most pressing production needs of farmers in this community were land, labour and thinsecticides as shown in Table 4.14. Access to credit facility ranked 4 among the needs thof the producers while access to improved seeds ranked 5 . 92
Table 4.14: Production needs of Omogho Community Production needs Frequency Percentage rank Land Credit Fertilizer Improved seeds Extension services Labour sourcing Land preparation Weeding (herbicides) Pest and disease control (insecticides) 10 8 0 6 0 10 0 0 10 100 80 0 60 0 100 0 0 100 1st 4th 5th 1st 1st 4.5.1.2 Harvesting/Storage needs of rice farmers in Omogho Community Threshing and Bagging were the most important harvesting/storage needs of members of the community as shown in Fig 2. 93
4.5.1.3 Processing needs of rice farmers in Omogho Community, Orumba North The most important processing needs of the community were water, access to drying and access to processing machines (Table 4.15) Table 4.15: Processing needs of Omogho community Processing needs Frequency Percentage Rank Water Power Access to Drying Access to processing machines Cost of acquisition Maintenance 10 0 10 10 0 0 100 0 100 100 0 0 1st 1st 1st 94

The main production needs of farmers in this community were land, access to credit facility and labour. These three needs were of equal importance as all the respondents ranked them equally. Pest and disease control and access to improved seeds followed these three needs in ranking respectively. Table 4.16 shows these needs and their ranking. 95
4.5.2 Needs assessment of cassava farmers in Ndiowu community, Orumba North LGA, Anambra State 4.5.2.1 Production needs of Ndiowu Community
.5.1.4 Marketing needs of rice farmers in Omogho Community
The marketing needs of farmers in the community ranged from access to market information to transportation and off-takers for their commodities. Fig. 3 shows that these needs were of equal importance to the farmers.

Table 4.16: Production needs of Ndiowu Community Production needs Frequency Percentage rank Land Credit Fertilizer Improved seeds Extension services Labour sourcing Land preparation Weeding (herbicides) Pest and disease control (insecticides) 10 10 0 3 0 10 0 0 9 100 100 0 30 0 100 0 0 90 1st 1st 5th 1st 4th 4.5.2.2 Harvesting/storage needs of Ndiowu Community Cutting and bagging were the important harvesting/storage needs of farmers in the community. Fig 4 reveals that these two needs of the farmers were of equal importance to them. 96

4.5.2.3: Processing needs of Ndiowu Community
rank Water Power Access to Drying Access to processing machines Cost of acquisition Maintenance 10 0 0 10 0 0 100 0 0 100 0 0 1st 1st 4.5.2.4:
Table 4.17: Processing
Access to processing machines and water were the most important needs of farmers in this community. Table 4.17 shows that these were the only needs of cassava producers in the community. needs of Ndiowu Community needs Percentage Marketing needs of Ndiowu Community
The major marketing needs of respondents in Ndiowu were transportation and access to market information as all the farmers interviewed ranked these as their main needs. Fifty percent (50%) of the respondents cited lack of off-takers for their commodities as their needs after the two major ones as shown in Fig. 5. 97
Processing
Frequency

4.5.3.2: Harvesting of Atani/Aboh Community
needs
and
constituted the major needs of rice farmers in the
4.5.3. Needs assessment of rice producers in Atani/Aboh Community, Ogbaru LAG, Anambra State 4.5.3.1 Production needs of Adani/Aboh Community Land and access to credit were the main production needs of respondents from this community. These two needs ranked equal among their needs followed by fertilizer, labour and land preparation respectively. Table 4.18 shows the needs and the level of importance of these needs. Table 4.18: Production needs of Adani/Aboh Community Production needs Frequency Percentage rank Land Credit Fertilizer Improved seeds Extension services Labour sourcing Land preparation Weeding (herbicides) Pest and disease control (insecticides) 10 10 7 0 0 8 4 0 0 100 100 70 0 0 80 40 0 0 1st 1st 4th 3rd 5th
As expected, threshing bagging community.
This was followed by cutting instruments like sickle. The pictoral representation of these needs is shown in Fig. 6. 98
4.5.3.3 Processing needs of Atani/Aboh Community Access to processing machines, access to clean water and regular power supply were the most important needs of rice farmers in the community. All the respondents interviewed needed good processing machines while 80% indicated interest in clean water and 70% showed interest in regular power supply. Table 4.19 show the various needs of the farmers according to degree of importance. Table 4.19: Processing needs of Atani/Aboh Community Processing needs Frequency Percentage rank Water Power Access to Drying Access to processing machines Cost of acquisition Maintenance 8 7 1 10 0 0 80 70 10 100 0 0 2nd 3rd 4th 1st 99

4.5.4.1
4.5.4 Needs
Respondents in this community indicated their needs to include access to market information, transportation and access to off-takers. The three needs were of equal importance to the respondents as shown in Fig. 7 Assessment of cassava farmers of Ogbakuba Community, Ogbaru LGA, Anambra State Production needs of Ogbakuba Community production needs of cassava farmers in this community ranked as follows: access to land, labour, pest and disease control and access to credit. All the respondents interviewed preferred land and labour as the most important needs as shown in Table 4.20 100
4.5.3.4: Marketing needs of Atani/Aboh Community
The

Table 4.20: Production needs of Ogbakuba Community Production needs Frequency Percentage rank ImFCreLandditertilizerproved seeds Extension services Labour sourcing Land preparation Weeding (herbicides) Pest and disease control (insecticides) 90010000110 900010000101000 1st 4th 1st 3rd 4.5.4.2 Harvesting needs of Ogbakuba Community The important harvesting/storage needs of the respondents in Ogbakuba community were cutting (in form of cassava uprooting machine) and bagging. Fig 8 shows that the farmers' preference for the two needs was equal as all the respondents interviewed indicated these two as the most important needs to them. 101

4.5.4.3 Processing needs of Ogbakuba Community The important needs of farmers in this community were regular power supply and access to processing machines. Access to drying and water were also indicated as reflected in Table 4.21. Table 4.21: Processing needs of Ogbakuba Community Processing needs Frequency Percentage rank Water Power Access to Drying Access to processing machines Cost of acquisition Maintenance 5 10 6 10 0 0 50 100 60 100 0 0 4th 1st 3rd 1st 4.5.4.4 Marketing needs of Ogbakuba Community Access to market information, transportation and off-takers were ranked equal among farmers' needs in the community as shown in Fig. 9. 102

4.5.5 Needs Assessment of rice farmers in Ayamelum Community, Anambra 4.5.5.1.State Production Needs of Ayamelum Community Land availability, improved seeds and land preparation were the major needs of farmers in the community. All the respondents preferred land availability and improved seeds as these two were ranked equal as shown in Table 4.22. Table 4.22: Production Needs of Ayamelum Community Production needs Frequency Percentage rank Land Credit Fertilizer Improved seeds Extension services Labour sourcing Land preparation Weeding (herbicides) Pest and disease control (insecticides) 20 1 1 20 1 1 19 0 17 100 5 5 100 5 5 95 0 85 1st 5th 5th 1st 5th 5th 3rd 4th 4.5.5.2 Harvesting Needs of Ayamelum Community All the respondents in the community indicated cutting, drying and threshing as their most important harvesting/storage needs as these three ranked equal among their needs. Bagging as a need for their commodity was also indicated as shown in Fig. 10. 103
4.5.5.3 Processing Needs of Ayamelum Community Ayamelum is a rice-producing community, thus access to processing machines such as milling machines was ranked high among the farmers' needs for the processing of their commodities. Also ranked equal with the processing machines are access to clean water and regular power supply. The farmers also will prefer a medium for drying their produce. Table 4.23 shows the needs and their degree of importance. Table 4.23: Processing Needs of Ayamelum Community Processing needs Frequency Percentage rank Water Power Access to Drying Access to processing machines Cost of acquisition Maintenance 20 20 19 20 0 0 100 100 95 100 0 0 1st 1st 4th 1st 104

4.3.5.4 Marketing Needs of Ayamelum Community Transportation in terms of access to good roads and availability of off-takers were highly ranked as farmers' marketing needs in the community. Closely followed was the access to market information as shown in Fig. 11. 4.5.6 Needs Assessment of cassava farmers in Orumba South Community, Anambra State 4.5.6.1 Production Needs of Orumba South Community Fertilizer and improved seeds ranked the most among the production needs of cassava farmers in Orumba South community. Table 4.24 reveals that labour sourcing, access to credit and availability of farmland were also among the needs of the respondents in the community. Table 4.24: Production Needs of Orumba South Community Production needs Frequency Percentage Rank ImFCreLandditertilizerproved seeds Extension services Labour sourcing Land preparation Weeding (herbicides) Pest and disease control (insecticides) 0001802020119 0009001010554500 5th 4th 1st 1st 3rd 105

4.5.6.2 Harvesting Needs of Orumba South Community
The main harvesting needs of the community were cutting, in form of uprooting machine and access to well-constructed drying floor for drying their produce. Fig. 12 shows that these needs were desired equally by the farmers. Processing Needs of Orumba South Community
4.5.6.3:
Ranked highest among the processing needs of respondents in Orumba South community was regular supply of power. Some of the farmers complained they have not experienced power supply for a long time in the community. Access to processing machines ranked second while clean water supply and access to drying were ranked third. Table 4.25 reflects the needs of farmers in the community according to the degree of importance. 106

Table 4.25: Processing Needs of Orumba South Community Processing needs Frequency Percentage rank Water Power Access to Drying Access to processing machines Cost of acquisition Maintenance 17 20 17 19 2 2 85 100 85 95 10 10 3rd 1st 3rd 2nd 5th 5th 4.5.6.4 Marketing Needs of Orumba South Community Producers of cassava in Orumba South community highlighted their marketing needs to be access to market information, transportation and off-takers. These needs were ranked equal in importance as shown in Fig. 13. 107

4.5.7 Needs Assessment of rice farmers of Uzo-Uwani Community, Enugu 4.5.7.1State Production Needs of Uzo-Uwani Community Access to credit, fertilizer and machines for land preparation were the main production needs of rice farmers in Uzo-Uwani community. Labour and land were also ranked as vital needs for production in the community as shown in Table 4.26. Table 4.26: Production Needs of Uzo-Uwani Community Production needs Frequency Percentage rank Land Credit Fertilizer Improved seeds Extension services Labour sourcing Land preparation Weeding (herbicides) Pest and disease control (insecticides) 9 20 20 0 0 16 20 0 14 45 100 100 0 0 80 100 0 70 6th 1st 1st 4th 1st 5th 4.5.7.2 Harvesting Needs of Uzo-Uwani Community The major harvesting/storage needs of rice farmers in Uzo-Uwani community were cutting and threshing. These two operations are closely knitted in rice harvesting machines. Fig. 14 shows that other harvesting/storage needs highlighted by the rice farmers were bagging and access to drying. 108
4.5.7.3 Processing Needs for Uzo-Uwani Community The most important processing needs of the rice farmers in this community were modern processing machines and regular power supply. Other needs according to the respondents were clean water supply and access to drying as illustrated in Table 4.27 Table 4.27: Processing Needs of Uzo-Uwani Community Processing needs Frequency Percentage rank Water Power Access to Drying Access to processing machines Cost of acquisition Maintenance 13 19 12 20 0 0 65 95 60 100 0 0 3rd 2nd 4th 1st 109

Transportation in terms of good roads, access to market information and availability of off-takers were the marketing needs highlighted by the respondents. Fig. 15 shows the marketing needs in degree of importance. Needs Assessment of cassava farmers of Isi-Uzo Community, Enugu Production Needs of Isi-Uzo Community
4.5.8.1State
4.5.8
110
The needs of the farmers in producing their commodities in the community included land, improved seeds and fertilizers. Others were access to credit facilities, labour sourcing and insecticides for controlling pests and diseases. Table 4.28 shows these needs in order of importance.
4.5.7.4 Marketing Needs of Uzo-Uwani Community

Regular power supply, access to modern processing machine and access to drying were the most important processing needs of farmers in Isi-Uzo community. Table 4.29 shows the processing needs of the farmers with respect to importance. 111
Table 4.28: Production Needs of Isi Uzo Community Production needs Frequency Percentage rank ImFCreLandditertilizerproved seeds Extension services Labour sourcing Land preparation Weeding (herbicides) Pest and disease control (insecticides) 201301715320 1001508575151005 1st 4th 3rd 2nd 4th 7th 6th
4.5.8.2 Harvesting Needs of Isi-Uzo Community
4.5.8.3 Processing Needs of Isi-Uzo Community
The harvesting needs of the respondents were cutting, bagging and drying. The degree of importance of these needs is shown in Fig. 16.

Table 4.29: Processing Needs of Isi-Uzo Community Processing needs Frequency Percentage rank Water Power Access to Drying Access to processing machines Cost of acquisition Maintenance 10 20 15 16 0 6 50 100 75 80 0 30 4th 1st 3rd 2nd 5th 4.5.8.4 Marketing Needs of Isi-Uzo Community The most important marketing need of the farmers was transportation, closely followed by access to market information and off-takers (Fig. 17) 112

4.5.9 Needs Assessment of cassava farmers in Udenu Community, Enugu 4.5.9.1State Production Needs of Udenu Community Availability of land, credit facility, fertilizer and labour sourcing were ranked equal among the production needs of the cassava farmers in the community. Table 4.30 shows the needs of the farmers. Table 4.30: Production Needs of Udenu Community Production needs Frequency Percentage rank Land Credit Fertilizer Improved seeds Extension services Labour sourcing Land preparation Weeding (herbicides) Pest and disease control (insecticides) 20 20 20 20 15 20 0 0 0 100 100 100 100 75 100 0 0 0 1st 1st 1st 1st 6th 1st 4.5.9.2 Harvesting Needs of Udenu Community The harvesting/storage needs of respondents comprised of cutting in terms of modern harvesting machine, bagging and access to drying (Fig. 18) 113
4.5.9.3 Processing Needs of Udenu Community The major processing needs of respondents in the community were: access to clean water, regular power supply, access to drying and access to modern processing machines. These needs of the farmers were ranked equal as reflected in Table 4.31 Table 4.31: Processing Needs of Udenu Community Processing needs Frequency Percentage rank Water Power Access to Drying Access to processing machines Cost of acquisition Maintenance 20 20 20 20 0 0 100 100 100 100 0 0 1st 1st 1st 1st 114

4.5.9.4 Marketing Needs of Uzo-Uwani Community
The marketing needs of the farmers were: access to market information, transportation and off-takers. The transportation needs mainly focused on good roads. The farmers complained that most of the roads from their farms to the market or processing centres were very bad and wished the roads could be fixed. The farmers need organized form of off-taking their produce. They complained that off-takers do not have a well-organized arrangement for taking up their commodities after harvest. They also complained that off-takers do not keep to the promise they make in mopping up their produce after harvest. They claimed that most of the off-takers fail to show up during harvest after having an agreement with them at the beginning of the planting season.
The marketing needs of farmers in the community were: access to market information, transportation and off-takers. These needs were ranked equally as reflected in Fig. 35
115
Generally, the harvesting/storage needs of the farmers in all the communities included cutting, drying, threshing and bagging. The cutting needs of the farmers included: knife, sickle, uprooting machine for cassava and combine harvester. The drying needs were: well-constructed drying floor and tarpaulin, while the farmers asked for threshing machine as their threshing need. Bagging needs include a uniform bag for transaction.
Farmers complained that the bags used by off-takers/marketers were bigger than theirs thereby preventing them from having the desired profit. Although, the bags appear to be the same, the farmers claimed that the off-takers/marketers' bags were bigger, thus they need a more uniform means of measurement.

SourceRmachines/equipmentegularpowersupplyofgoodmaterials for quality machine/equipment fabrication
The needs of the agro-input dealers include: Loan for expansion of the business Good roads for ease of transporting the inputs Organized market outlet
Reducing the price of fertilizer so that farmers can buy more for their use in the farms.
116
The needs of the fabricators in Adani-Omor Zone are: Soft loan from the government to assist fabricators produce more
Provision of more paddies from farmers: Processors complain of irregular supply of rice paddy by producers. The irregularity was attributed to poor yield from producers
Reducing cost of processing through government intervention in the area through subsidising the cost of processing machines such as threshers and milling machines
4.7 Needs of fabricators in Adani-Omor Zone
4.6 Processing needs of processors in Adani-Omor Zone
Farmers to be empowered so that they can approach the fabricators for the construction of machines/equipment. Safety gears for fabrication process
Agro-processors in the zone were asked their needs and the following needs were adduced:Regular power supply Access to loan Access to clean water
Provision of good roads Regular availability of premium motor spirit (petrol) for ease of transportation
4.9 Needs of agro-input dealers
4.8 Marketing needs of marketers
REPORT OF BIDA-BADEGGI SCPZ 3.0 RESULTS AND DISCUSSION: 3.1 SOCIO-ECONOMIC CHARACTERISTICS OF THE FARMERS This sub-section presents the socioeconomic characteristics of the farmers. The socioeconomic characteristics considered are the farmers' age, level of education, gender, household size, land tenure system. These are presented in Table 1. Variables Frequency Percentage Age 21 30 31 40 41 50 51 60 >60 Total Mean Max Min Education Status No formal education Q’ranic Primary Secondary Tertiary Total Gender Male Female Total Household Size 1 5 6 10 11 15 16 20 >20 Land Tenure System Inheritance Purchase Rent/Leasehold Borrowed Sharecropping 40 52 25 15 8 140 37 76 21 13 17 27 39 44 140 123 17 140 38 49 31 12 10 120 2 19 30 32 28.57 37 34 17.35 10.71 5.71 100 9.28 12.14 19.28 27.85 31.43 100 87.86 12.14 100 27.14 35.01 22.14 8.57 7.14 85.71 1.43 13 57 21.43 22 86 TABLE 1: SOCIO-ECONOMIC CHARACTERISTICS OF FARMERS 117
TABLE 2: CROP ENTERPRISEFOR NIGER STATE
(kgyieAverageld) ATASP
Table 2 shows that rice and sorghum are the major ATASP 1 crops grown. Each of them represents about 43% of total ATASP 1 crops cultivated in Niger state. Cassava is also produced in Niger State, and it represents about 14 percent of total ATASP 1 crops cultivated. As shown on Table 2, average farm size recorded for rice, sorghum and cassava is 1.7, 1.8 and 1.8 hectares respectively. Other crops grown in the state are maize (57.14%), cowpea (24.28%), groundnut (19.28%), millet (7.85%) and soya bean (5.71%). 118
CROPPING ENTERPRISE The results for the distribution of the farmers according to cropping pattern and mean farm size are presented in this sub-section. These are shown in Table 2. Crop Enterprise Crops Frequency Percentage sizAveragee(Ha) 1 OTHER CROPS 1551052550100
Table 1 shows that about two-third (65.91%) of the farmers are not more than 40 years old. Further analysis reveals that the mean age of the respondents is 37 years. This may imply that the majority of the participants of the program are youths. Results of the educational status show that about 80% of the respondents have western education, with majority (59.28%) of them having not less than secondary education. Furthermore, Table 1 also reveals that majority (87.86%) of the respondents are males, and have an average household size of 10 persons. On land tenure system, Table 1 shows that the respondents practiced more than one type of land tenure system. However, majority of them inherited their farmland. Purchase as a form of land tenure system was least practiced among the respondents.
SoMaGrMilleCowCaSorRiceghumssavapeatoundnutizeyabean 880271134206060 5.5719.7241442.42.8686.28.28.8528.1471 1.81.00.10.51.81.81.778
3.1 COMPARATIVE IMPORTANCE OF MAJOR CROPS PROFITABILITY OF RICE PRODUCTION The profitability of rice production is presented in this sub-section. The break down is shown in Table 3. Variables Value(N /ha) Percentage Variable cost Planting material (number) NPK Fertilizer (kg) Urea fertilizer (kg) Farm yard IVIII.IPrice/100kgYieldFI.LabourLabourLabourLabourLabourHerbicidesInsecticidesmanurelandclearingplantingweedingfertilizerapplicationharvestingTotalvariablecostarmincome(2550kg)bag(paddy)I.GrossfarmincomeGrossmargin.Returntocapitalinvested 1.4817494129325011500118309116003467949856579344669049461345619767241679715 1009.802.938.02475.65411.3816.20.428.2171.18.90.78 TABLE 3: PROFITABILITY OF RICE PRODUCTION IN BIDA/BADEGGI 119
Table 3 shows that total output from rice production was 2550kg of paddy rice, and this was sold at N11, 000/100kg. Thus, total revenue from the sale of rice is N 293,250. The total variable cost of production per hectare was N 118,309, hence gross margin was found to be N174, 941. Results for the analysis of rate of return to capital invested reveals that rice production is profitable. The value of 1.48 obtained implies that for every one naira invested in rice production, the framer stands to gain one naira fortyeight kobo.
PROFITABILITY OF SORGHUM PRODUCTION The profitability of sorghum production is presented in this sub-section. The break down is shown in Table 4 TABLE 4: PROFITABILITY OF SORGHUM PRODUCTION IN BIDA/BADEGGI Variables Value (N /ha) Percentage Variable cost Planting material (number) NPK Fertilizer (kg) Urea fertilizer (kg) Farm yard IVIII.II.Price/100kgYieldFI.LabourLabourLabourLabourLabourHerbicidesInsecticidesmanurelandclearingplantingweedingfertilizerapplicationharvestingTotalvariablecostarmincome(1651kg)bagGrossfarmincomeGrossmargin.Returntocapitalinvested 1.049275218161011000888589210210098905013804561002400630014100192006500 10010.362.3611.135.649.056.862.715.8721.607.31.0970 120
The production needs of
5. TABLE 5: PRODUCTION NEEDS FOR TAKUMA COMMUNITY LGA: CommoditState:MokwaNigery:Sorghum Production needs Frequency Percentage Rank ImFCreLandditertilizerproved seeds Extension services Labour sourcing Land preparation Weeding (herbicides) Pest and disease control (insecticides) 979339110 90709030309010100 7th 7th 1st 5th 5th 1st 4th 1st 121
of the value
in
process in
The production needs are presented first. 3.4.1 PRODUCTION NEEDS FOR
This sub-section of the farmers for each of the ATASP 1 crops each chain Niger State. SORGHUM sorghum for Takuma community Table
presents the needs
Table 4 reveals that the total value of output of sorghum was 1651kg, and it was sold at N11, 00/100kg. The variable cost of production per hectare was N88, 858. The gross farm income is N181,610, while gross margin was estimated to be N92, 752. Rate of return to capital invested was N1.04 which also means that sorghum production is a profitable enterprise, and the farmer stands to make N1.04 in every N1.00 invested in sorghum production. 3.1 FARMERS NEEDS FOR THE ATASP 1 CROPS
is presented in
As shown on Table 5 and Figure 1, availability of improved seeds and land preparation stranked 1 among the identified needs in Takuma community. Other needs include herbicides, sourcing of labour, and provision of extension services, credit, fertilizer as well as insecticides. Availability of land is not a problem for the sorghum farmers in Takuma community. This maybe because majority of them own land through Theinheritance.production needs for sorghum in Tunga Kawo community, Wushishi Local Government Area of Niger State is presented in Table 6 and Figure 2. TABLE 6: PRODUCTION NEEDS FOR TUNGA KAWO COMMUNITY Production needs Frequency Percentage Rank ImFCreLandditertilizerproved seeds Extension services Labour sourcing Land preparation Weeding (herbicides) Pest and disease control (insecticides) 08104410530 080104040105030000 7th 4th 1st 5th 5th 1st 3rd 122

st ndLand preparation, access to improved seeds and availability of herbicides ranked 1 , 2 rdand 3 amongst the production needs of the sorghum farmers as seen in Table 6 and Figure 2. Other needs include labour sourcing, access to fertilizer, provision of extension services and credit. The farmers had no need for land and insecticides. TABLE 7: PRODUCTION NEEDS FOR KUTIRIKO COMMUNITY Production needs Frequency Percentage Rank ImFCreLandditertilizerproved seeds Extension services Labour sourcing Land preparation Weeding (herbicides) Pest and disease control (insecticides) 100000990 100000090900 1st 1st 3rd 123

Based on the ranking of needs shown in Table 7 and Figure 3 for sorghum production, Kutiriko community requires majorly; availability of credit, fertilizer and herbicides in that order. The farmers do not require improved seeds, land preparation, pesticides for pest and disease control, sourcing of labour, extension services and land. TABLE 8: PRODUCTION NEEDS FOR SHABALEGBO COMMUNITY Production needs Frequency Percentage Rank ImFCreLandditertilizerproved seeds Extension services Labour sourcing Land preparation Weeding (herbicides) Pest and disease control (insecticides) 10105102600 10105010020600000 3rd 5th 6th 4th 1st 1st 124

The major production needs for sorghum farmers in Shabalegbo community identified from Table 8 and Figure 4 are pesticides and insecticides for pests and disease control; as well as herbicides for weed control. Others include availability of fertilizer, land preparation and access to improved seeds. They do not require labour sourcing, credit, extension services and land to boost sorghum production. The production needs of sorghum for Lanle community, Lavun LGA, Niger State are presented in this following subsection. The details are as shown in Table 9 and Figure 5. TABLE 9: PRODUCTION NEEDS FOR LANLE COMMUNITY Production needs Frequency Percentage Rank ImFCreLandditertilizerproved seeds Extension services Labour sourcing Land preparation Weeding (herbicides) Pest and disease control (insecticides) 205209653 2005020090605030 5th 3rd 2nd 1st 6th 3rd 6th 125

Major among the needs identified for the production of sorghum in Lanle community as seen in Table 9 and Figure 5 include: availability of improved seeds, fertilizer, credit and land preparation, in that order. This is followed by access to land for sorghum production, labour sourcing and availability of insecticides. The farmers have no need for extension services and herbicides. PRODUCTION NEEDS FOR RICE Based on the community cluster in Niger State, rice is mostly produced in Ndaluka, Loguma, Badeggi and Ebbo communities. Production needs for rice production are discussed in the following sections. With respect to the production needs for rice production Table 10 and Figure 6 presents the production needs for rice in Badeggi Community, Katcha LGA of Niger State. TABLE 10: PRODUCTION NEEDS FOR BADEGGI COMMUNITY Production needs Frequency Percentage Rank IFCrLandeditertilizermproved seeds Extension services Labour sourcing Land preparation Weeding (herbicides) Pest and disease control (insecticides) 80101510100 80010010501010000 1st 1st 4th 5th 5th 3rd 126

As shown in Table 10, Badeggi community requires credit, fertilizer, pest and diseases control (insecticides), improved seeds, extension services and land preparation based on the order of priority of their production need for rice. However, they did not identify the need land, land labour sourcing and weeding using herbicides. The results for the production needs of sorghum identified for Mantuntu community, Katcha LGA, Niger State are presented next. These are shown in Table 11 and Figure 7. TABLE 11: PRODUCTION NEEDS FOR MANTUNTU COMMUNITY Production needs Frequency Percentage Rank ImFCreLandditertilizerproved seeds Extension services Labour sourcing Land preparation Weeding (herbicides) Pest and disease control (insecticides) 1002021010100 1002002101010000000 1st 1st 1st 5th 6th 1st 127

As seen in Table 11 and Figure 7, the major production needs identified for Mantuntu community in order to boost sorghum production include: improved seeds, access to pest and disease control techniques (insecticides), credit and fertilizer. This was followed by land preparation and access to extension services. The farmers in the community do not however, require herbicides, labour and land. The next subsection presents details on rice value chain in Lapai LGA, Niger State. Details of the needs for rice production in Ebbo, Lapai LGA, Niger State are as presented in Table 12 and Figure 8. TABLE 12: PRODUCTION NEEDS FOR EBBO COMMUNITY Production needs Frequency Percentage Rank Land Credit Fertilizer Improved seeds Extension services Labour sourcing Land preparation Weeding (herbicides) Pest and disease control (insecticides) 5 10 9 10 9 0 3 3 7 50 100 90 100 90 0 30 30 70 6th 1st 3rd 1st 3rd 7th 7th 5th 128

Table 12 and Figure 8 show that Ebbo community needs credit, improved needs, fertilizer, extension services, pest and diseases control (insecticides), land, land preparation and weeding (herbicides) as needs for rice. However, they do not require labour sourcing as indicated by the farmers in production needs of rice. In Ndaluka Community, Lavaun LGA, Niger State, details of the production needs for rice are as presented in Table 13 and Figure 9. TABLE 13: PRODUCTION NEEDS FOR NDALUKA COMMUNITY Production needs Frequency Percentage Rank Land Credit Fertilizer Improved seeds Extension services Labour sourcing Land preparation Weeding (herbicides) Pest and disease control (insecticides) 1 10 9 7 4 8 0 0 0 10 100 90 70 40 80 0 0 0 6th 1st 2nd 4th 5th 3rd 129

Table 13 and Figure 9 show that Ndaluka community require credit, fertilizer, labour sourcing, improved seeds and extension services presented in the order of the priority of production needs for rice. The community does not require land preparation, weeding (herbicides) and pest and disease control (insecticides). The production needs for Loguma community is presented in Table 14 and Figure 10. TABLE 14: PRODUCTION NEEDS FOR LOGUMA COMMUNITY Production needs Frequency Percentage Rank Land Credit Fertilizer Improved seeds Extension services Labour sourcing Land preparation Weeding (herbicides) Pest and disease control (insecticides) 0 10 9 2 0 0 0 0 1 0 100 90 20 0 0 0 0 10 1st 2nd 3rd 4th 130

Details
Table 14 and Figure 10 show that Loguma community has highest needs for credit and fertilizer. Other items needed for rice production in the community are improved seeds and pest and disease control (insecticides). The community however did not show any priority for extension services, labour sourcing, land preparation weeding (herbicides) and land as farmers might not be facing serious challenges in those aspects. NEEDS FOR CASSAVA
This sub-section presents the discussion on the needs of the cassava value chain. Based on the community cluster, cassava is majorly produced in the two communities of Muwo and Sabon – Orehi communities of in Mokwa Local Government Area of Niger State. of the production needs for cassava in Muwo community are as presented in Table 15 and Figure 11. MUWO COMMUNITY
TABLE 15: PRODUCTION NEEDS FOR
PRODUCTION
Production needs Frequency Percentage Rank Land Credit Fertilizer Improved seeds Extension services Labour sourcing Land preparation Weeding (herbicides) Pest and disease control (insecticides) 1 5 3 3 5 6 10 9 1 10 50 30 30 50 60 100 90 10 8th 4th 6th 6th 4th 3rd 1st 2nd 8th 131

As shown in Table 15 and Figure 11, production needs for cassava in Muwo community presented in order of priority are land preparation, weeding (herbicides), labour sourcing, extension services, credit, fertilizer, improved seed, land as well as pest and diseases (insecticides) respectively. In Sabon-Orehi community of Lapai Local Government Area of Niger State, details on the production needs of cassava farmers are as presented in Table 16 and Figure 12. TABLE 16: PRODUCTION NEEDS FOR SABON-OREHI COMMUNITY Production needs Frequency Percentage Rank Land Credit Fertilizer Improved seeds Extension services Labour sourcing Land preparation Weeding (herbicides) Pest and disease control (insecticides) 1 10 9 10 10 0 4 0 1 10 100 90 100 100 0 40 0 10 6th 1st 4th 1st 1st 5th 6th 132

As shown in Table 16 and Figure 12, major items required for cassava production in Sabon-Orehi community were credit, improved seeds, extension services, land preparation, pest and diseases control (insecticides) as well as more land for production activities. These are presented in the order of priority. 3.4.2 HARVESTING NEEDS FOR SORGHUM The next subsection looks at the harvesting needs of Sorghum for the different communities. The details of the harvesting needs of the farmers in Bida/Badeggi community are as presented in Table 17 and Figure 13. TABLE 17: HARVESTING/STORAGE NEEDS FOR TAKUMA COMMUNITY LGA: Mokwa State: Niger Harvesting needs Frequency Percentage Rank Cutting Drying Threshing Bagging 10 4 10 9 100 40 100 90 1st 4th 1st 3rd 133

The need for the equipment for cutting ranked first among identified needs for harvesting and storage in Takuma community. Other needs include equipment for threshing, bagging and drying in that order. The harvesting needs of sorghum for Tungan Kawo community is presented in Table 18 and Figure 14. TABLE 18: HARVESTING NEEDS FOR TUNGAN-KAWO COMMUNITY LGA: Wushishi State: Niger Harvesting needs Frequency Percentage Rank Cutting Drying Threshing Bagging 10 10 10 3 100 100 100 30 1st 1st 1st 200

stAccess to cutting, drying and threshing equipment ranked 1 amongst the harvesting and storage needs identified for Tungan Kawo Community for sorghum as seen in Table 18 and Figure 14. This was followed by access to bagging materials and equipment. The harvesting needs for Kutiriko community is presented in Table 19 and Figure 15. TABLE 19: HARVESTING NEEDS FOR KUTIRIKO COMMUNITY Harvesting needs Frequency Percentage Rank Cutting Drying Threshing Bagging 7 0 8 0 70 0 80 0 2th 1st 135

As seen on Table 19 and Figure 15, Farmers in Kutiriko community require cutting and threshing equipment for sorghum. They have no need for drying and bagging Theequipment.harvesting needs of sorghum for Shabalegbo community are presented next. These are shown in Table 20 and Figure 16. TABLE 20: HARVESTING NEEDS FOR SHABALEGBO COMMUNITY Harvesting needs Frequency Percentage Rank Cutting Drying Threshing Bagging 10 8 10 10 100 80 100 100 1st 4th 1st 1st 136

Table 20 and Figure 16 show that access to cutting, bagging and threshing equipment stranked 1 among the identified needs for sorghum harvesting and storage in Shabalegbo community. This was followed by the need for drying machines. The harvesting needs of sorghum for Lanle community are presented next. These are shown in Table 21 and Figure 17. TABLE 21: HARVESTING NEEDS FOR LANLE COMMUNITY Harvesting needs Frequency Percentage Rank Cutting Drying Threshing Bagging 10 10 10 2 100 100 100 20 1st 1st 1st 4th 137

Table 21 and Figure 17 reveal that cutting, drying and threshing equipment were majorly needed by sorghum farmers in Lanle community.The results of harvesting needs of sorghum identified for Mantuntu community are presented next. These are shown in Table 22 and Figure 18. TABLE 22: HARVESTING NEEDS FOR MANTUNTU COMMUNITY Harvesting needs Frequency Percentage Rank Cutting Drying Threshing Bagging 0 0 10 10 0 0 100 100 1st 1st 138

Mantuntu community needs threshing and bagging based on the ranking of their harvesting/storage needs. They do not need cutting and drying equipment. HARVESTING NEEDS FOR RICE The following sub-section presents the results and discussion for the harvesting needs for rice. That of Badeggi community is presented first.Table 23 presents the harvesting needs for rice in Badeggi Community. TABLE 23: HARVESTING NEEDS FOR BADEGGI COMMUNITY Harvesting needs Frequency Percentage Rank Cutting Drying Threshing Bagging 0 6 9 10 0 60 90 100 3rd 2nd 1st 139

As shown in Table 23 and Figure 19, Badeggi community needs bagging, threshing and drying as ranked by the farmer in harvesting/storage needs for rice. The harvesting needs for Ebbo community is presented next. This is shown in Table 24. TABLE 24: HARVESTING NEEDS FOR EBBO COMMUNITY Harvesting needs Frequency Percentage Rank BaggingThreshingDryingCutting 9101010 90100100100 1st 1st 1st 4th 140


Harvesting needs for rice in Ndaluka community are as presented in Table 25 and Figure 21. NDALUKA
Details of the harvesting needs of Loguma community for rice is as presented in Table 26.
Table 25 and Figure 21 show that Ndaluka community needs cutting, cutting, threshing and bagging. The order of ranking of the harvesting/storage needs for rice shows that except for bagging, all the items identified equally have highest level of priority.
TABLE 25: HARVESTING NEEDS FOR
A shown in Table 24 and Figure 20, Ebbo community requires cutting, drying, threshing and bagging based on ranking of harvesting/storage need for rice. The items have very high level of priority attached to them as a minimum of 90% of the entire community indicating the need for the items.
Figure 21: Harvesting / Storage Needs of Ndaluka Community
COMMUNITY Harvesting needs Frequency Percentage Rank Cutting Drying Threshing Bagging 10 10 10 8 100 100 100 80 1st 1st 1st 4th
141

As shown in Table 26 and Figure 22, majority of the farmers in Loguma require supports for cutting and threshing. However it could be noted that the farmers also expressed the need for assistance on drying in the aspect of harvesting/storage of rice. HARVESTING NEEDS FOR CASSAVA In terms of harvesting, details of the needs of Muwo community for cassava are as presented in Table 27 and Figure 23. TABLE 27: HARVESTING NEEDS FOR MUWO COMMUNITY Harvesting needs Frequency Percentage Rank Cutting Drying Threshing Bagging 10 10 2 5 100 100 20 50 1st 1st 4th 3rd TABLE 26: HARVESTING NEEDS FOR LOGUMA COMMUNITY Harvesting needs Frequency Percentage Rank Cutting Drying Threshing Bagging 7 3 7 0 70 30 70 0 1st 3rd 1st 142

As shown in Table 27 and Figure 23, Muwo community have needs in the aspect of cutting and drying for which all the famers identified themselves with. Also, the farmers identified bagging and threshing as areas where they require supports on harvesting/storage needs of cassava. The harvesting needs for Sabon-Orehi community is presented next. This is shown in Table 28. TABLE 28: HARVESTING NEEDS FOR SABON-OREHI COMMUNITY Harvesting needs Frequency Percentage Rank Cutting Drying Threshing Bagging 9 10 5 8 90 100 50 80 2nd 1st 4th 3rd 143

As shown in Table 28 and Figure 24, Sabon – Orehi community needs drying, cutting, bagging and threshing equipment for efficient harvesting/storage operations. PROCESSING NEEDS OF 3.4.3 PROCESSING NEEDS OF FARMERS The processing needs of farmers in Takuma community are discussed in this subsection. The results are shown in Table 29 and Figure 25. TABLE 29: PROCESSING NEEDS FOR TAKUMA COMMUNITY LGA: State:MokwaNiger Processing needs Frequency Percentage Rank Water Power Access to Drying Access to processing machines Cost of acquisition Maintenance 5 5 3 9 6 7 50 50 30 90 60 70 4th 4th 6th 1st 3rd 2nd 144

The major processing needs identified for Takuma community includes access to processing machine, maintenance of the machines and huge cost of acquisition of the needed machines. Others include availability of water and power, as well as access to drying equipment. The processing needs for Tungan-Kawo community is shown in Table 30. TABLE 30: PROCESSING NEEDS FOR TUNGAN-KAWO COMMUNITY Processing needs Frequency Percentage Rank AccePWaterowerss to Drying Access to processing MaCosmachinestofacquisitionintenance 389836 308090803060 4th 5th 2nd 1st 2nd 6th 145

As seen in Table 30 and Figure 26, Tungan Kawo requires access to processing machines, reduced cost for the acquisition of some of the machines, access to drying equipment, availability of water and power, as well as maintenance. The processing needs of sorghum for Kutiriko community are presented next. These are shown in Table 31 and Figure 27. TABLE 31: PROCESSING NEEDS FOR KUTIRIKO COMMUNITY Processing needs Frequency Percentage Rank AccessPWaterower to Drying Access to processing MainCostmachinesofacquisitiontenance 0010010 001000100 2nd 1st 146

As seen in Table 31 and Figure 27, only two needs were identified by the processors of sorghum in Kutiriko community. These were access to processing machines and power. st ndThey ranked 1 and 2 respectively. The processing needs for sorghum processors for Shabalegbo community are presented next. These are shown in Table 32 and Figure 28. TABLE 32: PROCESSING NEEDS FOR SHABALEGBO COMMUNITY Processing needs Frequency Percentage Rank AccessPWaterower to Drying Access to processing machines Cost of Maintenanceacquisition 1095092 100905009020 5th 2nd 4th 2nd 1st 147

Shabalegbo community needs maintenance of processing machines, reduced or subsidized cost of acquisition of processing equipment, access to power in order to operate their processing machine, and availability of water for processing operations. They have no need for drying equipment. The results for the processing needs of sorghum for Lanle community are presented next. These are shown in Table 33 and Figure 29. TABLE 33: PROCESSING NEEDS FOR LANLE COMMUNITY Processing needs Frequency Percentage Rank AccessPWaterower to Drying Access to processing machines Cost of Maintenanceacquisition 00010109 00010010090 3rd 1st 1st 148

Table33 and Figure 29 show that processors of sorghum in Lanle community need access to water, power and drying facilities for efficient processing operations. However, they do not require access to processing machines; they have no challenges with the cost of acquisition of equipment and materials, as well as with maintenance. The processing needs for Mantuntu community is shown in Table 34. TABLE 34: PROCESSING NEEDS FOR MANTUNTU COMMUNITY Processing needs Frequency Percentage Rank Water Power Access to Drying Access to processing machines Cost of acquisition Maintenance 10 10 0 10 0 6 100 100 0 100 0 60 1st 1st 0 1st 0 4th 149

As shown in Table 34 and Figure 30, Mantuntu community considers water, power, and access to processing machine as the most important processing needs. These were followed by maintenance in the order of the processing need for sorghum. The processing needs for Badeggi community is presented in Table 35. TABLE 35: PROCESSING NEEDS FOR BADEGGI COMMUNITY Processing needs Frequency Percentage Rank Water Power Access to Drying Access to processing machines Cost of acquisition Maintenance 10 10 3 9 0 4 100 10 30 90 0 40 1st 5th 4th 2nd 3rd 150
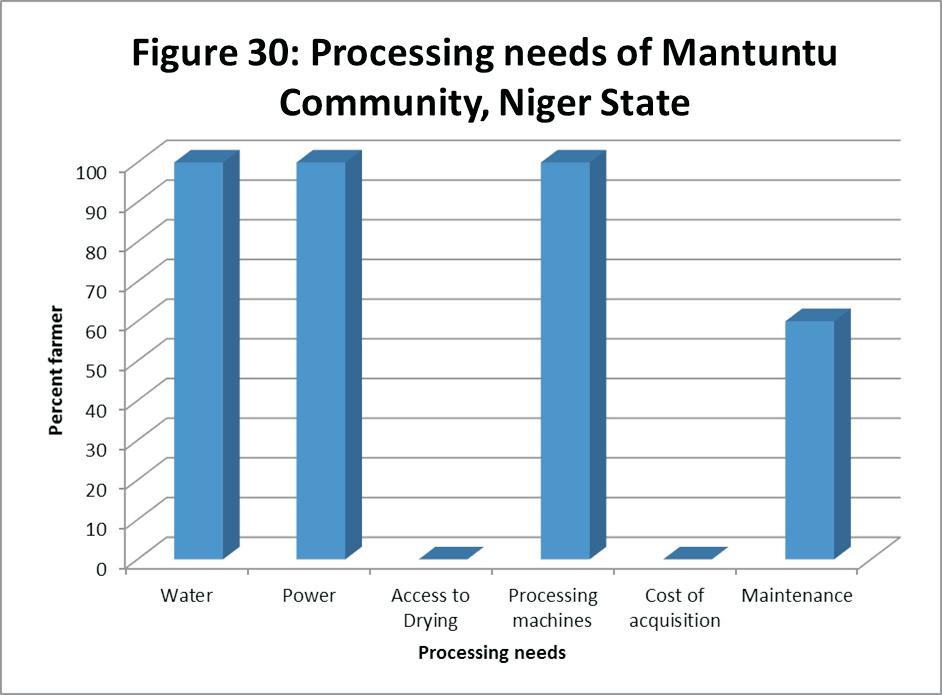
Table 35 and Figure 31 shows the processing needs in Baddagi community. In order of importance, it was revealed that water, access to processing machine, maintenance, access to drying and power were the most prioritized needs of the community. The processing needs for Ndaluka community is discussed next. The results are presented in Table 36. TABLE 36: PROCESSING NEEDS FOR NDALUKA COMMUNITY Processing needs Frequency Percentage Rank Water Power Access to Drying Access to processing machines Cost of acquisition Maintenance 10 6 7 1 0 5 100 60 70 10 0 50 1st 3rd 2nd 5th 4th 151

Table 36 and Figure 32 show that Ndaluka community; require water, access to drying, power, maintenance, and access to processing machine presented in the order of priority by to the farmers in the community. The processing needs for Muwo community is shown in Table 37. TABLE 37: PROCESSING NEEDS FOR MUWO COMMUNITY Processing needs Frequency Percentage Rank Water Power Access to Drying Access to processing machines Cost of acquisition Maintenance 7 8 7 8 3 6 70 80 70 80 30 60 3rd 1st 3rd 1st 6th 5th 152

As shown in Table 37 and Figure 33, Muwo community require power, access to processing machine, water access to drying and maintenance for processing of cassava. It could be seen that access to power as well as processing machine ranked highest. These were followed by access to water and drying facilities ranked next with the need for support on cost of acquisition being ranked lowest in the order of needs for processing. The processing needs for Sabon-Orehi community is presented in Table 38. TABLE 38: PROCESSING NEEDS FOR SABON-OREHI COMMUNITY Processing needs Frequency Percentage Rank Water Power Access to Drying Access to processing machines Cost of acquisition Maintenance 8 10 10 10 0 5 80 100 100 100 0 50 4th 1st 1st 1st 5th 153

Table 38 and Figure 34 shows that access to power, processing machines, drying facilities, and water are the major needs of the cassava processors in Sabon – Orehi community. The entire processors interview identified these needs. Also needed, is the maintenance of the processing equipment. The processing needs of Bida/Badeggi community is presented in Table 39. Table 39: Major processing needs of processors in Bida/Baddeggi ATASP-1 Zone Processing needs Frequen cy Percenta ge Rank Transportation 10 100 1st Access to credit 10 100 1st Access to processing machine 10 100 1st Power 10 100 1st Water 5 50 5th The major needs identified for processing of crops in Bida – Badeggi ATASP – 1 zone include: transportation, access to credit, access to processing machines, power and water. Processors require all this needs to process crops in the zone 154

3.4.4 MARKETING AND TRANSPORTATION NEEDS OF FARMERS IN EACH SCPZ The results of the marketing and transportation needs of the farmers in each SCPZ is presented and discussed in this sub-section. The marketing needs for Takuma community is presented in Table 40. TABLE 40: MARKETING NEEDS FOR TAKUMA COMMUNITY LGA: State:MokwaNiger Marketing needs Frequency Percentage Rank Access to market information Transportation Off takers 6 3 7 60 30 70 2nd 3rd 1st Table 40 and Figure 35 reveals that Takuma community requires off – takers, access to information and transportation in that order of priority for effective marketing of Thesorghum.marketing needs of sorghum for Tungan Kawo community, Wushishi LGA, Niger State are presented next. These are shown in Table 41 and Figure 36. 155

TABLE 41: MARKETING NEEDS FOR TUNGAN-KAWO COMMUNITY Marketing needs Frequency Percentage Rank Access to market information Transportation Off-takers 9 2 8 90 20 80 1st 3rd 2nd stAccess to market information ranked 1 among the marketing needs identified for Tungan Kawo as revealed in Table 41 and Figure 36. Off – takers and transportation nd rdranked 2 and 3 . The marketing needs of sorghum for Kutiriko community are presented next. These are shown in Table 42 and Figure 37. TABLE 42: MARKETING NEEDS FOR KUTIRIKO COMMUNITY Marketing needs Frequency Percentage Rank Access to market OfTinformationransportationftakers 861 806010 3rd 2nd 1st 156

Kutiriko community, as seen in Table 42 and Figure 37, requires off – takers, transportation and access to market information in that order for efficient and effective marketing of sorghum. The marketing needs of sorghum for Shabalegbo community are presented next. These are shown in Table 43 and Figure 38. TABLE 43: MARKETING NEEDS FOR SHABALEGBO COMMUNITY Marketing needs Frequency Percentage Rank Access to market information Transportation Off takers 3 8 5 30 80 50 3rd 1st 2nd 157


As shown in Table 43 and Figure 38, marketers of sorghum in Shaba-legbo community needs transportation, off – takers and access to market information in order to carry out their marketing functions effectively. The results for the marketing needs of sorghum for Lanle community are presented next. These are shown in Table 44 and Figure 39. TABLE 44: MARKETING NEEDS FOR LANLE COMMUNITY Marketing needs Frequency Percentage Rank Access to market information Transportation Off takers 10 10 10 100 100 100 1st 1st 1st Lanle community requires access to market information, transportation and off – takers. stAll the needs identified ranked 1 as seen in Table 44 and Figure 39. This may mean that the marketers do not have any means of marketing sorghum in Lanle community. The marketing needs for Mantuntu community are presented in Table 45 and Figure 40. TABLE 45: MARKETING NEEDS FOR MANTUNTU COMMUNITY Marketing needs Frequency Percentage Rank Access to market information Transportation Off-takers 8 8 9 80 80 90 2nd 2nd 1st 158

Table 45 and Figure 40 shows that Mantuntu needs off-takers, transportation and access to market information for marketing of sorghum. It could however be observed that offtakers was considered the important followed by the access to market information and transportation with level of priority attached. In terms of marketing, the needs for rice in Badeggi Community, Katcha LGA of Niger State are as presented in Table 46. TABLE 46: MARKETING NEEDS FOR BADEGGI COMMUNITY Marketing needs Frequency Percentage Rank Access to market information Transportation Off-takers 7 8 9 70 80 90 3rd 2nd 1st 159

Table 46 and Figure 41 show that Baddegi community needs, off – takers, transportation and access to market information as ranked by the farmers as their marketing needs. The marketing needs for Ebbo community is presented in Table 47 and Figure 42. TABLE 47: MARKETING NEEDS FOR EBBO COMMUNITY Marketing needs Frequency Percentage Rank Access to market information Transportation Off-takers 9 10 10 90 100 100 3rd 1st 1st 160


are
items as
161
needs for
marketing in
Table 48 and Figure 43 show that Ndaluka community This is based on the fact that all the respondents identified the major rice the community. In Loguma community, the production for rice as presented in Table 49 and Figure 44.
needs
needs access to market information, transportation and off – takers.
As shown in Table 47 and Figure 42, Ebbo community requires, off-takers, transportation and access to market information as based on ranking of marketing needs for rice farmers. Almost all the respondents in the community indicated the need for the items as enumerated. Details on the marketing needs of Ndaluka community for rice are as presented in Table 48 and Figure 43. TABLE 48: MARKETING NEEDS FOR NDALUKA COMMUNITY Marketing needs Frequency Percentage Rank Access to market information Transportation Off takers 10 10 10 100 100 100 1st 1st 1st

TABLE 49: MARKETING NEEDS FOR LOGUMA COMMUNITY Marketing needs Frequency Percentage Rank Access to market information Transportation Off takers 2 6 5 20 60 50 3rd 1st 2nd Table 49 and Figure 44 show that Loguma community require, transportation, off –takers and access to market information in order of priority respectively for their marketing needs. On marketing of cassava, Table 50 and Figure 45 present the needs in Muwo community. TABLE 50: MARKETING NEEDS FOR MUWO COMMUNITY Marketing needs Frequency Percentage Rank Access to market information Transportation Off takers 9 6 8 90 60 80 1st 3rd 2nd 162

Table 50 and Figure 45 show that Muwo community have high need for access to market information, off – takers and transportation in cassava marketing. This is based on the fact that a minimum of 60% of the farmers in the community have need for the items in cassava marketing. The marketing needs for Sabon-Orehi community are shown in Table 51 and Figure 46. TABLE 51 : MARKETING NEEDS FOR SABON-OREHI COMMUNITY Marketing needs Frequency Percentage Rank Access to market information Transportation Off-takers 9 10 10 90 100 100 3rd 1st 1st 163


Figure 46: Marketing Needs of Sabon-Orehi Community The marketing needs identified for cassava marketers in Sabon-Orehi community are as presented in Table 52 and Figure 46. It was revealed that all the marketers interviewed indicated the need for transportation and off – takers, while 90 percent indicated the need for access to market information. The marketing and transportation needs of marketers in Bida/Badeggi is presented in Table 53. Table 53: marketing and transportation needs of marketers in zone Marketers needs Frequency Percentage Rank Access to credit 10 100 1st Transportation 9 90 3rd Awareness 9 90 3rd Access to farm implements 10 100 1st Access to processing 4 40 5th The major needs identified for marketing of crops in the Zone by off – takers are access to credit, access to farm implements, awareness, transportation and access to processing machine. Off – takers require all of the above mentioned needs for effective marketing of crops in the zone. 3.4 NEEDS OF FABRICATORS IN BIDA/BADEGGI ZONE The major needs of fabricators in the zone is presented and discussed in this subsection. Table 54: major needs of Fabricators in Bida/Badeggi zone Fabricators needs Frequen cy Percenta ge Rank Access to credit 10 100 1st Access to modern equipment (e.g turning machine) 9 90 3rd Power 10 100 1st Market linkage 9 90 3rd Training 5 50 5th 164
As seen in Table 54, the major needs of fabricators in the zone include: access to credit, power, access to modern equipment market linkage and training. Fabricators in the zone require this for efficient fabricating operations 3.4 NEEDS OF AGRO – INPUT DEALERS BIDA/BADEGGI ZONE The major needs of the Agro-input dealers in Bida/Badeggi zone is also presented and discussed in this sub-section. These are shown in Table 55. Table 55: Major needs of agro-input dealers in Bida/Badeggi Zone Agro – input dealers needs Frequen cy Percenta ge Rank Access to credit 10 100 1st Training needs 10 100 1st Access to market information 9 90 3rd Availability of input 8 80 4th Transportation 8 80 4th Access to storage 5 50 6th The major needs of agro-input dealers as shown in Table 55 are access to credit, training needs, access to market information, transportation, availability of input and access to storage facilities. Agro-input dealers need all of these in the zone. 165
1 Variable Kebbi Sokoto AGE (years) Frequency Percentage Frequency Percentage <21 years 2 1.67 0 22-30 3 2.5 1 5 31 40 27 22.5 6 30 41 50 41 34.17 6 30 51 60 34 28.33 6 30 >60 13 10.83 1 5 Total 120 20 Mean 48 46.05 Maximum 72 61 Minimum 20 25 Educational Status: Koranic 37 30 83 3 15 Primary 16 13.33 8 40 Secondary 21 17.5 3 15 Post secondary 36 30 4 20 Mass literacy sch 1 0.83 2 10 No formal education 9 7.5 0 0 Total 120 30.83 2 15 166
The social characteristics of the farmer clusters and farmer cooperatives are done by examining the age distribution, educational status, gender and family size. Age - In Kebbi State, the age range of members is 20-72 years with a mean age of 48 years, whereas in Sokoto State, the age range is 25-61years with a mean of 46.05 years. Thus, the group members on the average are still fairly young and therefore strong for farming activities. From the age distribution of farmers in both States, it appears that there were more younger farmers (20 years old) into agriculture in Kebbi State than in Sokoto State (25 years old). However, on the average there are relatively younger farmers in Sokoto with mean age of 46 years than Kebbi State with a mean of 48 years (Table 2).
Table 2: Age distribution of farmers in Kebbi and Sokoto States of ATASP
REPORT OF KEBBI-SOKOTO SCPZ 3.0 RESULTS AND DISCUSSION 3.1 Social Characteristics of Respondents
Gender: Male 113 94.17 20 100 Female 7 5.83 0 0 Total 120 20 Household size 1 5 24 20 1 5 6 -10 36 30 6 30 11 15 29 24.17 7 35 16 20 16 13.33 3 15 >20 15 12.5 3 15 Total 120 100 20 100 Mean 48 14.15 Max 72 31 Min 20 2
Almost all the farmers (139 out of 140 respondents or 99%) belonged to cooperative societies/farmer groups which is a good indication that the farmers are organized for commercial agricultural production in the zone.
Educational Status - Among Kebbi State respondents, majority (31%) attended Koranic School, followed by people with post-secondary school education without about 7.5% having no education at all. (Table 2). For Sokoto State, primary education was highest (40%) and there was nobody without one form of education or the other, suggesting that Sokoto have more educated participants.
Membership of cooperative/group
3.2. Economic Characteristics Land Tenure System- Farm size distribution is a major means of ascertaining the wealth of farmers. Farm size is influenced by the land tenure system. In Kebbi State, farm land 167
Gender- In terms of gender participation, 94% were males while 6% were females but in Sokoto State, all the respondents were males suggesting that gender participation in the programme is low. Household Size – Household size distribution, show that Kebbi households have on average, 48 members, with a range of 20-72 members, whereas, in Sokoto, State, the mean was 14 members while the range is 2-31. The respondents all have large family size because they are helpful in providing family labour to production activities.
number
land
production was
4).
that will encourage
168
acquisition is majorly by inheritance (93%), followed by purchase (40%), borrowed (23%) and rent (18%). There is also less practiced methods of acquisition by share cropping practice (3%) and leasing (1%). In Sokoto State similar trend of acquisition was observed though in this case, land purchase dominated the market (95%) and followed closely by inheritance (90%). Other less important methods were land rent and share cropping (10% each) and borrowing (1%). Thus, there is more market for in Sokoto than in Kebbi commercialization farms since land, the farmer can to his capacity (Table3). land tenure system Also, the and type by a farmer In Kebbi State, the average farmer cultivates about ten crops and the total land area devoted crop 15.82ha (Table In Sokoto State, an average farmer cultivates six crops with a total farm size of 6.05ha, which suggest that available cultivated farm land in Sokoto was much lower than in Kebbi State (Table 4). Thus, there is more room in Kebbi than in Sokoto State.
for commercialization of agriculture
of crops grown
is a major determinant of land available for cultivation by farmers in any area.
Table 3: Distribution of farmers based on the land tenure System Tenure system Kebbi Sokoto Frequency* Percentage Frequency Percentage Inheritance 111 92.3 18 90 Purchase 48 40 19 95 Rent 22 18.33 2 10 Borrow 28 23.33 1 5 Share cropping 4 3.33 2 100 Lease 1 0.83 0 0 *Multiple responses were allowed. Farm size- As mentioned above, the
invest
of
are dependent on the available land.
on purchased
Table 4: Distribution of farmers according to crop grown, mean farm size and yield for ATASP 1 crops. Crop Kebbi Sokoto Freq % (hasizfAve.arme) Freq % Ave. farm size (ha) 1ATASPcrop: Rice 81 67.5 2.82 10 50 1.75 Sorghum 39 32.5 2.98 10 50 1 crOtherops Maize 40 33.33 1.32 Cowpea 26 21.67 1.6 6 30 1.0 Millet 55 45.83 1.7 20 100 0.8 Groundnut 13 10.83 1.4 Soybean 2 1.67 1 wheat 11 9.17 1 meWaterlon 1 0.83 1.5 Onions 1 0.83 0.5 8 40 1.1 Tomato - - - 2 10 0.4 (HaarTotalea) 15.82 6.05 (Kg1AyieMeanldofTAPS-crop/ha) Rice 3,979 2,670 Sorghum 1,876 764 3.3. Current farm practices of farmers 3.3.1. Production of crops Within the Kebbi-Sokoto CPZ, many crop production activities are carried out. As shown in Table 4, the crop ranges from cereals (Rice, Sorghum, Millet, Maize and wheat) to legumes (Groundnut, cowpea and soybean) to vegetable crops (Water melon, Onions and Tomato). Crop production activities are carried out in the rainy and dry seasons in the zone. Rice, wheat, and the horticultural crops of water melon, onions and tomato are produced in under irrigation while Rice and other cereals are cultivated under rein-fed. 169
3.3.2. Use of improved technologies
AnimalTManualtillagecultivationractortraction 7012544
3.3.3. Major Crops Cultivated
Total 140 100 It is quite clear that most farmers (50%) used animal traction, followed by manual cultivation method (39%). Only very small proportion of farmers (8% and 3% respectively used tractor and zero tillage methods for cultivation.
Frequency
Table 5: Distribution of farmers according to land cultivation method. Land cultivation method Frequency Percentage Zero 50.008.5738.572.86
Total 140 100 For rice is mainly FARO 44 and FARO 60, FARO 61, FARO 57, which are all improved varieties. For the ATASP-1 crops, improved varieties are cultivated but for other crops, farmers cultivate both local and improved varieties. For the ATASp-1 crops, the agronomic recommendations which often accompany the crop variety as a package are also followed to get the maximum output from it. Some of these recommendations includes fertilizer, spacing, use of agro-chemicals, nursery preparations for crops that land bunding to control water.
The technology of crop production the zone includes traditional and improved one. Land preparation was done usually by manual means and use of animal traction as well as tractors and its implements in some cases. In some other cases farmers made use of herbicides to control weeds during land preparation and to control weeds on the cropped land. Table 6 shows the distribution of farmers according to land preparation method used. 2 Land preparation method methodpreparation Percentage Slash and Burn Use of Herbicide 5585 39.2960.71
Land
The major crops cultivated in the zone are shown in Table 6 and the include rice, sorghum, maize, millet, wheat, groundnut, cowpea, soybean, onion, tomato and water melon. With the exception of tomato, these crops are more produced in Kebbi State 170
than Sokoto State, suggesting that Kebbi State in deed is State to target for food security programme in the country.
Rice is the major crop processed in the zone. The processing involves threshing, cleaning and sorting for other crops and threshing, drying and milling for rice. Labour used for household processing is sourced from mainly (70%) from family members and from hiring (25.71%) as shown in Table 6. For those that do machine processing, 17.14% milled their produce while 5% of the respondents used group processing and 1.43% did not process their produce at all (Table 6).
When the crops are ready for harvesting, from FGDs, farmers use manual mean and tools such as sickle and knife/cutlass to cut the stalk/stem, thresh with sticks and drums or threshing machines and drying on tarpaulin or cement floor.
The capacity of the processing plants varies from 2-7MT/day for the small-scale processors to 18,000- 130,00MT/day for the large-scale processors. The paddy is sourced from farmers and markets within the communities. Processing operation is for about 10- 12 months a year. The processing price is determined on basis of bag or mudu of paddy processed at about N20/mudu or N640/bag while the price of paddy rice is determined by market reigning price. The major challenge is that of getting enough paddy to process especially if there is production problem like major pests and diseases and drought that lowers output.
Table 6: Distribution of farmers accor ding to type of labour and processing method used for major crops in the Zone Labour & Processing method Frequency Percentage 27243698 1.4351725.7071.14 171
DoGroupMillHiredFamilylabourprocessingnotprocess
The productivity of these crops varies from crop to crop and also from state to state. From the yields shown in Table 4 for ATASP-1 crops, the average rice yields in Kebbi and Sokoto State were 3,979kg/ha and 2,670kg/ha respectively while for sorghum they are 1,876kg/ha in Kebbi and 764kg/ha in Sokoto States. Again, the productivity of these crops is much higher in Kebbi State than in Sokoto State.
3.5. Processing of major crops
3.3.4. Output/yield Levels
3.4. Harvesting of major crops
chanMarketingnel
markLocalmarkRtakOffersegionaletet 92228
markLocalmarkRtakOffersegionaletet 6350 45.003.570
3.2. Access to credit and extension services Credit is a very important aspect of production. In the zone majority of farmers (90.71%) used their personal savings while about 54.29 % accessed credit from family members (Table 8). Other sources of informal credit used by farmer include money lenders (17.89%) and Cooperative societies from which 8.57% borrowed. For the formal credit source, Bank of Agriculture (BOA) top the list with 40% of farmers accessing credit from the source. Only 5.71% benefited from commercial bank credit, which shows that farmers still rely largely on non-formal credit sources for their production. 172
Table
3.6. Marketing channels of major crops. The produce from the farm are marketed in three ways in the zone. About 20% of the Rice is sold through Off-takers, 1.43% is sold through directly at the regional market while the bulk (65.71%) is sold at the local or village markets.For Sorghum, nothing was sold through Off-takers but 45% was sold through local markets while only about 4% was sold in the regional bulking markets (Table 7). Most of the produce sold at the local markets include those sold at home as grain vendors move from house to house to buy and those farmers not ready to take the trouble of looking for vehicle to transport to market simply sell at home. 7: Marketing channels of major crops in Kebbi Sokoto Zone Rice Sorghum Frequency Percentage Frequency Percentage 65.1.4320.0071
channelMarketing
Table 8: Distribution of farmers according to available credit sources Credit source Frequency Percentage Family members Personal savings Cooperative society CommercialBOA Bank Money lenders 258561212776 175.408.5790.54.297171.86 Farmers in the zone have access to farm advisory services/extension in many ways. The most patronized (25%) source of extension services is the Local Government Area (LGA) extension Staff from Agric department (Table 9). It was closely followed by extension staff of the ADPs (24.28%). The other major source is the ATASP-1/ IITA/Africa Rice (17.86%), Other project staff (8.57%), NGOs (4.28%) and Lead farmer (2.86%). In terms of frequency of visit, ATASP-1 extension staff, LGA extension staff and State ADP staff all visited more than five times a year while extension staff of other provided services of 1-2 contacts/year. Table 9: Distribution of farmers according to available sources of farm advisory/extension services serviceSourceFrequencyofExtension contact/yr1-2 % contact/yr3-5 % contact/yr>5 % LeadNGOLOtherState1/IITATASPA/AFRICARICEADPprojectsGAAgricDeptStafffarmers 4635123425 2.864258.572417.86.28.28 332232386 23.571.4316.421.43274.28.14 44134325103 31.430.242.141773.57.86.2871 173
Cost and returns analysis Table 10 shows the breakdown of associated costs, revenue, gross margin and return per Naira invested on the farms. The gross margin analysis was used to determine profitability based on the assumption that most of the farmers used little or no fixed inputs and therefore incur no fixed cost. From the analysis, rice as a crop is the most important in terms of profitability with a gross margin of N426,000/ha and a return per naira invested of N3.79 and followed by maize with a gross margin of N176,000 /ha and a return to naira invested of N2.45; Sorghum with a gross margin of about N101,000/ha and return to Naira invested of N1.16 with millet being the least profitable crop in the CPZ. Although millet is the least profitable, it is the most staple food crop in the zone and still grown in the traditional way using mainly the local varieties comprising of the early and late races.
174
In order to examine the comparative importance of the major crops grown the CPZ, the costs and returns from each crop was determined. To do this, the inputs used were costed while the yields and revenues from their sales also determined.
3.8
Comparative Importance of major crops
fflbTae10:ComparativeProitAnalysisothemajorcropsgrownintheKebbiSokotoCPZin2011 lbiVarae input hlliiiRceMazeMetSorgum Average input tocs f%o lttoa lbiavrae tocs Average inputcost f%o lttoa lbiavrae tocs Average inputcost f%o lttoa lbiavrae tocs Average inputcost f%o lttoa lbiavrae tocs lPanting litmaera 8866177.900012.51700011.2755426.39 liFKPNertizer )k(g 8030127.462100029.202059033.162051123.65 fUreaertilizer )k(g 88816516.63161291.60 dFarmyar enmaur 03996475.7475.45 diiInsectces37583.3524003.3413002.0915231.75 dbHericies86407.7055207.6817902.8856326.49 dlbLaouran lcearing 8888883176.3600011.1200012.7605.77 lbLaourpanting73806.5860008.34750012.0847775.51 bLaour deewing 8887747.21000013.9010013.041041712.01 fbLaourertilizer lppaication 9922091141.141.4 bLaour harvesting 8880930000930261151.11.70012.565619.7 175
I . T o t a l v a r i a b l e c o s t 1 1 2 , 1 6 3 1 0 0 7 1 , 9 2 0 1 0 0 6 2 , 0 8 0 1 0 0 8 6 , 7 2 1 1 0 0 F a r m i n c o m e Y i e l d ( K g ) 3 , 9 7 9 2 , 4 8 4 1 , 1 3 1 1 , 8 7 6 P r i c e / 1 0 0 k g b a g 1 1 , 0 0 0 1 0 , 0 0 0 1 1 0 0 0 1 0 , 0 0 0 I I . G r o s s f a r m i n c o m e 4 3 7 6 9 0 2 4 8 , 4 0 0 1 2 4 4 1 0 1 8 7 6 0 0 I I I . G r o s s m a r g i n 4 2 5 , 5 2 7 1 7 6 , 4 8 0 6 2 , 3 3 0 1 0 0 , 8 7 9 I V . R e t u r n t o n a i r a i n v e s t e d 3 . 7 9 2 . 4 5 1 . 0 0 4 1 . 1 6 176
3.1 Comparative Assessment of Field Findings with results of previous studies
Hectarage devoted to each crop (average farm size)
The results from the analysis confirms the findings in literature that Rice is an important crop in the zone. In terms of hectarage, sorghum was largest on an average of 2.98ha in Kebbi, followed by rice which on average was 2.82ha and these two crops incidentally are the ATASP-1 crops. This show that the crops are properly captured as the most important crops in the zone. Other crops of importance in the zone are millet (1.7ha) and cowpea (1.6ha), groundnut (1.4ha), maize (1.32ha), Soybean and wheat 1.0 ha each). For the horticultural crops, water melon (1.5ha) and onions (1.1ha) and tomato (0.4ha) are also cultivated. Rice production in Kebbi state has been on increase from 2005 to date. Between 2015 and 2016 the production has gone up from between 751,000 MT to 1,805,000 MT annually respectively. A yield of up to 9mt per hectare was recorded in some areas where the best of agronomic practices was put into practice, but the average yield under the State implemented programme was about 4.5MT per hectare (Source: Brief on Rice production Initiative in Kebbi State). However, from the baseline study, average paddy field size was 1.5ha. (Source: Kebbi State Rice Farmers Baseline Survey, 2016). In this study, average area cultivated to rice was higher than at the baseline finding while the average yield was close to that obtained under the state wide implemented rice programme. Also, the average gross margin for rice of N425,527/ha was in the range of 250,000 - N 500,000/ha obtained at the baseline (Source: Kebbi State Rice Farmers Baseline Survey, 2016). Rice yield in Kebbi State has gone higher from less than 1MT per hectare in 2005 to about 2 MT per hectare in 2006 – 2007 with the introduction of KATASHI, NATASHI programmes (Source: Promoting productivity in the priority crops in Kebbi State-linking data and policy). In another study conducted in the CPZ, it was found that rice yield in Sokoto State was on average a paddy yield of 4,994kg/ha while sorghum yield was 3000kg/ha under Fadama III AF, which suggest under performance under the ATASP-1 (Fadama III AF, 2017).
3.2 Production needs in each SCPZ
The production needs of the farmers are derived mainly from their access to farm inputs and how they dispose their farm products. Table 11a & b and Figures 1a & b gives the 177
In terms of hectarage, sorghum was largest with an average cultivated area of 2.98ha in Kebbi, followed by rice which on average was 2.82ha and these two crops incidentally are the ATASP-1 crops in the zone. This show that the crops are properly captured as the most important crops in the zone. Other crops of importance in the zone are millet (1.7ha) and cowpea (1.6ha), groundnut (1.4ha), maize (1.32ha), Soybean and wheat 1.0 ha each). For the horticultural crops, water melon (1.5ha) and onions (1.1ha) and tomato (0.4ha) are also cultivated (Table 10).
In Kebbi State, the first need was land preparation equipment/tool. This is quite understandable given the drudgery involved in tilling the land especially for rice under the heavy soils. However, in Sokoto State, this problem was ranked third and therefore confirms the need to provide mechanization tools/equipment like tractors, work bulls and their implements under hiring arrangement to support farmers' production activities. Specifically, farmers are asking for power tillers that can hand operated, tractors and animal pulled moldboard ploughs, The second priority problem in Kebbi State was pests and diseases, which was not the thcase in Sokoto State (7 ) probably because of the crop of emphasis. The problem of Quell birds on cereal crops in the dry savanna of Nigeria is well documented in literatures. There is therefore need to provide bird scaring tools and also control pests and disease outbreak on farms in the zone.
thExtension service was the 5 need required by farmers in Sokoto State and this is very important given the fact that most of the State Agricultural Development Projects (ADPs) are lacking the required number of village Extension Agents (VEAs), despite the fact that ADPs and ATASP-1 EAs and lead/contact farmers provide this service to farmers at present. 178
ndThe third major problem in Kebbi State was lack of improved seeds and this was the 2 raked problem in Sokoto State, suggesting that for the ATAS_1 crops, farmers must have access to the improved seeds. It is common knowledge that farmers' access to improved seeds in Nigeria is still very low (5-10%) and even for those that have access, the issue of fake or adulterated seeds being sold as improved seeds is rampart.
summary of these needs and their priority ranking in Kebbi and Sokoto States.
The 4th major problem in Kebbi State is farmers' access to fertilizer either due to high cost or availability of quality fertilizers. In Sokoto State, this was the first priority need and therefore, the government should ensure availability of quality fertilizers at the time needed and at affordable prices.
th thCredit need ranked 5 among the needs of farmers in Kebbi State. However, it ranked 4 in Sokoto State indicating that farmers need production credit for various reasons including input procurement and carrying out farm operations. This was one reason for the anchor borrower scheme and the credit support from the off-takers. Thus, there is need to strengthen this scheme and make it more effective.
Table 11a: Distribution of farmers according to production needs and priority ranking in Kebbi State Production needs Frequency Percentage Rank ImprFCreditLandertilizeroved seeds (insecticides)controlPLandLabourExtensionsourcingpreparationestanddisease 8895201755514421 73.3379.1716.671445.8342.536.6717.5.17 56th th 4th 3rd 8th 7th 1st 2nd 179

Table 11b. Distribution of farmers according to production needs and priority ranking in Sokoto State Production needs Frequency Percentage Rank ImprFCreditLandertilizeroved seeds Extension Services Labour sourcing Land preparation Pest and disease control (insecticides) 5166101819145 2580305090957025 7th 4th 1st 2nd 5th 6th 3rd 7th 3.5 Harvesting and Storage needs in each SCPZ The harvesting needs are presented in Table 12a & b and in figures 2a & b for Kebbi and stSokoto States respectively. Apparently, threshing equipment and tools are the 1 priority in the two States. This clearly indicate the level of drudgery involved in using manual harvesting to cut and threshed the paddy/heads/cobs from the stalk. At present, most farmers use knife/sickles and cutlasses to do the harvesting operations and would need rice hand motorized reapers for rice or a combine harvester to take care of cutting operations. Threshing and winnowing machines are also needed while storage facilities beyond the bags are needed by farmers. 180

The second harvesting need in Kebbi State is drying surfaces and this and bagging was nd rdalso ranked 2 in Sokoto State. Bagging was ranked 3 in Kebbi State. At present, drying is done under sun and on bare floor or sew bags. The farmers need cemented slabs, tarpaulin or heat blown machines to quickly dry the grains rather than depending only sun-drying. Bagging ia a problem because storage in bags deteriorate faster and subject to rodents attach in storage. Table 12a: Distribution of farmers according to harvesting needs and priority ranking in Kebbi State Harvesting needs Frequency Percentage rank Cutting Drying Threshing Bagging 74 94 118 93 61.67 78.33 98.33 77.5 4th 2nd 1st 3rd Table 12b: Distribution of farmers according to harvesting needs and priority ranking in Sokoto State Harvesting needs Frequency Percentage Rank Cutting Drying Threshing Bagging 12 19 20 19 60 95 100 95 4th 2nd 1st 2nd 181

Table
The farmers in in the zone indicated several need to facilitate processing of their farm produce as shown in Table 13a & b and figure 3a & b. The number one priority is power or source of energy in KebbiI state. This has become a major challenge to processors as electricity is either completely lacking or highly epileptic in supply and so have to use generator to power their machines and thereby increasing the cost of operation. The second priority is access to processing machine, but it is the number one priority in Sokoto State. The need is in terms of affordability, size and quality and spare parts availability, especially sieves. They need include rice dehullers, parboiler flour milling machines. However, access to drying surface is a number one priority Sokoto State while it is number three in Kebbi State. Machine maintenance is the fourth and fifth needs in kebbi and Sokoto State respectively and therefore the need to provide adequate spare parts of imported machines and to train local fabricators to produce them locally. 13a: processors in Kebbi State
3.1 Processing Needs of Farmers in each SCPZ
Processing needs of
Processing needs Frequency Percentage rank Water Power Access to Drying Access to processing machines Maintenance 83 97 87 92 47 69.17 80.83 72.5 76.67 39.17 4th 1st 3rd 2nd 5th 182

Table 13b: Processing needs of processors in Sokoto State Processing needs Frequency Percentage rank AccessPWaterower to Drying Access to processing Maintenancemachines 1219191810 6095959050 5th 3rd 1st 1st 4th 183


Marketing needs Frequency Percentage rank Access to market OffTinformationransportation-takers 7911289 65.8393.3374.17 2nd 1st 3rd 184
3.8 Marketing and Transportation Needs of Farmers in each SCPZ
Table 14a &b and Figs 4a &b show the marketing and transportation needs of the stfarmers in Kebbi and Sokoto States respectively. In Kebbi State, the 1 priority need is transportation facilities while in Sokoto State, transportation was the first priority. Transportation is presently by means of animal drawn cart, pick-up vans and motorcycles, which some farmers are lacking or are having problem of access due to lack of access roads to the farms and even to markets beyond thevillages. The second ranked priority need in Kebbi is access to market information and this was ranked first in Sokoto State. Farmers depends more on information provided by traders in the markets and quite often not aware of price information in advance, hence there is need to set and disseminate this information using radio and other means accessible to farmers more regularly.The third need by farmers in the two States is off-takers. Many of the farmer groups complained of absence of off-takers in their communities and the menace of middlemen, who often offered lower prices than is available in markets for the day. Marketing and Transportation needs of processors in Kebbi State
Table 14a:

3.10 Needs of Fabricators in each SCPZ
stThe 1 priority need of the agro-equipment fabricators is power. Since their work depends on reliable source of energy, they need fairly constant electricity, which is presently lacking. In addition, they need modern workshop with the necessary welding and drilling machines to work with. The last but not the least is lack of sufficient working capital. This is needed to facilitate theproduction of farm equipment and spare parts locally
Table 14b: Marketing and Transportation needs of processors in Sokoto State Marketing needs Frequency Percentage Rank Access to market OffTinformationransportationtakers 181920 9095100 1st 2nd 3rd
3.11 Needs of Agro-input dealers in each SCPZ
The need identified by agro-input dealers from the FGD are only two. The first is lack of sufficient capital to make input purchases on time and make it available to farmers. To overcome this challenge, the anchor-borrower scheme is very necessary for input dealer to be part of it. The second need of the Agro-dealers is the in ability to recover credit extended to farmers for production. Farmers default in credit payment has always been a problem 185

4.0:
186
with agricultural lending in Nigeria and therefore, proper contract agreement with insurances needs to be put in place for the success of future programme. General Field Observation It was observed that ATASP-1 in the zone is well organized with the different actors performing their roles. In some cases, out-grower and anchor- borrower schemes relationship exists between farmers and processors while in some cases, processors process on credit for their regular customers. There were reported cases of breach of contract between farmers and off-takers and or processors delivery on produce delivery and purchases.
(ii) Educational status of farmers. The educational status of farmers in Kano State included Koranic, primary, secondary, post-secondary, mass literacy school, and no formal education. Specifically, out of 120 respondents, 30.8%, 20%, 19.2%, 25.8% had respectively Koranic, primary, secondary and post-secondary school education, while 3.3% had mass literacy school education and only one farmer (0.8%) had no formal education. In Jigawa State, the educational status of the 10 respondent farmers comprised Koranic (22%), primary (27%), secondary (17%), post-secondary (29%), mass literacy school (2%) and no formal education (1%). Table 1 (a): Age distribution of ATASP – 1 farmers in Kano State. Age of farmers (years) Frequency Percentage 21 30 31 40 41 60 52845357 4.1723.333729.175.83.5 100 187
50 51 More60than
The age of respondent farmers in Kano State varied from between 21 – 30 years to more than 60 years. Specifically, out of the 120 respondents, 5.8%, 29.2%, and 37.5% were aged 21 – 30, 31 – 40 and 41- 50 years, respectively. Of the remainder, 23.3% were 51 – 60 years old, while only 4.2% were more than 60 years only. Thus, 72.5% of the farmers were below 50 years of age, with the vest (27.5%) being more than 50 years; the average age of Kano State respondent farmers was 42.4, with the age varying from 24 to 75 years (Table 1a). With respect to Jigawa State farmers, their age varied from 20 t0 75 years, the mean age being 47.3 years. Among the 100 respondents, 7%, 18%, 39%, and 23% were aged 21 – 30, 31 – 40, 41 – 50 and 51 – 60 years, respectively, while 11% were more than 60 years old (Table 1b).
REPORT OF KANO-JIGAWA SCPZ 3.0: Results and Socio-economicDiscussionCharacteristics of respondents 1.1.1. Social characteristics
(i) Age of farmers.
MinimumMaximumMeanTotal 247544.42120
(iii) Gender of respondent farmers
In Kano State, 110 (92%) out of the 120 respondent farmers were males and only 10 (8%) were females. By contrast, all the 100 respondent farmers in Jigawa State were males.
The average numbers of persons per household was 16.7, while the minimum and maximum numbers were 1 and 50, respectively (Table 2a). In Kano State, the number of persons per respondent household were: 1 – 5 (11.7%), 6 – 10 (35%), 11 – 15 (22.5%), 16 – 20 (16.7%) and more than 20 (11.7%); the average number of persons per household was 12.5, while the maximum and minimum numbers were 35 and 1 (Table 2b).
The respondent farmers in both Kano and Jigawa States accessed land for crop production through two or more land tenure systems. The land tenure systems among Kano State respondents included: inheritance (84.2%) purchase (66.6%), rent (15%), borrowed (15.8%), shared cropping (3.3%) and lease (0.8%); it is noted that the figures do not add up to 100% because land was acquired through two or more systems. Similarly, Jigawa State respondent farmers acquired land for crop production through the following two or more 188
(v) Land tenure system
Table 1 (b): Age distribution of ATASP 1 farmers in Jigawa State. Age of farmers (years) Frequency Percentage 21 30 31 40 41 50 51 More60than 60 112339187 112339187 MinimumMaximumMeanTotal 207547100.31 100
(iv) Household size of respondent farmers
The number of persons in each household in Jigawa State were as follows: 1 – 20 (4%), 6 – 10 (19%), 11 – 15 (32%), 16 – 20 (26%), and more than 20 (19%).
systems; inheritance (86%), purchase (37%), rent (6%), borrowed (12%) and shared cropping (3%). Table 2 (a): Number of persons per ATASP – 1 respondent farmer in Jigawa State. Number of persons/household Frequency Percentage 1 5 6 10 11 15 16 More20than 20 192632194 192632194 MiMaximumMeanTotalnimum 15016.1007 100 Table 2 (a): Number of persons per ATASP 1 respondent farmer in Kano State. Number of persons/household Frequency Percentage 1 5 6 10 11 15 16 20 > 20 1420274214 11.6716.6722.53511.67 MinimumMaximumMean 1312.55 189
(i) Costs and returns analysis of rain-fed rice production in Kano – Jigawa CPZ. The costs and returns analysis of rain-fed rice production in the Kano – Jigawa 190
1.1.2. Economic Characteristics (i) Crops cultivated. The ATASP – 1 crops of the Kano – Jigawa CPZ are rice and sorghum. Other major crops cultivated in Jigawa State are pear/millet, cassava, soybean and wheat. On the other hand, major crops cultivated the study LGAs of Kano State are cowpea, millet, groundnut, maize and soybean.
The average size of rice fields of the Kano State respondents was 1.3 ha, the average yield being 2,692 kg/ha; rice was cultivated by 33% of the respondent farmers. Sorghum was cultivated by 67% of the respondent farmers in Kano State, with an average farm size of also 1.3 ha and average yield of 2,689 kg per hectare.Amongthe Jigawa State respondent farmers, the average rice farm size was 2.4 ha with average yield of about 4,000 kg/ha; rice was grown by 45% of the respondent farmers. On the other hand, sorghum was cultivated by 55% of the respondent farmers, with an average farm size of 1.7 ha and a yield of 1,700 kg/ha.
1.2.1. Cost and Returns Analysis: Profitability of ATASP – 1 Crops (Rice, Sorghum Cassava) and One of the Other Major Crops (Millet) Common to both Kano and Jigawa States. The ATASP – 1 crops of the Kano – Jigawa CPZ are rice and sorghum. Although cassava is also cultivated in Jigawa State, it is not a major ATASP-1 crop in the State as only one LGA (Gwaram) is involved in the production. Rice is cultivated by 33% of the respondent farmers in Kano, and 45% of the respondent farmers in Jigawa State. On the other hand, sorghum is grown by 55% of the respondent farmers in Jigawa State, while 67% of those in Kano State grow the crop. Among the other major crops grown by the respondent farmers in the two states, only millet and sorghum are common in both states. While 33% and 1% of the respondent farmers grow millet and soybean, respectively in Jigawa State, 10.8% and 4.2% of the respondents cultivate millet and soybean in Kano State. In view of the above, the cost and returns analysis below, presents data for the ATASP – 1 crops (sorghum, a rice and cassava) and the major common, non-ATASP – 1 crop (millet).
(ii) Farm size and yield.
1.2. Comparative Importance of Major Crops.
With an average paddy yield of 2,692 kg/ha and a price of NGN 11,000.0 per 100 kg of paddy rice, the gross farm income was NGN 296,120.0/ha. This gave a gross margin of NGN 196,950.0/ha and return of NGN 1.98 for every NGN 1.0 invested. The conclusion is that rain-fed rice production in the Kano – Jigawa CPZ is profitable.
The costs and returns analysis of sorghum production in the Kano – Jigawa CPZ is presented in Table 4. The table shows that fertilizers (NPK and Urea) constitute the highest variable cost (47.47%) of sorghum production. The second highest variable cost is labour (for land clearing, planting, weeding, fertilizer application and harvesting), which constitutes 35.07% of the total variable cost. Farm yard manure and herbicides constitute 9.94% and 9.13%, respectively of the total variable cost. On the whole, total variable cost was NGN 91,762.0/ha. With an average yield of 2,689 kg of grain/ha and a price of NGN 10,000.0 per 100 kg of grain, the gross farm income was NGN 268,900.0/ha. This resulted in a gross margin of NGN 177,138.0/ha and a return of NGN 1.93 for every NGN 1.0 invested. Thus, sorghum production in the Kano – Jigawa CPZ is profitable. 191
CPZ is summarized in Table 3. The table shows that fertilizers (NPK and urea) constitute the highest variable cost (49.92%) of rice production in the CPZ. It is followed by labour costs (for land clearing, planting, weeding, fertilizer application and harvesting) totaling 33.45% of rice production. Seed and farm yard manure constitute 7.6% and 7.06%, of the total costs. The total variable cost was NGN 99,170/ha.
(ii) Costs and returns analysis of sorghum production in Kano – Jigawa CPZ
Table 3: Costs and returns analysis of rice production in Kano Jigawa CPZ. Variable Value (NGN/ha) Percentage Variable cost Planting material (seed) NPK fertilizer (kg) Urea fertilizer (kg) Farm yard labourlabourLabourLabourLabourHerbicidesInsecticidesmanurelandclearingplantingweedingfertilizerapplicationharvesting i. Total variable cost Farm income Yield Price/100kg(2692kg)bag (paddy) ii. Gross farm income iii. Gross margin iv. Return to naira invested 9630181280165908780559133038700018500240117537 1.9819695029612011,00099170 9.1.838.085.9675.963.06718.65247.60.21.06.8771 100 192
Table 4: Costs and returns analysis of sorghum production in Kano Jigawa CPZ. Variable Value (NGN/ha) Percentage Variable cost Planting material (seed) NPK fertilizer (kg) Urea fertilizer (kg) Farm yard labourlabourLabourLabourLabourHerbicidesInsecticidesmanurelandclearingplantingweedingfertilizerapplicationharvesting i. Total variable cost Farm income Yield Price/100kg(2689kg)bag (paddy) ii. Gross farm income iii. Gross margin iv. Return to naira invested 9632271697514635544383743949125149001954132469 1.931771382689001000091762 1002.9610.635.055.939.1349.9416.2421.293.54.79 100 (iii) Costs and returns analysis of cassava production in the Kano – Jigawa CPZ The study covered the production of cassava in Farin Dutti community, Gwaram LGA of Jigawa State. Labour has the highest variable cost of N38,100, constituting about 44% of the total cost of production. The total variable cost was N87,000, while the gross margin was N97,000. The summary of the gross margin analysis is presented in Table 4b. 193
4B: Profitability of cassava production in Jigawa State Variables Value Percentage Variable cost Planting LabourapplicationLabourLabourLabourLabourHerbicidesInsecticidesFUreaNPK(Number)materialFertilizer(kg)fertilizer(kg)armyardmanureridgingplantingweedingfertilizerharvesting I. Total variable cost Farm income Yield (11500kg/ha) Price/100kg bag II. Gross farm income III. Gross margin IV. Return to naira invested 103400060008000980030002404000600010500230000 00 87000 1600 184000 97000 1.11 11.8446.909.1911.263.452.46.8912.0726.44.6076.60 100 (i) Costs and returns analysis of millet production in the Kano – Jigawa CPZ. The costs and returns analysis of millet, (a non-ATASP – 1 crop) production in the Kano – Kigawa CPZ is summarized in Table 5. Unlike rice and sorghum, labour (for land preparation, planting, weeding and harvesting) constitute the highest variable cost (39.11%), while fertilizer is the second highest variable cost (32.38%). Seed constitutes 12.92% the variable cost. The total variable cost was NGN 58,014.0/ha. The average yield of millet was 1,879 kg/ha while the price was NGN 11,000.0/100 194
kg of millet graving. This gave a gross farm income of NGN 206,690.0/ha, resulting a gross margin of NGN 148,676.0/ha, and a return of NGN 2.56 for every NGN 1.0 invested; this makes millet production in the zone more profitable than either rainfed rice or sorghum production. Table 5: Costs and returns analysis of millet production in the Kano – Jigawa CPZ. Variable Value (NGN/ha) Percentage Variable cost Planting material (seed) LabourHerbicidesInsecticidesFertilizerland clearing Labour planting Labour weeding labour harvesting i. Total variable cost Farm income Yield Price/100kg(1879kg)bag (paddy) ii. Gross farm income iii. Gross margin iv. Return to naira invested 850072005300750018051424187857500 2.561486762066901100058014 1412.419.1312.923.112.4532.3812.92.65 100 1.2.2. Hectarage Devoted to Rice, Sorghum and Millet Production by the Respondent Farmers in Kano – Jigawa CPZ.
195
The total hectarage of rice cultivated by the respondent farmers in the Kano State is 50.7 ha, compared with 105.3 ha devoted to sorghum. In Jigawa State, respondent farmers devoted 108 ha to rice production and 148.5 ha to sorghum production. Taking the two states (that comprise the Kano – Jigawa CPZ), the total hectarage devoted to rice 158.7 ha, while a total of 253.8 ha was devoted to sorghum.
The total hectarage devoted to millet (the most widely grown non-ATASP – 1 crop common to the two states) by the respondent farmers in two states was 49.5 ha in Jigawa and 13.0 ha in Kano, giving a total of 52.5 ha.
3.4 Production Needs of Respondent Farmers of the Kano – Jigawa SCPZ
Table 6 (a) shows that the production needs, in descending order of importance, of respondent rice farmers in Kano State are: fertilizers, improved seeds, extension services, insecticides, credit access, land, labour sourcing, land preparation, and herbicides. Similarly, Table 6 (b) presents, in descending order of importance, the production needs of rice farmers in Jigawa State. These needs are as follows: fertilizers, credit, improved seeds, herbicides, insecticides, extension services, land, land preparation, and labour sourcing.
Table 6 (a): Production needs of respondent rice farmers in Kano State. Ranking in : Bagwai Burikure State
needsProduction
3.4.1 Production Needs of Respondent Rice Farmers. Based on the tables and histograms of the analysed data the production needs of rice farmers in the study LGAs of each state (Kano and Jigawa) were ranked. The weighted rankings for the LGAs were used to obtain weighted ranks for each state. The weighted ranks of production needs for Kano and Jigawa States are given in Tables 6 (a) and 6 (b) respectively. The weighted state ranks were used to compute the production needs of rice farmers in the Kano – Jigawa CPZ (Table 6 ©).
ImprFCreditLandertilizeroved seeds Extension services Labour sourcing Land preparation Insecticides(herbicides)Weeding 4th 7th 11st st 3rd 5th 9th 8th 5th 6th 2nd 1st 3rd 5th 9th 6th 9th 4th 6th 4th 1st 2nd 3rd 7th 8th 9th 4th 196
Table 6 (b): Production needs of respondent rice farmers in Jigawa State. needsProduction Ranking in : Auyo Miga State ImprFCreditLandertilizeroved seeds Extension services Labour sourcing Land preparation Insecticides(herbicides)Weeding 3rd 1st 61st th 7th 7th 4th 5th 9th 9th 3rd 1st 2nd 5th 9th 9th 5th 3rd 5th 2nd 1st 3rd 5th 9th 8th 4th 5th Table 6 (c): Production needs of respondent rice farmers in Kano Jigawa SCPZ. needsProduction Ranking in : Kano State Jigawa State Kano Jigawa CPZ ImprFCreditLandertilizeroved seeds Extension services Labour sourcing Land preparation Insecticides(herbicides)Weeding 6th 4th 21st nd 3rd 7th 8th 9th 4th 5th 2nd 1st 3rd 5th 9th 9th 4th 5th 6th 3rd 1st 2nd 4th 9th 8th 7th 5th As shown in Tabl 6 (c), the production needs (in descending order of importance) of respondent rice farmers in the Kano – Jigawa CPZ are as follows: fertilizer, improved seeds, credit, extension services, insecticides, land, herbicides, land preparation, and labour sourcing. 3.4.2. Production Needs of Respondent Sorghum Farmers. The procedure, used above to determine the production needs of respondent 197
rice farmers, was adopted to determine the production needs of respondent sorghum farmers in Jigawa State, Kano State and the Kano – Jigawa SCPZ. Presented in Tables 7 (a) and 7 (b) are the production needs of the respondent sorghum farmers in Jigawa State and Kano State, respectively, while Table 7 (c) shows the production needs of respondent sorghum farmers in the Kano – Jigawa SCPZ. Table 7 (a): Production needs of respondent sorghum farmers in Jigawa State. Production needs Ranking in : Kafin Hausa Gwaram MadonMalam State ImprFCreditLandertilizeroved seeds Extension services Labour sourcing Land preparation Insecticides(herbicides)Weeding 9th 3rd 11st st 9th 9th 9th 9th 9th 7th 4th 1st 1st 3rd 4th 9th 8th 6th 6th 7th 5th 1st 1st 8th 4th 3rd 9th 7th 4th 2nd 1st 3rd 6th 7th 5th 9th Table 7 (b): Production needs of respondent sorghum farmers in Kano State. Production needs Ranking in : Bagwai Dawakin Bebeji Rano MalamGanun State ImprFCrediLandtertilizeroved seeds Extension services Labour sourcing Land preparation Insecticides(herbicides)Weeding 5th 1st 11st st 1st 7th 7th 5th 7th 9th 1st 1st 1st 7th 1st 1st 7th 1st 8th 3rd 1st 1st 4th 67th th 8th 4th 8th 9th 2nd 1st 3rd 6th 5th 3rd 6th 9th 9th 1st 2nd 3rd 4th 4th 4th 4th 9th 5th 1st 1st 3rd 7th 6th 8th 4th 198
Tables 8 (a) and 8 (b) show the harvesting and storage needs of respondent sorghum farmers in Kano and Jigawa States, respectively, while Table 8 (c) presents the harvesting and storage needs of the farmers in the Kano – Jigawa SCPZ. 199
3.5.1. Harvesting and storage needs of respondent sorghum farmers.
5th 8th 5th
Table 7 (a) shows that the production needs of respondent sorghum farmers in Jigawa State as follows (in descending order of importance): improved seeds, fertilizer, extension services, credit, herbicides, labour sourcing, land, land preparation, and insecticides. On the other hand, the following production needs of respondent sorghum farmers in Kano are (in descending order of importance) are fertilizer, improved seeds, extension services, insecticides, credit, land preparation, labour sourcing, herbicides, and land. (Table 7 b): Also, the production needs of respondent farmers in the Kano –Jigawa CPZ are (in descending order of importance) as follows: improved seeds, fertilizer, extension services, credit, labour sourcing, land preparation, insecticides, herbicides and land (Table 7 c):.
Table 7 (c): Production needs of respondent sorghum farmers in the Kano Jigawa SCPZ. Kano State Jigawa State Kano – Jigawa CPZ th 3.4 Harvesting and Storage Needs of Respondent Farmers of the Kano –Jigawa SCPZ. process used above to determine the production needs of respondent farmers was followed to determine harvesting and storage needs of the respondent farmers in the Kano – Jigawa CPZ.
The
needsProduction Ranking in :
ImprFCreditLandertilizeroved seeds Extension services Labour sourcing Land preparation Insecticides(herbicides)Weeding 9th 5th 1st 1st 3rd 7th 6th 8th 4th 7th 4th 2nd 1st 3rd 6th 7th 5th 9th 9th 4th 2nd 1st 3rd 5
the
State. Harvesting & storage needs Ranking in : Kafin Hausa Gwaram MadoriMalam State BaggingThreshingDryingCutting 3rd 4th 1st 2nd 4th 3rd 2nd 1st 1st 1st 1st 1st 3rd 3rd 1st 1st 200
As shown in Table 8 (a), among the four harvesting and storage needs of respondent sorghum farmers in Kano State, threshing is ranked first while cutting and drying needs are ranked second, with bagging needs ranked fourth. In Jigawa State threshing and bagging needs were ranked first, followed by cutting and drying needs (Table 8 b). Across Kano – Jigawa CPZ, threshing needs remains the most important, while the three other needs were all ranked second (Table 8 ©).
3.5.2. Harvesting and storage needs of respondent rice farmers.
Harvesting & storage needs Ranking in : Bagwai Dawakin Bebeji Rano MalamGanun State BaggingThreshingDryingCutting 1st 1st 11st st 1st 1st 1st 4th 4th 3rd 1st 2nd 1st 1st 1st 1st 2nd 3rd 1st 4th 2nd 2nd 1st 4th Table 8 (b): Harvesting and storage needs of respondent sorghum farmers in
Among the harvesting and storage needs of respondent rice farmers in Kano State, drying need was ranked first, followed by threshing, cutting, and bagging needs in that order of descending importance. In Jigawa State, threshing need was ranked first, while both cutting and drying needs came second and bagging need was the last. Also, across the Kano – Jigawa SCPZ, both threshing and drying needs ranked first, while cutting and bagging needs were third and fourth, respectively. (a): Harvesting of respondent sorghum farmers in Kano State. Jigawa
Table 8
and storage needs
The harvesting and storage needs of respondent rice farmers in Kano and Jigawa State are shown in Tables 9 (a) and 9 (b), respectively, while Table 9 (c) indicates the harvesting and storage needs of rice farmers in the Kano – Jigawa CPZ.
Table 8 (c): Harvesting and storage needs of respondent sorghum farmers in Kano Jigawa State. Harvesting & storage needs Ranking in : Kano State Jigawa State Kano – Jigawa CPZ BaggingThreshingDryingCutting 2nd 2nd 1st 4th 3rd 3rd 1st 1st 2nd 2nd 1st 2nd Table 9 (a): Harvesting and storage needs of respondent sorghum farmers in Kano State. Harvesting & storage needs Ranking in : Bagwai Bunkure State BaggingThreshingDryingCutting 1st 1st 3rd 4th 4th 2nd 1st 2nd 3rd 1st 2nd 4th Table 9 (b): Harvesting and storage needs of respondent sorghum farmers in Jigawa State. Harvesting & storage needs Ranking in : Auyo Miga State BaggingThreshingDryingCutting 4th 2nd 1st 3rd 1st 3rd 2nd 4th 2nd 2nd 1st 4th Table 9 (c): Harvesting and storage needs of respondent sorghum farmers in Kano Jigawa SCPZ. Harvesting & storage needs Ranking in : Kano State Jigawa State Kano Jigawa CPZ BaggingThreshingDryingCutting 3rd 1st 2nd 4th 2nd 2nd 1st 4th 3rd 1st 1st 4th 201
needs
Table 10 (a): processing needs of respondent rice farmer in Kano State. 10 (b): processing of respondent rice farmer in Jigawa State.
Processing needs Ranking in: Auyo Miga State AccessPWaterower to drying Access to processing machine Cost of processing machine Processing machine maintenance 1st 2nd 3rd 4th 5th 5th 4th 2nd 3rd 1st 5th 5th 2nd 1st 4th 2nd 5th 5th 202
The processing needs of the respondent rice farmers in Kano and Jigawa States are given in Table 10 (a) and 10 (b), respectively, while Table 10 (c) presents the processing needs of the respondent farmers in the Kano – Jigawa SCPZ.
3.4 Processing Needs of Respondent Farmers in the Kano – Jigawa CPZ.
Among the six processing needs of farmers in Kano State, the need for power supply was ranked first. The other needs, ranked in descending order of importance, were: water, access to drying, access to processing machines, processing machine maintenances, and cost processing machine acquisition (Table 10 (a)). In Jigawa State, power supply was still ranked first, but, in descending order of importance, the other needs were ranked as follows: water, access to processing machine, access to drying, cost of acquisition of processing machine, and machine maintenance (Table 10 (b)). Across Kano – Jigawa CPZ, power supply and water still retained the first and second rankings. The other needs, ranked in descending order of importance were as follows: access to processing machines, access to drying, processing machine maintenance, and cost of processing machine (Table 10 ©)
3.6.1. Processing Needs of Respondent Rice Farmers
Processing needs Ranking in: Bagwai Bunkure State AccessPWaterower to drying Access to processing machine Cost of processing machine Processing machine maintenance 2nd 1st 2nd 5th 5th 4th 2nd 1st 3rd 4th 6th 5th 2nd 1st 3rd 4th 6th 4th Table
needs of sorghum farmers across the Kano – Jigawa SCPZ are presented in Table 11 (c), which ranks water as the most important need. Water is followed by access to processing machine, power supply, access to drying facilities, cost of processing machine, and processing machine maintenance, in that order of decreasing importance.
203
3.6.1. Processing Needs of the Respondent Sorghum Farmers.
Tables 11 (a) and 11 (b) present the processing needs of the respondent sorghum farmers in Jigawa and Kano State, respectively, while Table 11 (c) shows the processing need of the respondent sorghum farmers across the Kano – Jigawa SCPZ.
The need for water was ranked first among the six processing needs of respondent sorghum farmers in Jigawa State; it was followed by access to processing machines, power supply, access to drying, cost of processing machine, and maintenance of processing machine (Table 11 (a)). Similarly, water and access to processing machines were ranked first by the respondent sorghum farmers in Kano State; they were followed in the third and fourth places by power supply and access to drying facilities (Table 11 The(b)).processing
Table 10 (c): Processing needs of respondent rice farmer in Kano – Jigawa SCPZ. Processing needs Ranking in: Kano State StateJigawa Kano Jigawa CPZ AccessPWaterower to drying Access to processing machine Cost of processing machine Processing machine maintenance 2nd 1st 3rd 4th 6th 4th 2nd 1st 4th 2nd 5th 5th 2nd 1st 4th 3rd 6th 5th
Table 11 (a): Processing needs of respondent sorghum farmers in Jigawa State. Processing needs Ranking in: HausaKafin Gwaram MadoriMallam State AccessPWaterower to drying Access to processing machines Cost of processing machine Processing machine maintenance 3rd 2nd 4th 1st 5th 5th 1st 1st 4th 3rd 5th 5th 1st 4th 2nd 2nd 4th 5th 1st 3rd 4th 2nd 5th 6th Table 11 (b): Processing needs of respondent sorghum farmers in Kano State. Processing needs Ranking in: iBagwa nDawaki Bebeji Rano MalanGarum State AccessPWaterower to drying Access to processing Costmachinesofprocessing machine Processing machine maintenance 1st 1st 1st 1st 5th 6th 1st 1st 6th 3rd 4th 5th 2nd 3rd 6th 1st 5th 4th 1st 1st 1st 1st 6th 1st 2nd 3rd 4th 1st 6th 5th 1st 3rd 4th 1st 6th 5th Table 11 (c): Processing needs of respondent sorghum farmers in Kano Jigawa SCPZ Processing needs Ranking in: Kano State Jigawa State Kano Jigawa SCPZ AccessPWaterower to drying Access to processing Costmachinesofprocessing machine Processing machine maintenance 1st 3rd 4th 1st 6th 5th 1st 3rd 4th 2nd 5th 6th 1st 3rd 4th 2nd 6th 6th 204
sorghum farmers in Kano State. Marketing and transportation needs Ranking in: iBagwa nDawaki Bebeji Rano MalanGarum State Access to market information Transportation facilities Off takers 1st 1st 1st 1st 1st 1st 1st 3rd 2nd 1st 1st 1st 2nd 1st 3rd 1st 2nd 3rd 205
3.7.2. Marketing and Transportation Needs of Respondent Rice Farmers. Table 13 (a) shows that all the three marketing and transportation needs of respondent rice farmers in Kano State had the same first place ranking. However, in Jigawa State, transportation facilities ranked first, with off-takers and market information taking the second and third rankings, respectively (Table 13 b). Also, across the Kano – Jigawa SCPZ, transportation facilities ranked first and was followed by Off-takers, which in turn was followed by access to market information
3.7.1. Marketing and Transportation Needs of Respondent Sorghum Farmers. All the three identified marketing and transportation needs of the respondent sorghum farmers in Jigawa were ranked first by the respondent farmers (Table 12 (a)). However, Table 12 (b), shows that in Kano State, access to market information rank first and was followed in the second and third places, respectively, by needs for reliable transportation facilities and off-takers.
Table 12 (b): Marketing respondent
Marketing and transportation needs Ranking in: HausaKafin Gwaram MadoriMallam State Access to market information Transportation facilities Off takers 3rd 2nd 1st 1st 2nd 3rd 1st 1st 1st 1st 1st 1st
and transportation needs of the
3.7 Marketing and Transportation Needs of Farmers.
This order of ranking was maintained across the Kano – Jigawa CPZ as shown in Table 12 (c).
Table 12 (a): Marketing and transportation needs of the respondent sorghum farmers in Jigawa State.
Table 12 (c): Marketing and transportation needs of the respondent sorghum farmers in Kano Jigawa SCPZ. Marketing and transportation needs Ranking in: Kano State StateJigawa Kano –Jigawa SCPZ Access to market information Transportation facilities Off-takers 1st 2nd 3rd 1st 1st 1st 1st 2nd 3rd Table 13 (a): Marketing and transportation needs of the respondent rice farmers in Kano State. Marketing and transportation needs Ranking in: Bagwai Bunkure State Access to market information Transportation facilities Off takers 1st 1st 1st 1st 1st 1st 1st 1st 1st Table 13 (b): Marketing and transportation needs of the respondent rice farmers in Jigawa State. Marketing and transportation needs Ranking in: Auyo Miga State Access to market information Transportation facilities Off takers 3rd 1st 1st 3rd 1st 2nd 3rd 1st 2nd Table 13 (c): Marketing and transportation needs of the respondent rice farmers in Kano Jigawa SCPZ. Marketing and transportation needs Ranking in: Kano State StateJigawa Kano Jigawa CPZ Access to market information Transportation facilities Off takers 1st 1st 1st 3rd 1st 2nd 3rd 1st 2nd 206
The fabricators have the following needs: (i) Access to funds which can be provided either as grants or cheap loan to support research and development.
The bulk produce marketers are engaged in buying and selling of various primary agricultural produce such as rice, sorghum, maize, millet, cowpea and groundnuts from neighbouring or distant markets. Their needs (obtained through interviews of 12 marketers, six in each state) are as follows:
3.9. Marketing and Transportation Needs Marketers (Off-takers)
207
(i) High quality paddy rice that is well-dried and free of foreign contaminants, such as chaff and stones.
During the survey, efforts were made to obtain the processing needs of processors of rice and sorghum in the Kano – Jigawa SCPZ. In this respect, a total of 11 processors were interviewed.Theresults showed that the crop processors have the following main needs:
(i) Access to cheap capital that is provided interest-free or at low interest.
3.8. Processing Needs of Processors in the Kano – Jigawa SCPZ.
(ii) Good road infrastructure through construction of new, motorable access road and sustainable rehabilitation of dilapidated existing road networks, which should be motorable year – round.
(ii) Patronage of their products by all levels of government, development agencies and the general public.
3.10. Needs of Fabricators
(iii) Linkage of marketers to banks by the government to reduce difficulty of getting bank loans and the need for unaffordable collaterals.
(ii) Access to credit: Several processors would like to have access to low-interest loans (less than 10% interest). Other processors would only take interest-free loans because their religious belief is against paying interest on loans.
(iii) Access to modern processing machines. These include dryers which should be provided, by government or development agencies, at farm level to enable farmers dry their produce to recommended moisture content, thereby minimizing storage losses. Other modern processing machines (threshers, parboilers and millers) should be provided at subsidized rates to small and medium scale processors.
During the survey, the needs of fabricators were obtained through interviewing 11 fabricators of agricultural equipment. Five and six fabricators were located in Kano and Jigawa States, respectively The equipment fabricated locally by the fabricators include: par-boiler, dryers, threshers, and destoners.
The needs of agro-input dealers were ascertained by interviewing 12 dealers (six located in Kano and six located in Jigawa). These dealers bulk-buy and then sell several products to farmers, including improved seeds, fertilizers, pesticides (insecticides, herbicides and fungicides), and agricultural equipment such as crop spraying equipment, threshers and cultivators.
(iii) Supportive government policies that will prohibit importation of equipment that can be fabricated and mass – produced in Nigeria. Needs of Agro-input Dealers
The major need of the agro-input dealers is access to capital to fund their operations, such as timely purchase of inputs, maintenance of infrastructure and timely payment of staff salaries. Some dealers stated that they need training in business management.
3.11.
208
NATIONAL OFFICE No. 15, Lord Luggard Street, Asokoro, Abuja FCT, Nigeria info@atasp1.gov.ng,08137208947,atasp1_hq@atasp1.gov.ng08036551491www.atasp1.gov.ng P r i n t e d @ 0 8 0 3 7 5 6 6 6 2 9 BIDA-BADEGGI SCPZ KANO JIGAWA SCPZ KEBBI SOKOTO SCPZ ADANI-OMOR ZONE: Emeke Nwosu Street Abuja Estate, Opposite FMARD, Govt House, Enugu -Onitsha Exp Way, Awka, Anambra adaniomor@gmail.c07081037456State.om Farm MinisInstitute,tryofAgriculture and Rural Development, KM 12, Bida-Lemu Express way, Bida, Niger mail2man08056039015State.ta@yahoo.com No. 9, Ahmadu Bello Way, Servicom Center, Kano, Kano 08036923665,State. 08052683453 aadoshehu@yahoo.com 1st Floor Akoko Plaza, Opp. New Central Bank Building, Emir Haruna Road. Birnin-Kebbi, Kebbi State. aliyuaddaji@y07036496038.ahoo.com ZONAL OFFICES


