

INTRODUCTION

Harnessing wind for sailing is a story as old as seafaring itself. With the advent of technological advancements in the 19th century, wind took a backseat as the main source of ship propulsion in favor of coal, and subsequently, oil, after the boom in internal combustion engines’ research and production.
While the ship propulsion paradigm remains essentially unchanged in many decades, the context in which it exists has largely evolved. The International Maritime Organization (IMO) has set ambitious targets related to climate actions, aiming to achieve net-zero emissions by 2050.
As the world focuses on the urgent need to mitigate climate change, the shipping industry is under increasing pressure to decarbonize. Among solutions being explored to improve the energy and environmental efficiency of sea-going vessels, the adoption of wind propulsion technologies (WPT) presents itself as technically feasible and environmentally viable.
These systems, harnessing the power of the wind much like the sailing ships of old, offer a promising and sustainable solution. With recent advancements in technology and design, coupled with a regulatory and societal push towards greener alternatives, the adoption of WPT is poised to play a pivotal role during the intermediate stage of shipping’s decarbonization path, before the widespread adoption of green, carbon-free fuels.
SECTION 1.1
Overview of Wind Propulsion Technologies
Many of the major shipping routes are characterized by strong and consistent winds [1].
It has been reported that harnessing wind can reduce ship propulsion–induced emissions by 10–20 percent, assuming no operational changes.
Considering voyage changes (“chasing the wind”) and ships tailored to utilizing wind for propulsion by design, emissions can be further slashed.
These favorable wind conditions, combined with recent years’ decarbonization goals, as well as geopolitical events which can potentially largely affect the price of oil, has prompted the interest from the shipping industry to explore WPT.
Perhaps the most important development in the field of WPT in modern times is the conceptualization of the Flettner rotor, named after the German innovator Anton Flettner in the 1920s. The Flettner rotor, as it is usually called, is a cylinder fitted above the vessel’s waterline which rotates around its axis of symmetry to create forces by virtue of the Magnus effect. This phenomenon is also responsible for the ball curving in many sports. Despite successful demonstrations — the vessel Buckau sailed the Atlantic with Flettner rotors operating in 1926 — the Flettner rotor did not take off; it was hampered by high capital costs and low bunker prices. However, with rising bunker prices and ambitious environmental goals, the industry’s interest in the untapped potential of the wind, as a limitless and sustainable resource has been rekindled, setting the stage for widespread WPT adoption.
Companies have emerged providing WPT solutions for sea-going vessels and have developed rotors, suction and rigid wing sails and kites that harness the power of wind to assist in thrust production.
FUNDAMENTALS OF WIND PROPULSION TECHNOLOGIES
SECTION 2.1
Basic Principles of Wind Assisted Ship
Propulsion
Wind-assisted propulsion is achieved by exploiting the wind encountered by a vessel during sailing so that a force component parallel to the vessel’s longitudinal dimension is produced. The details of the exploitation mechanism depend on the specifics of the system utilized; for example, Flettner rotors employ the Magnus effect to produce a force perpendicular to the apparent wind stream by rotating at optimally set revolutions that maximize the thrust force with minimal produced drag. Sails, on the other hand, operate in a way resembling the wings of an airplane; by adjusting their angle with respect to the apparent wind stream, the equivalent of a lift force is produced which pushes the vessel.
In general, the principle is to produce a force aligned with the vessel’s heading direction. In this way the vessel is partially (or, in extreme cases, wholly) propelled by this force. Thus, the vessel can either achieve the same speed while reducing the power produced by the main engine (M/E) or increase its speed while maintaining constant main engine power.
Resultant Aerodynamic Force
Magnus Force
Figure 1: Sketch of magnus force.
Figure 2: Aerodynamic lift generated from an airfoil.
SECTION 2.2
Types of Wind Propulsion Technologies (WPT)
The WPT presented below are those which, according to the existing literature, present themselves as promising solutions for windassisted propulsion, and are already being either developed or provided to the market by technology vendors for typical ocean-going vessels.
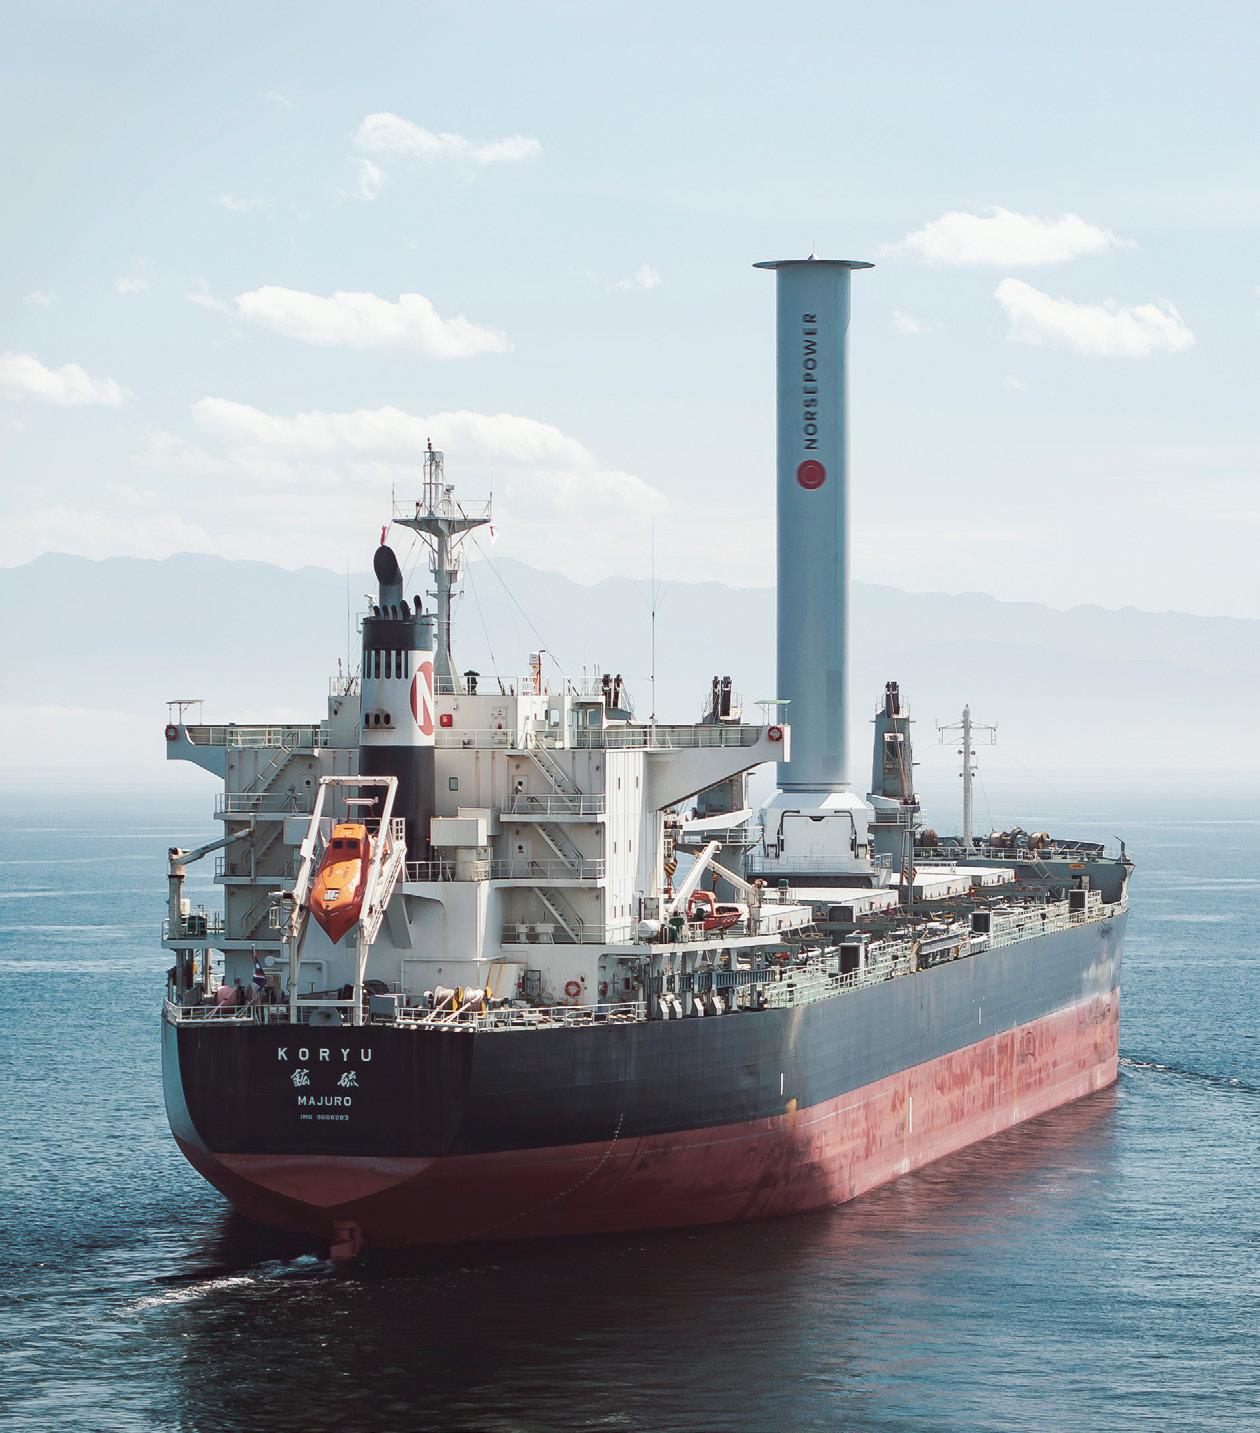
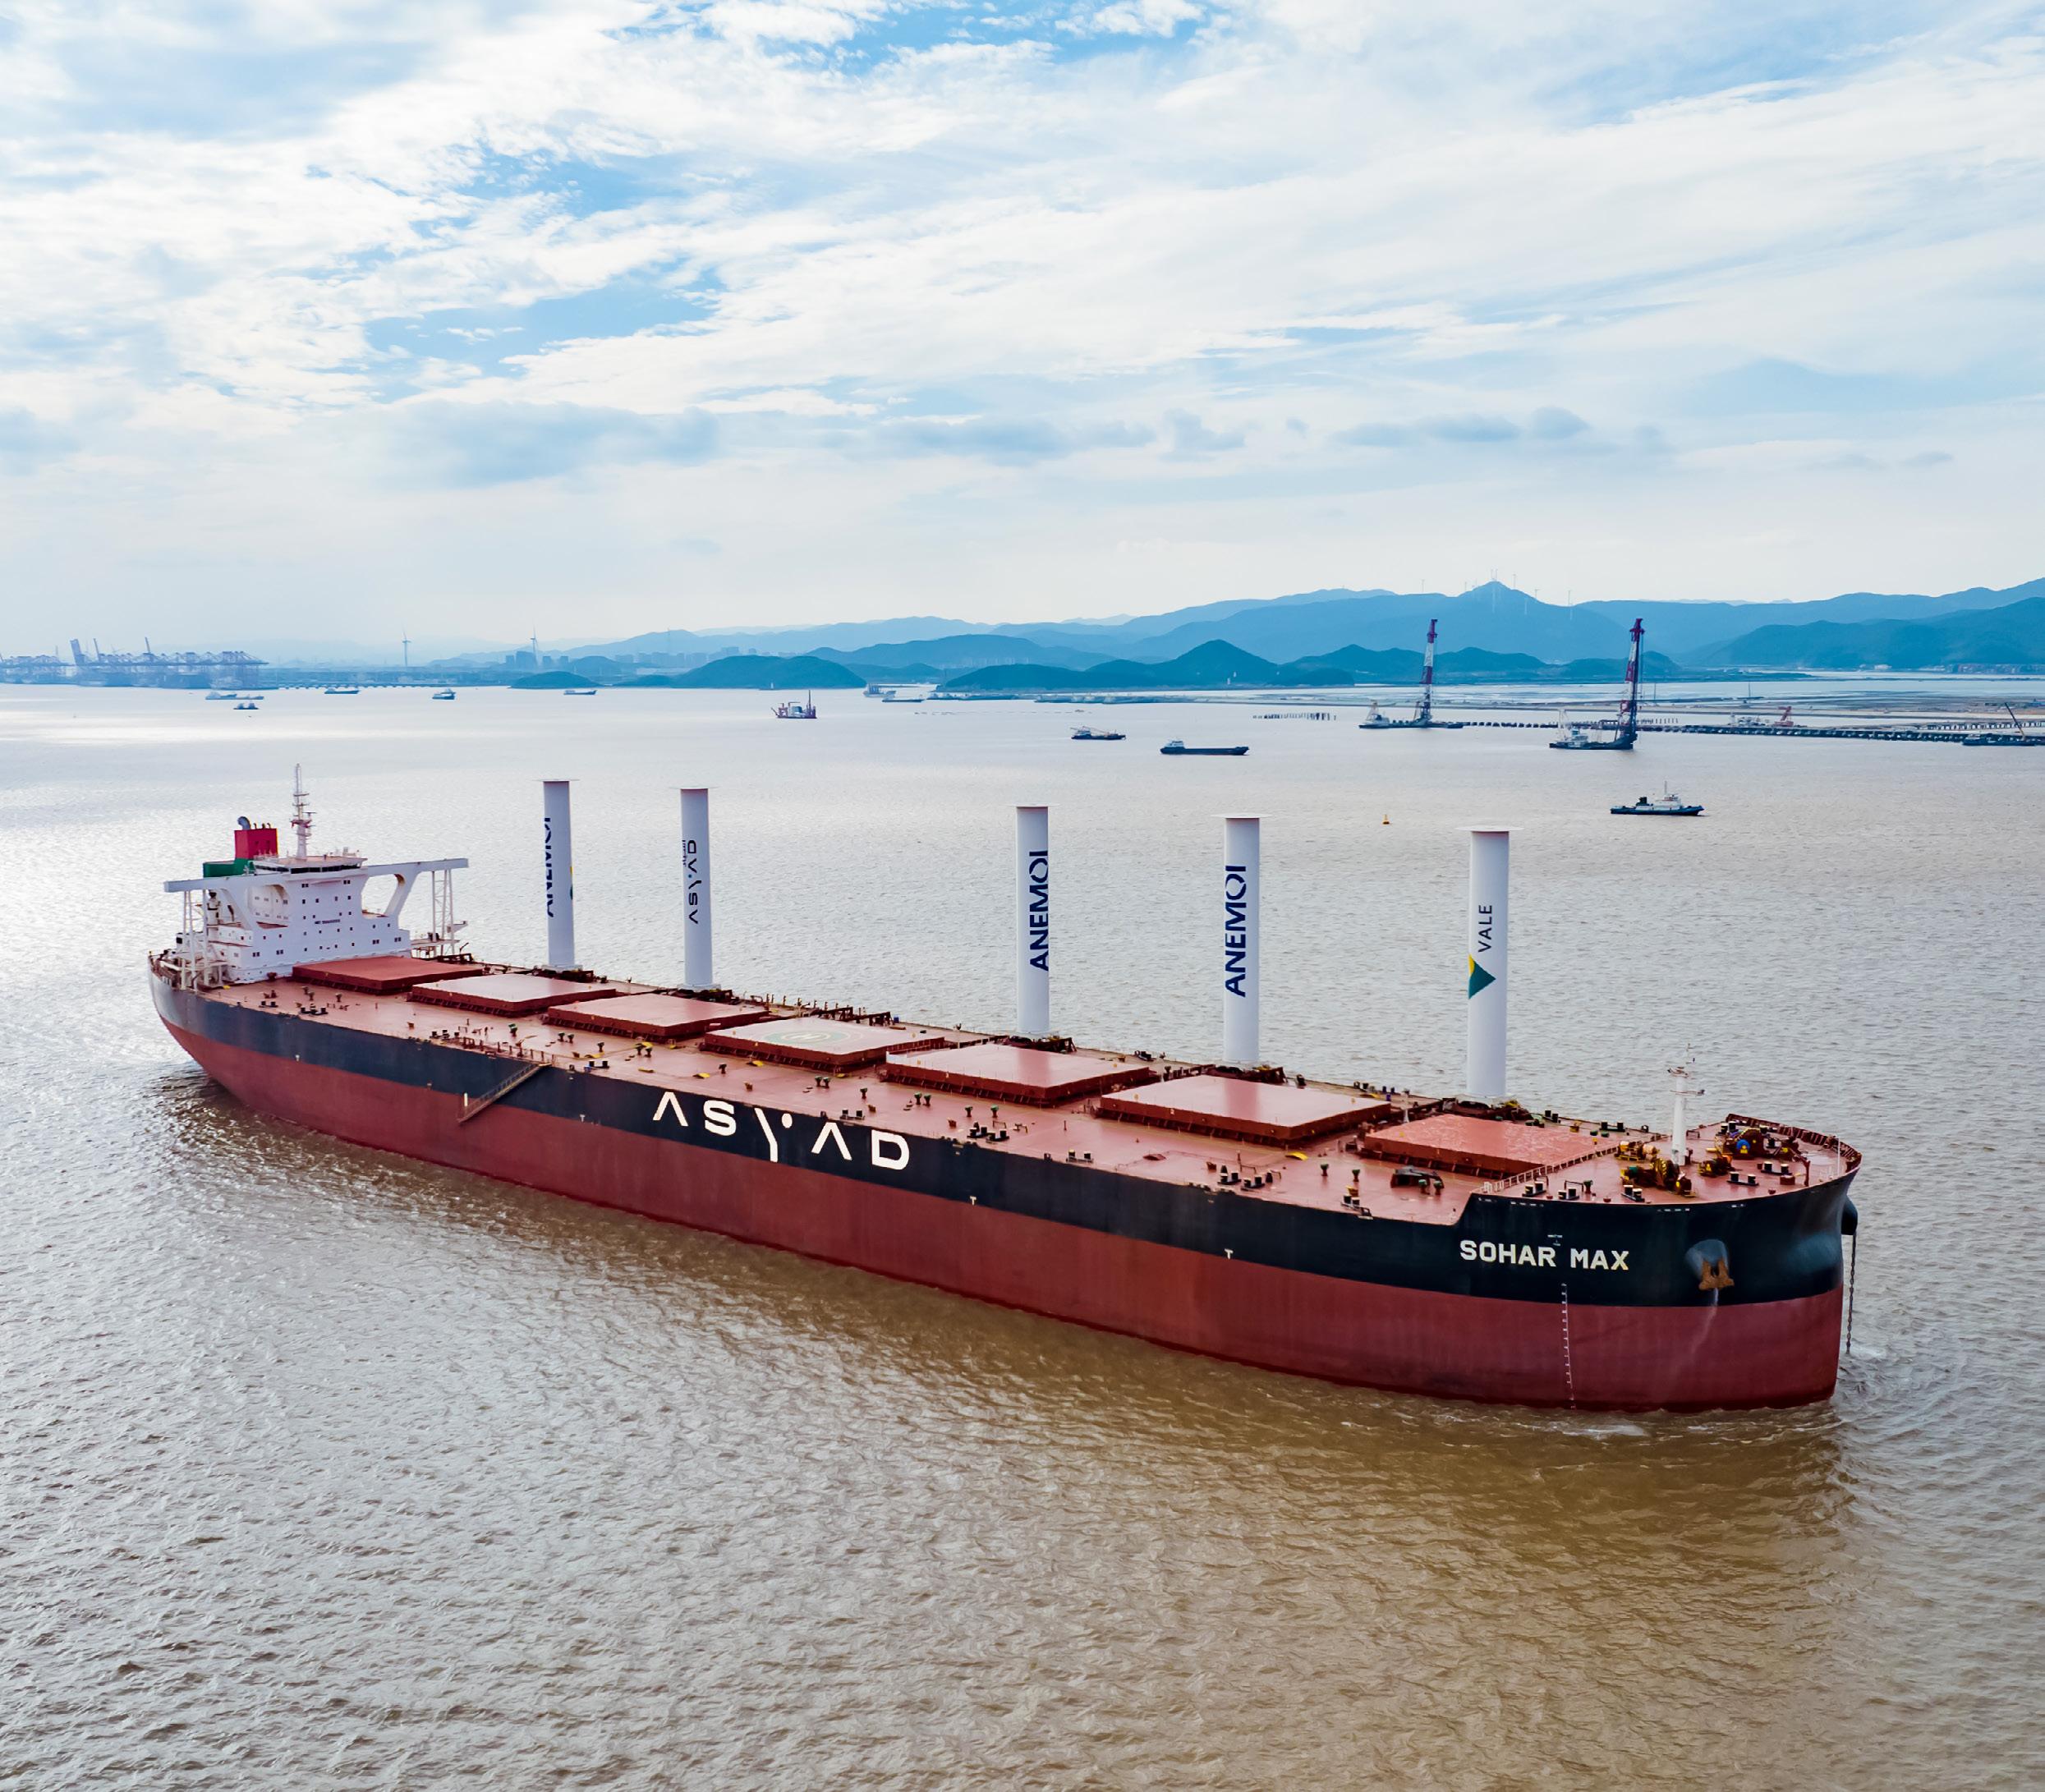
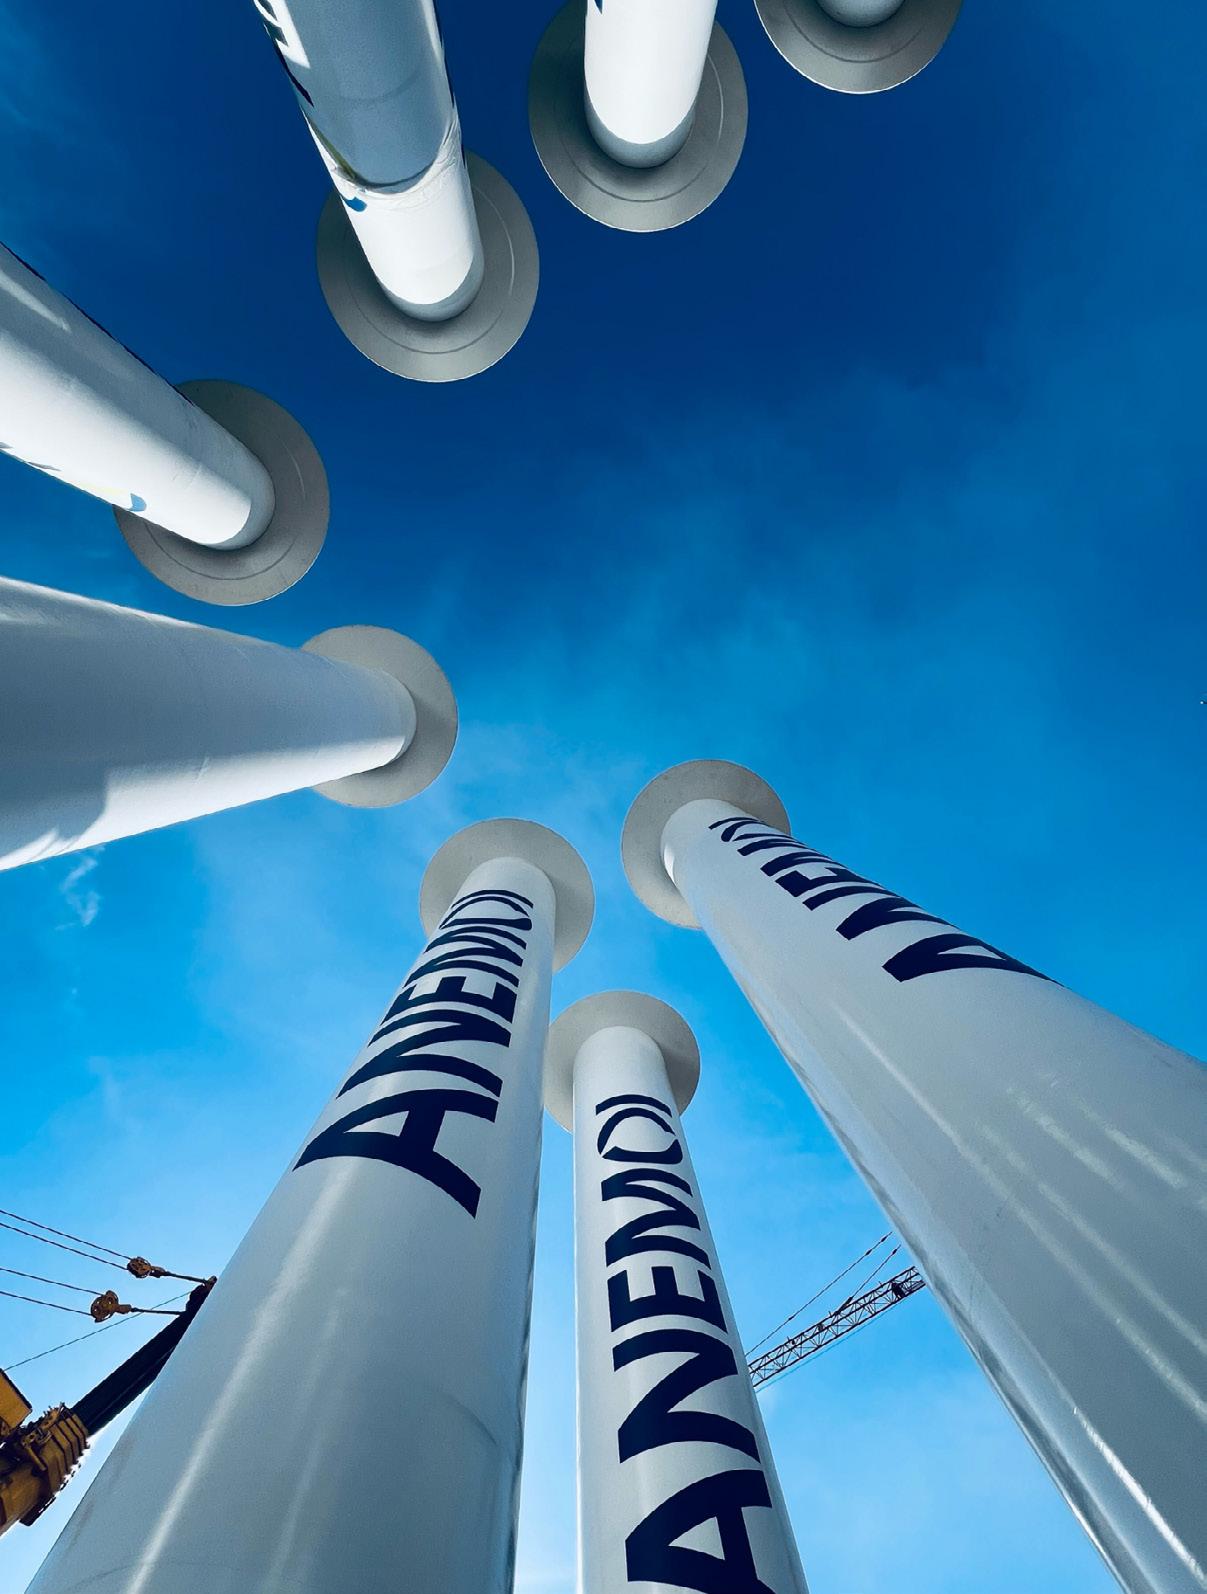
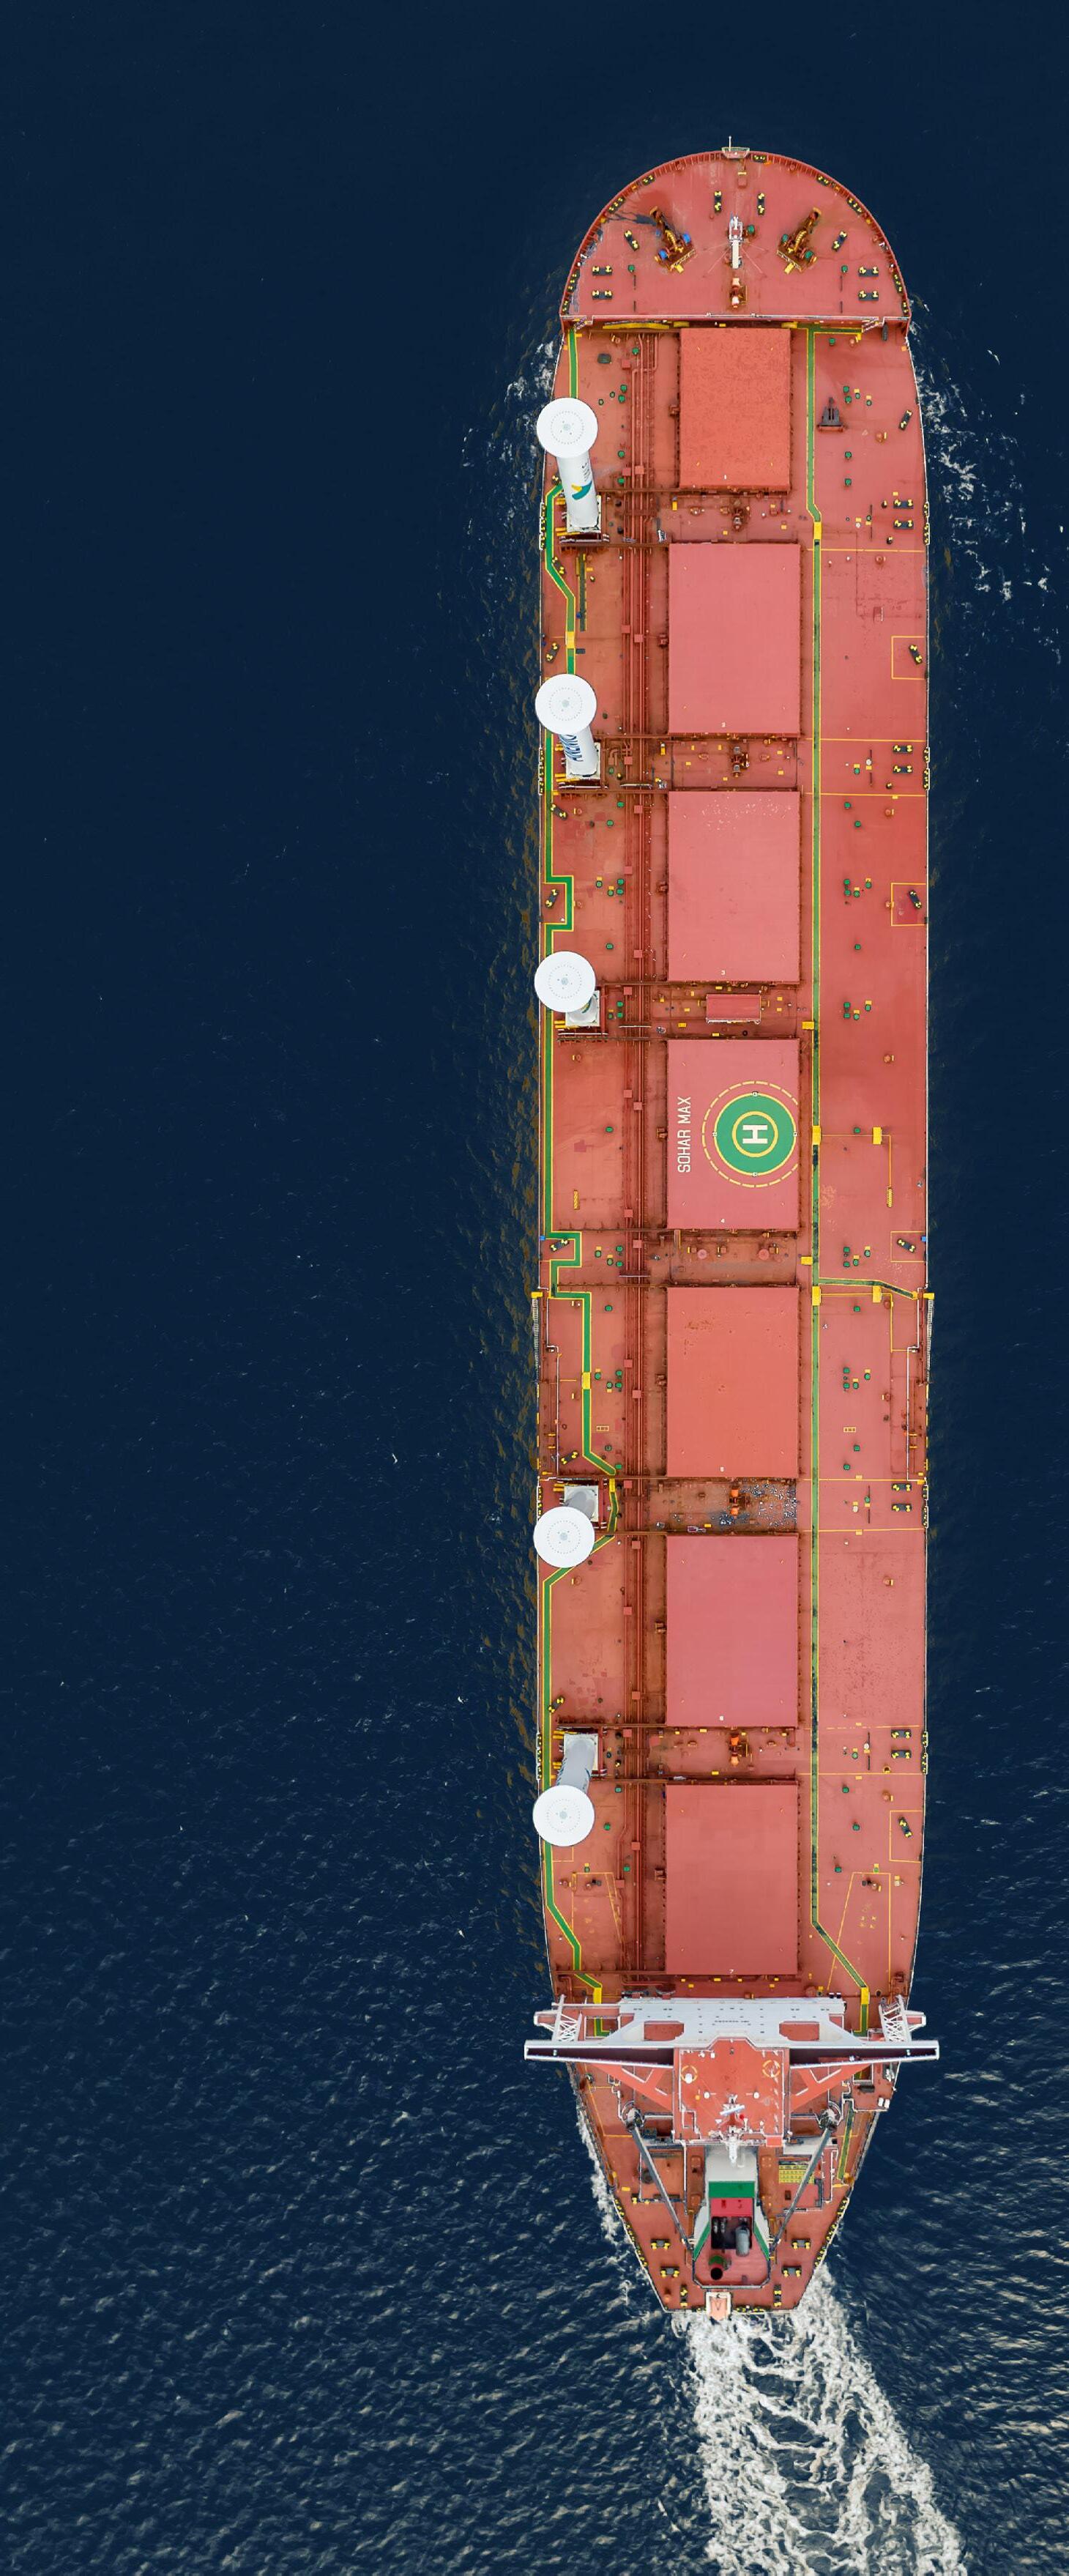
2.2.1 Flettner Rotors
Named after the German aviation engineer Anton Flettner, they are mechanically operated cylinders, installed vertically on a ship’s deck. These rotors rotate via motor-driven mechanisms, generating lift through the Magnus effect. The resulting lift force is perpendicular to the apparent wind velocity, due to the circulation generated by the boundary layer created by virtue of the rotor’s rotation. Hence, at apparent wind velocities which are on the port or starboard side of the ship, the lift produced by the rotation has a substantial component towards the vessel’s longitudinal axis, which effectively provides thrust.
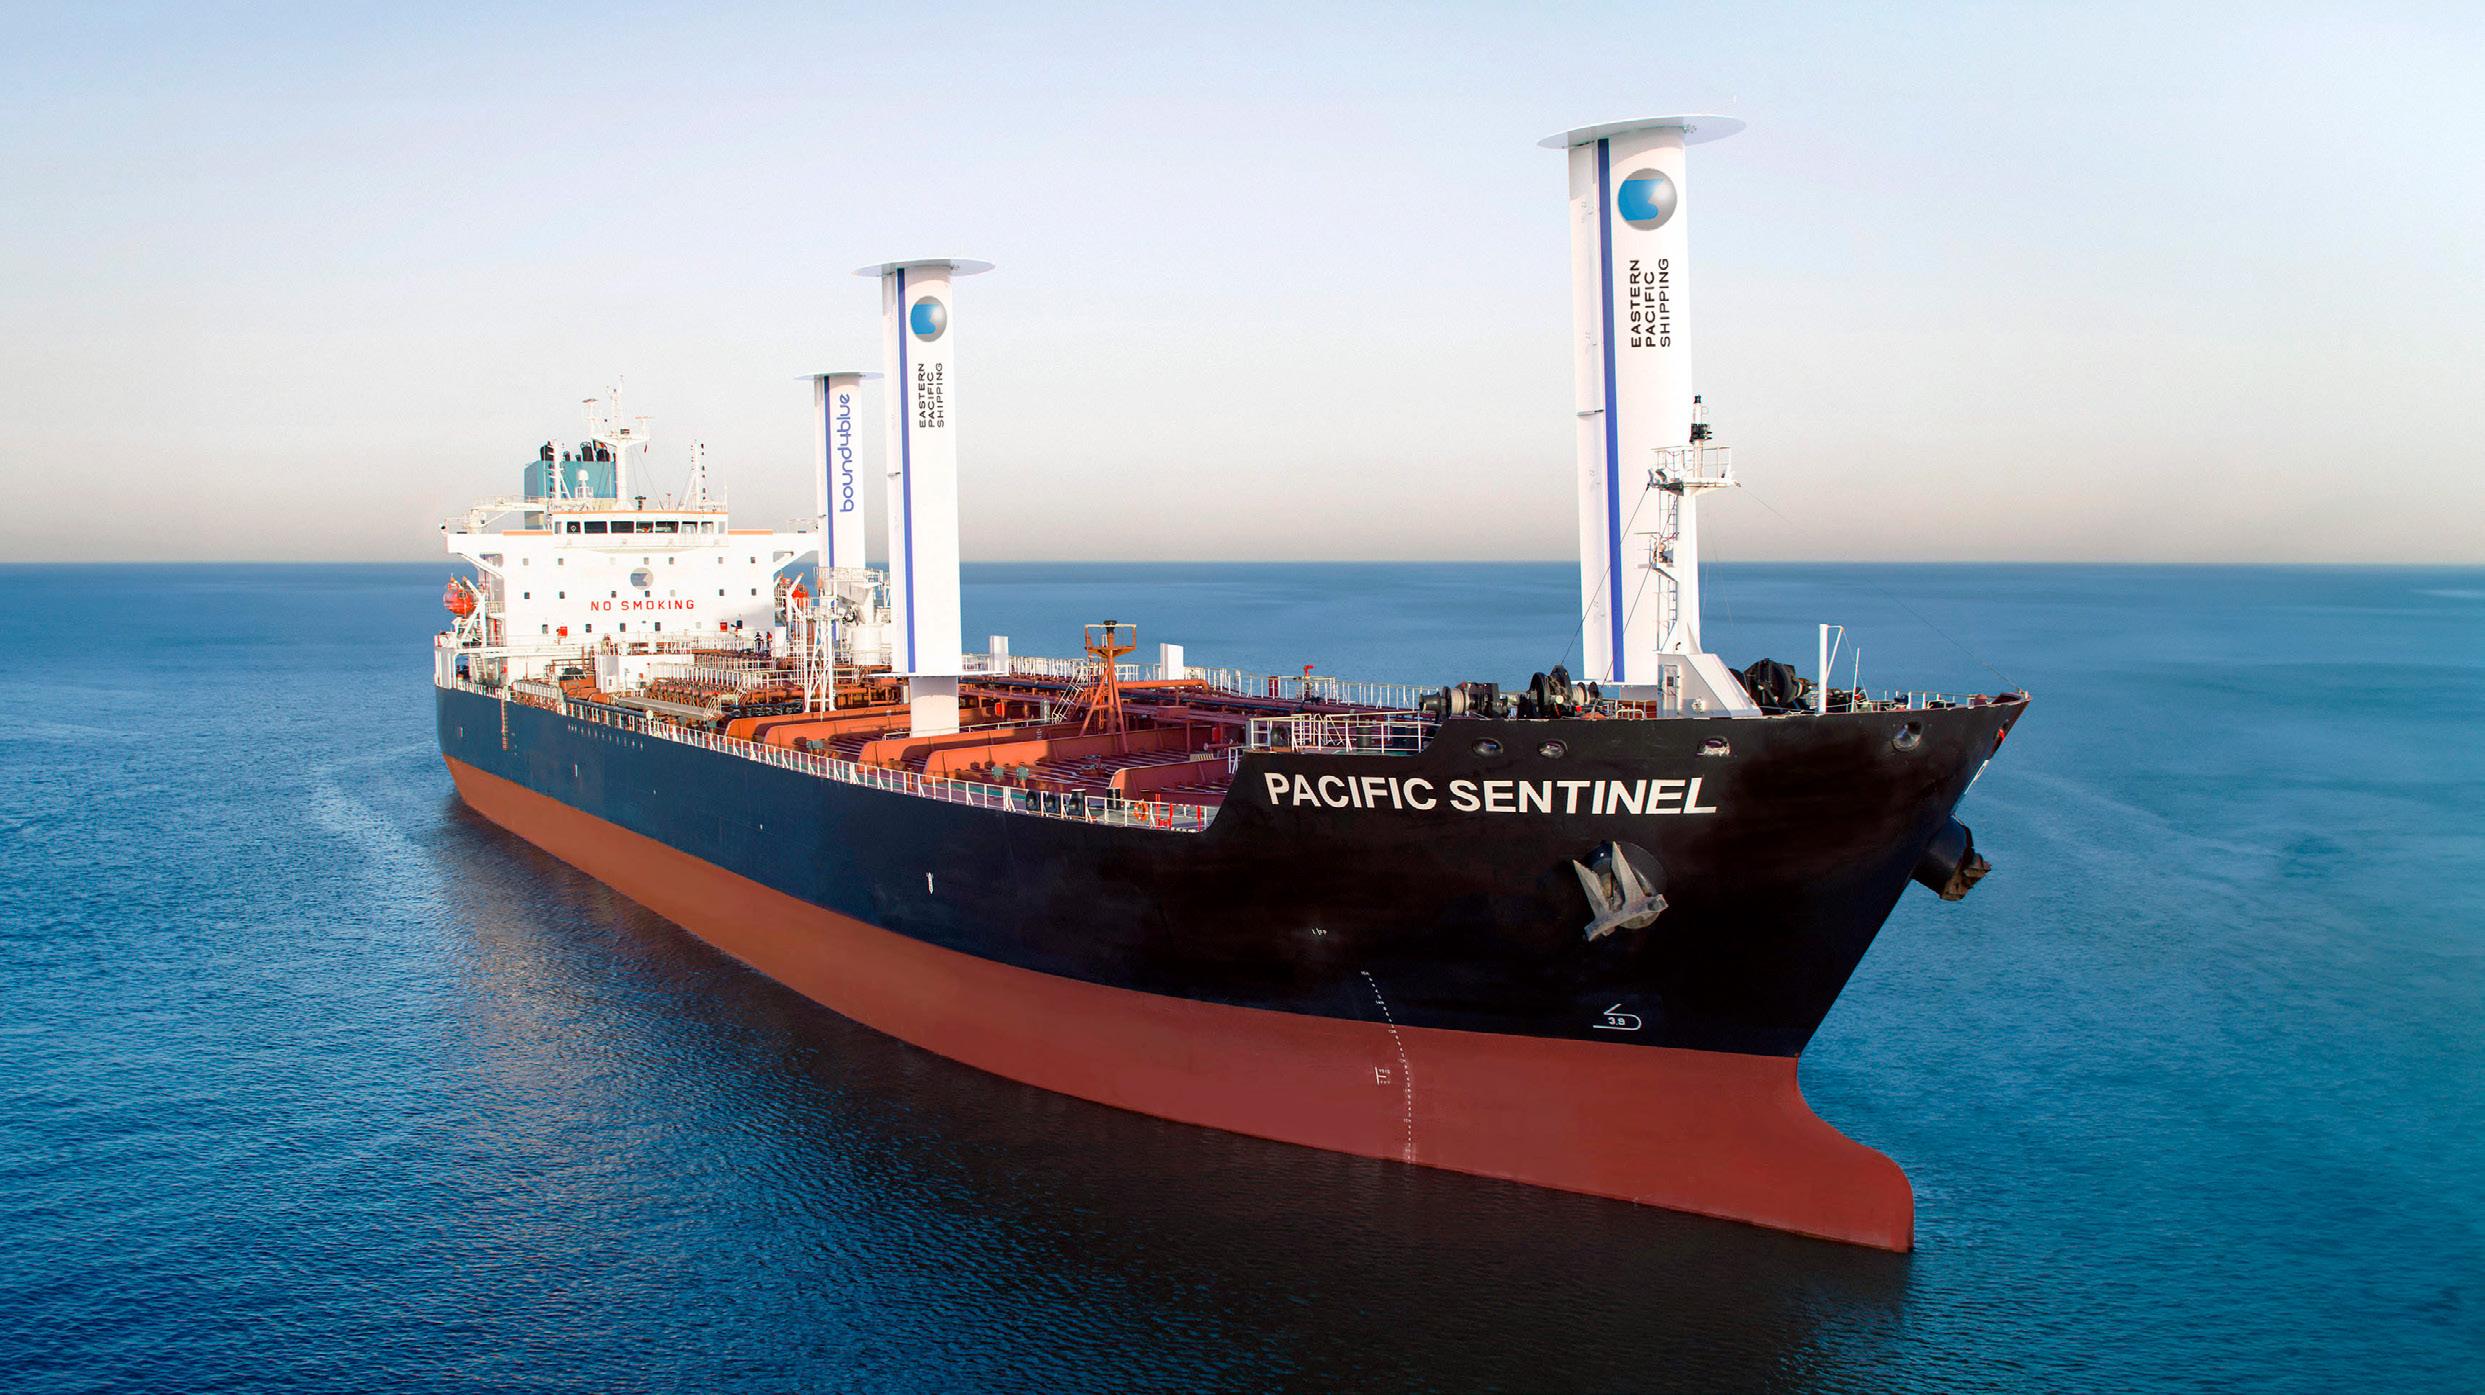
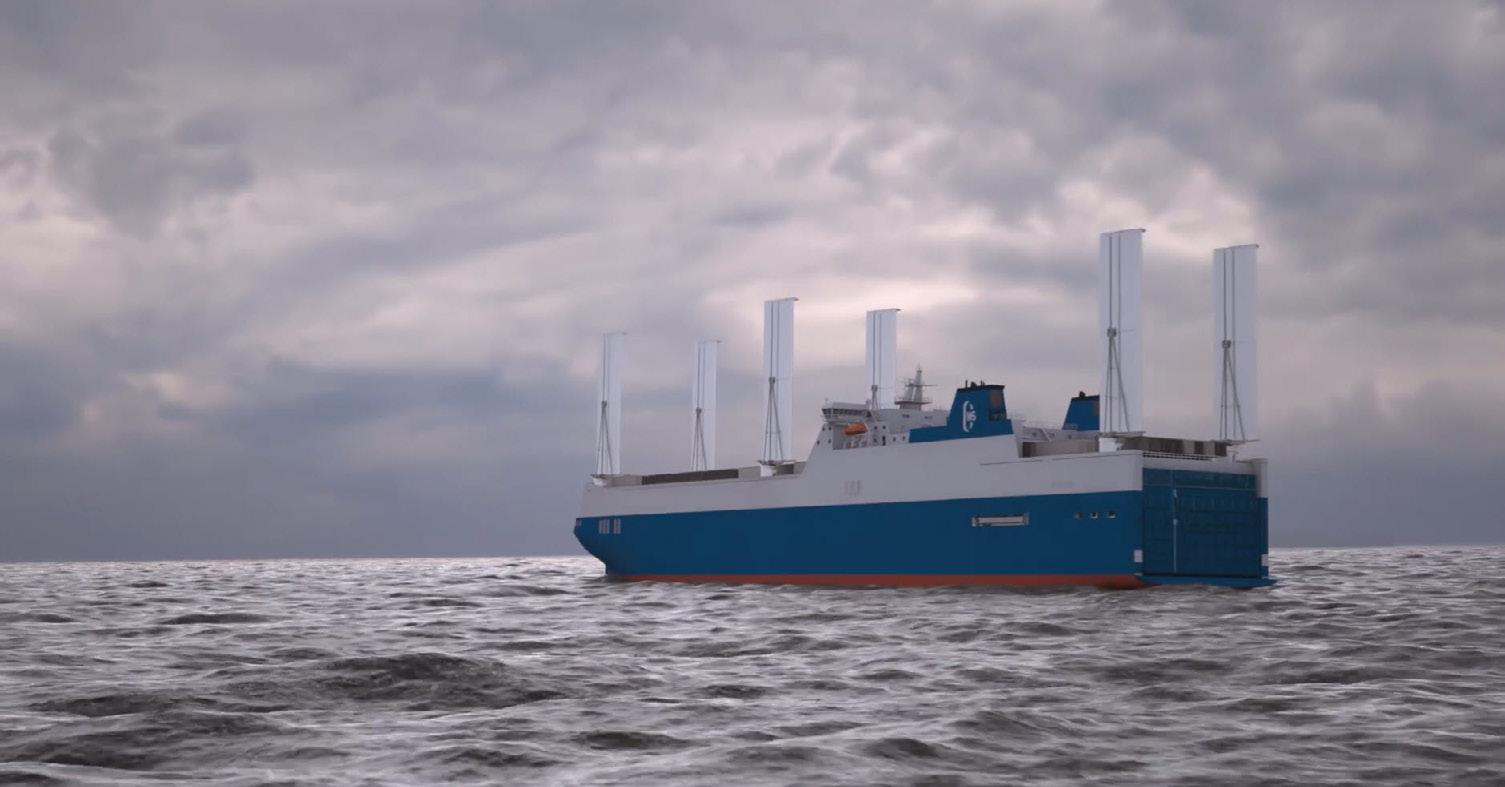
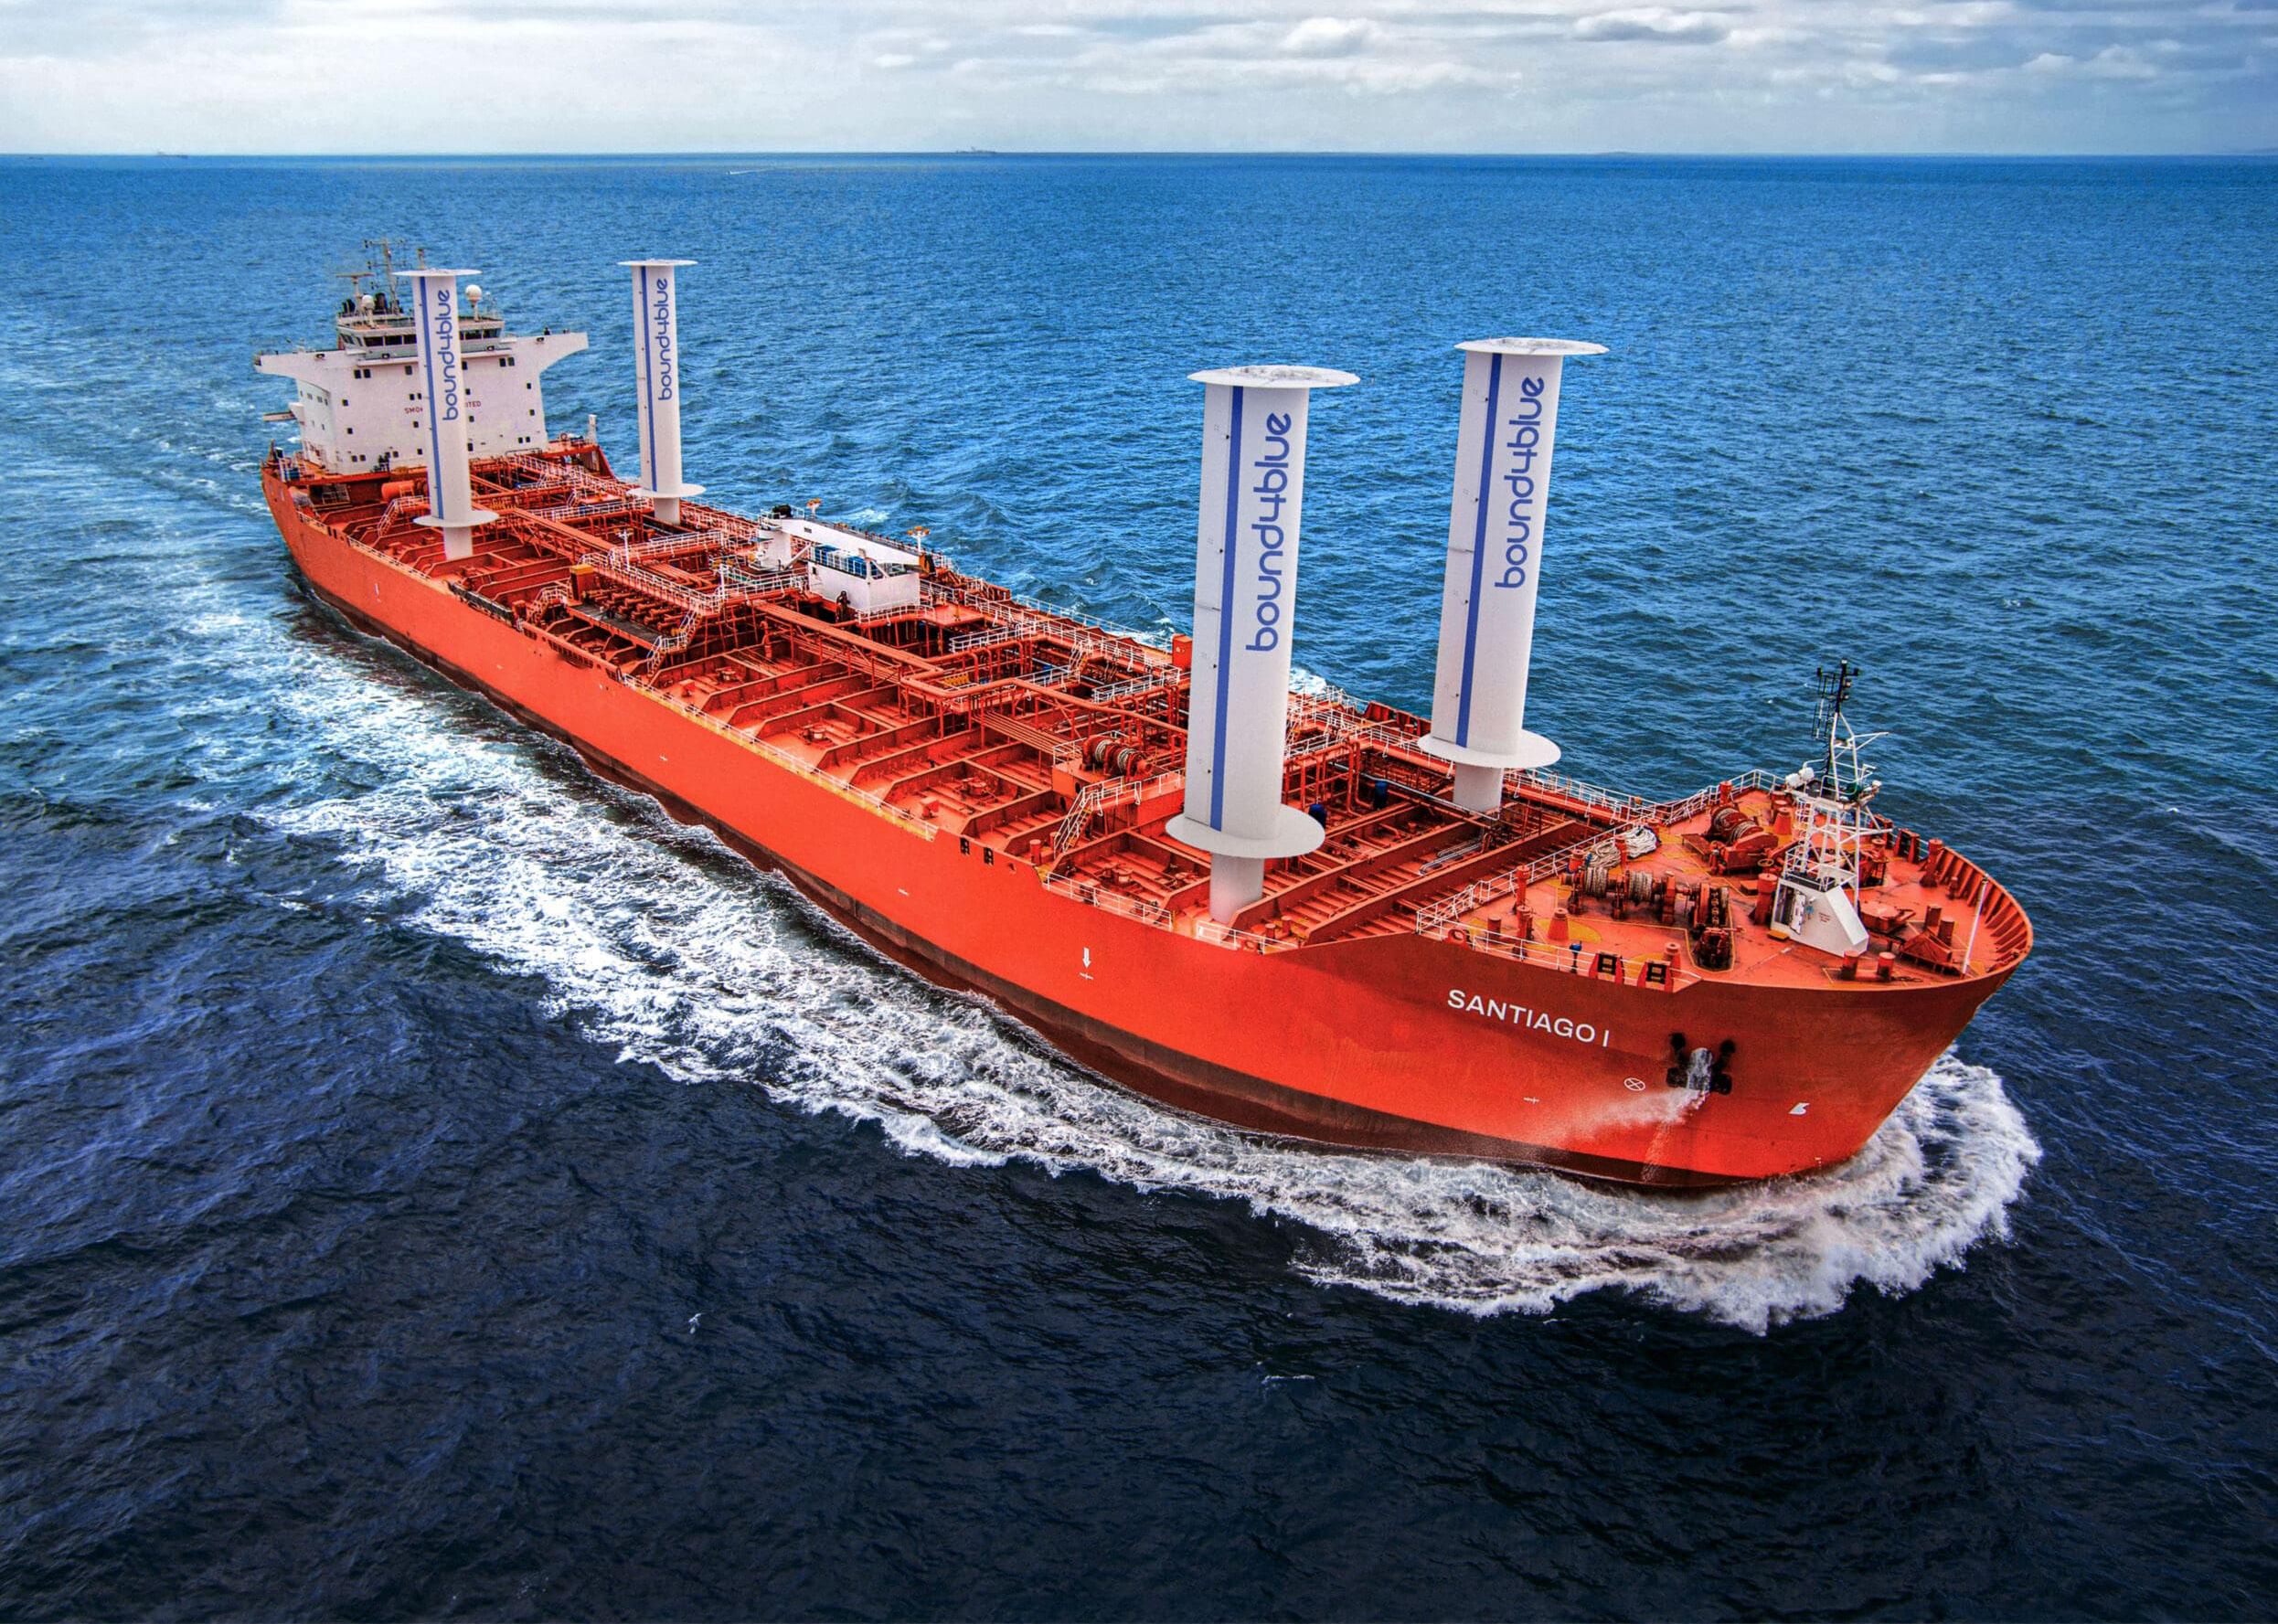
2.2.2 Wing Sails
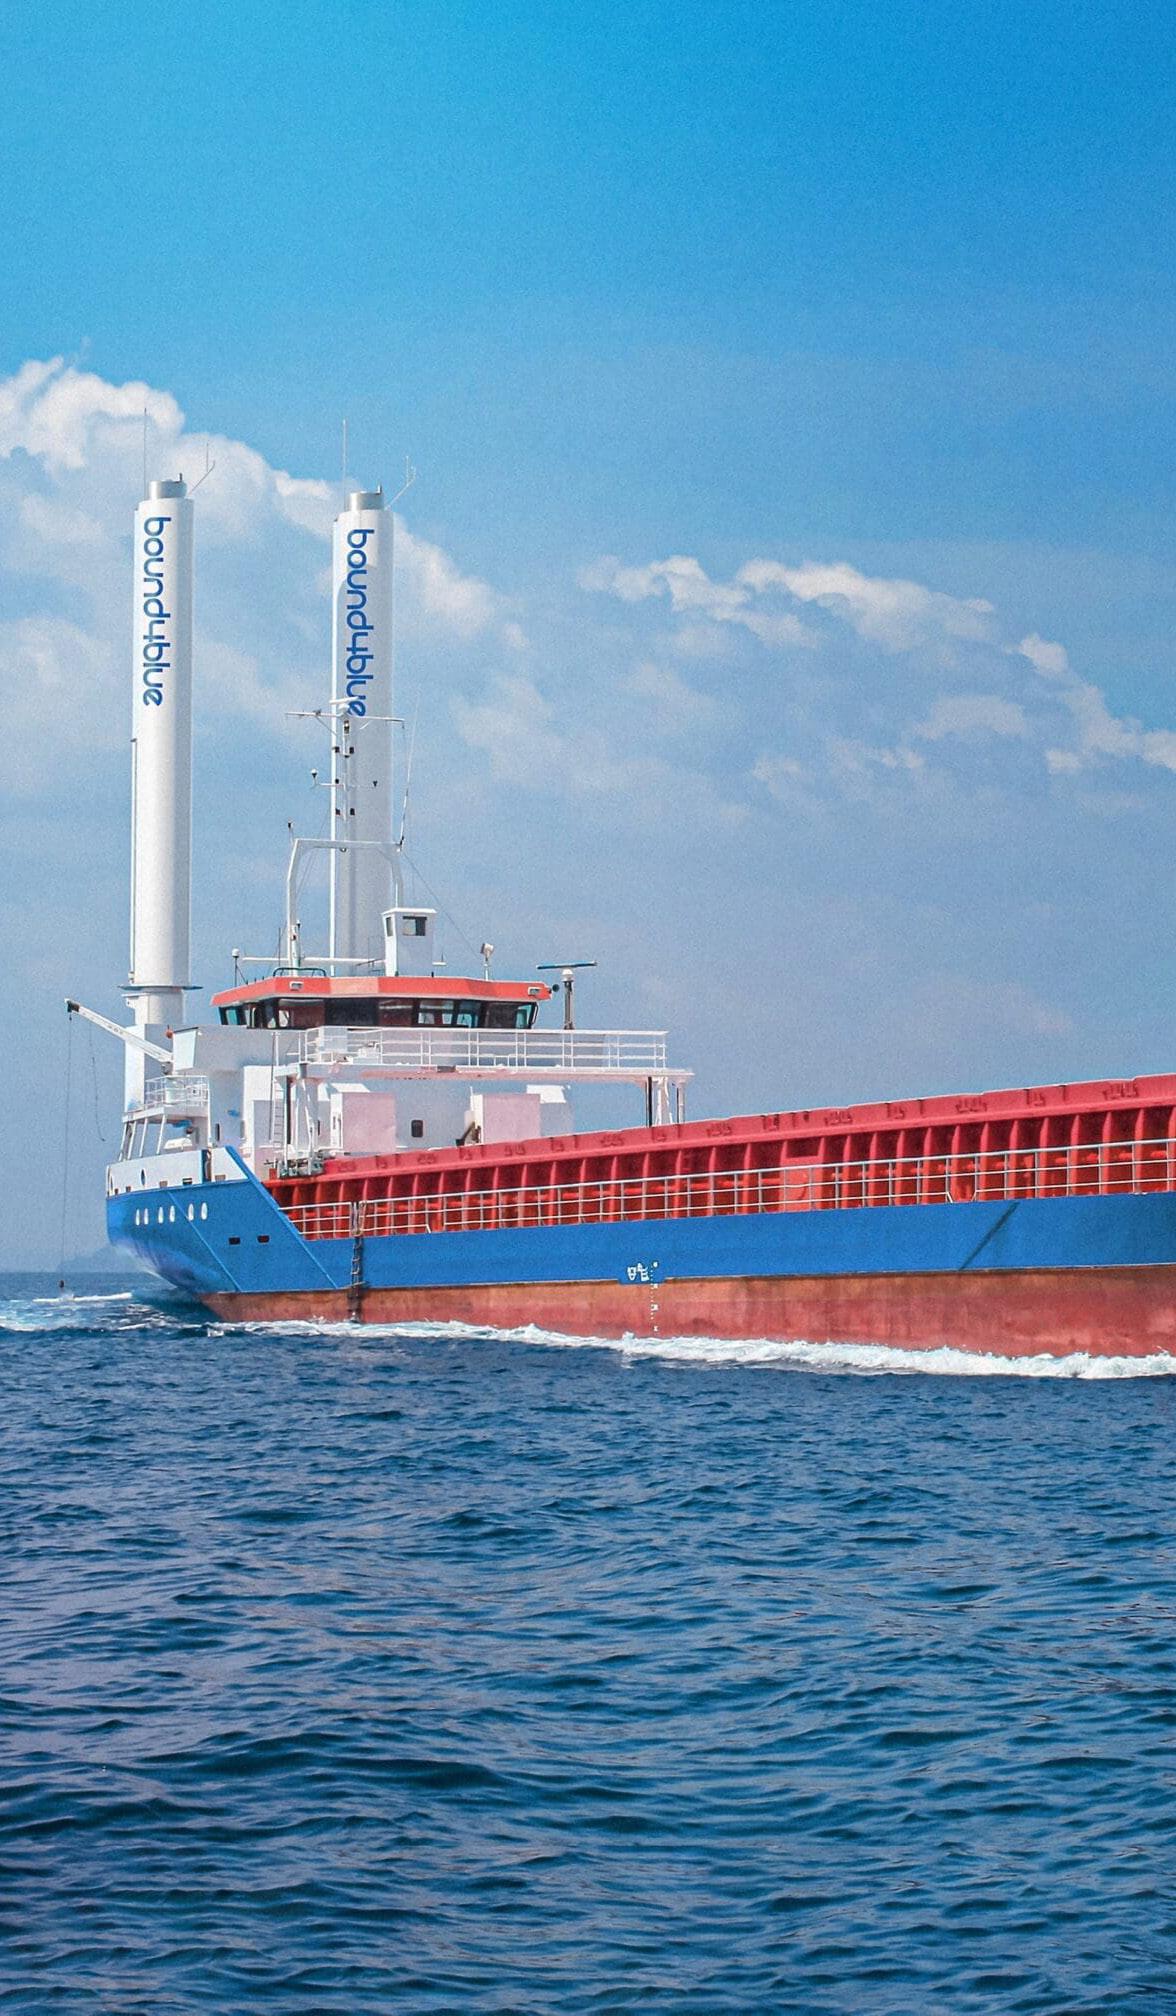
Rigid wing sails operate on the same aerodynamic principle as aircraft wings. They are adjusted to exploit the prevailing wind conditions, producing a lift force which, if properly aligned with the ship’s trajectory, provides part of the necessary thrust to propel it. They are installed on the ship’s deck on high masts and are free to rotate 360° to properly align with the wind and thus maximize the produced lift force. The angle of attack is automatically adjusted using equipment that measures wind speed and direction. Their cross-sectional profile usually resembles that of a cambered airfoil that intensifies the pressure differential between the two sides of the sail. When not in use, they can be reefed through a connection to a telescopic spar mechanism.
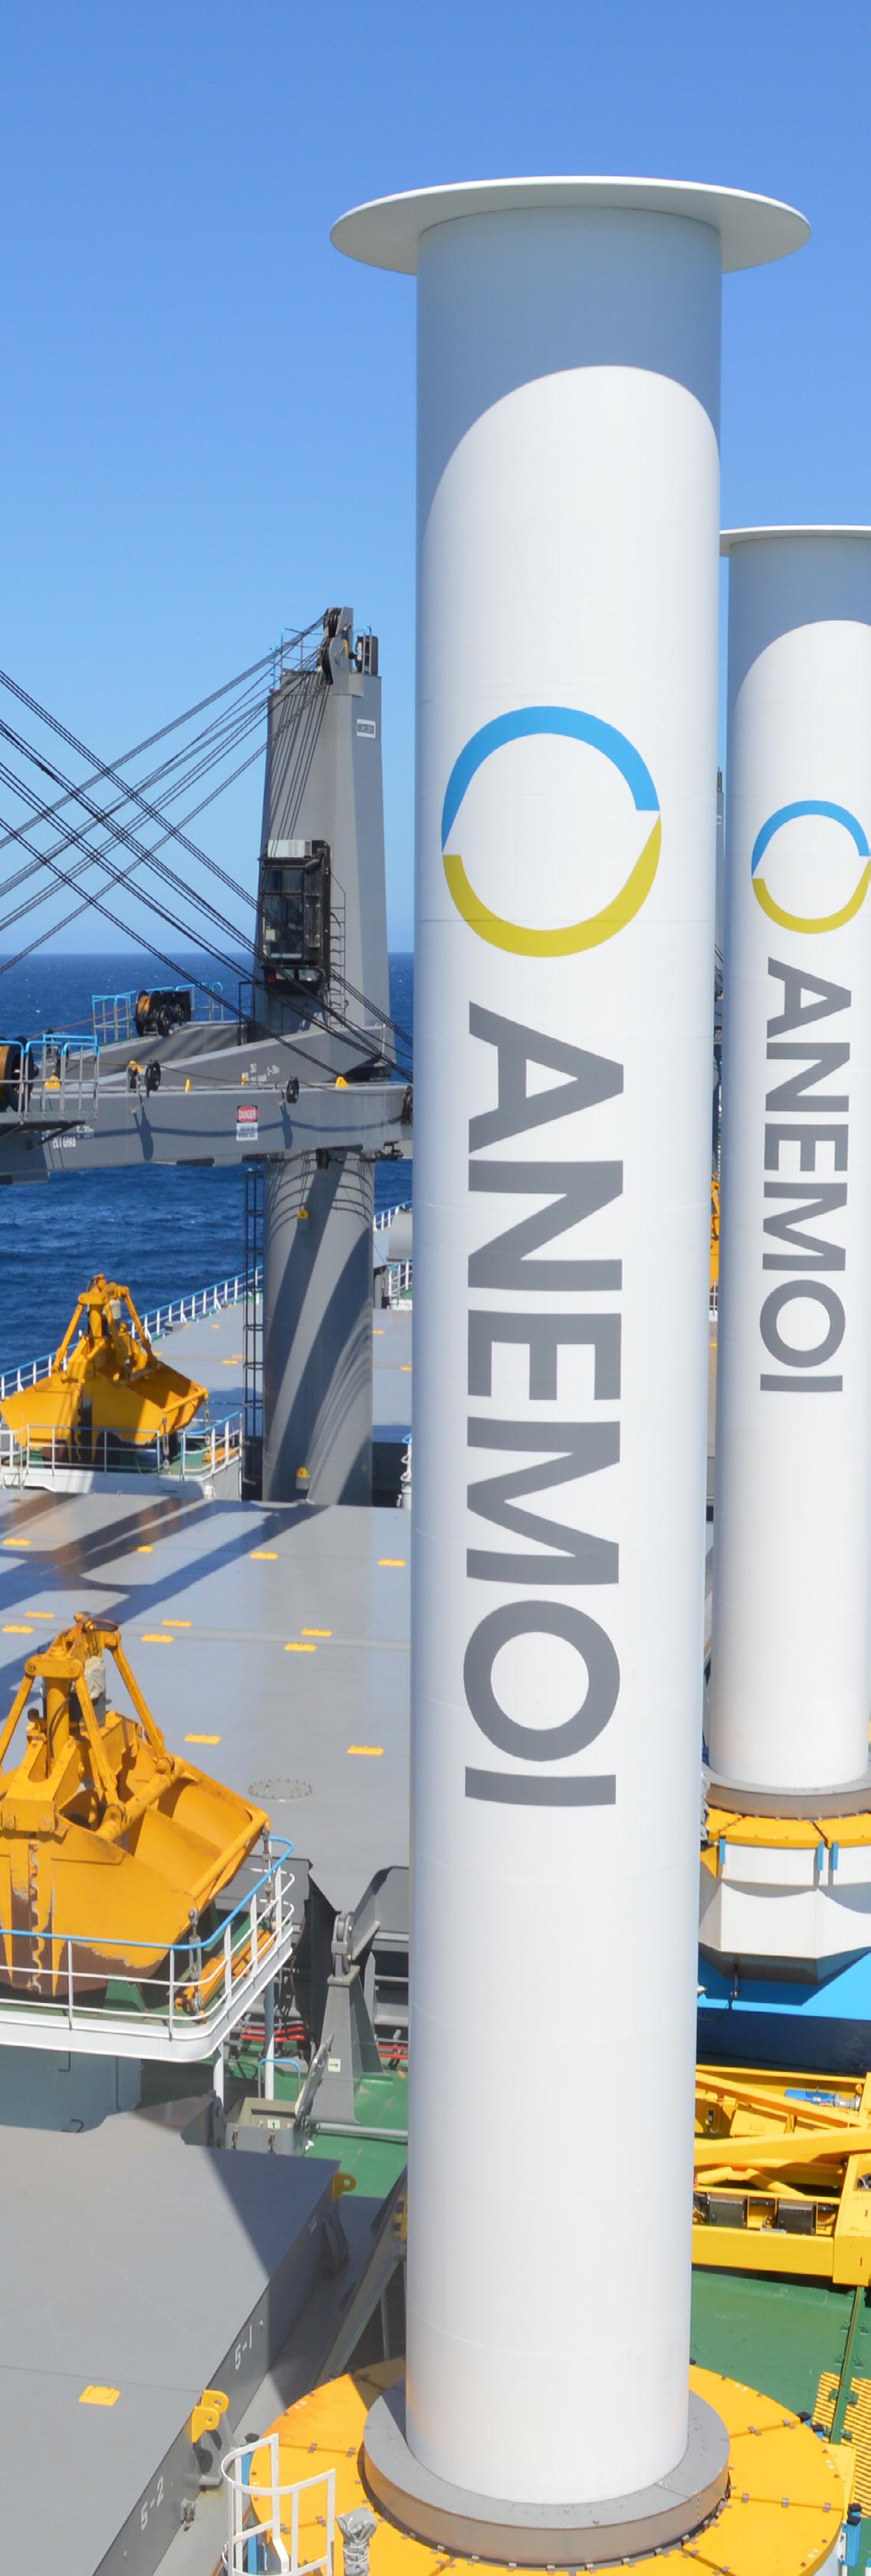
Figure 3: Rotor sail.
Soft wing sails are similar to rigid wing sails; however, they do not have a rigid coverage surface material but are made of flexible material. This allows furling and adjusting of the variable camber of the wing profile possible. Like rigid wing sails, soft wing sails’ operation is fully automatic.
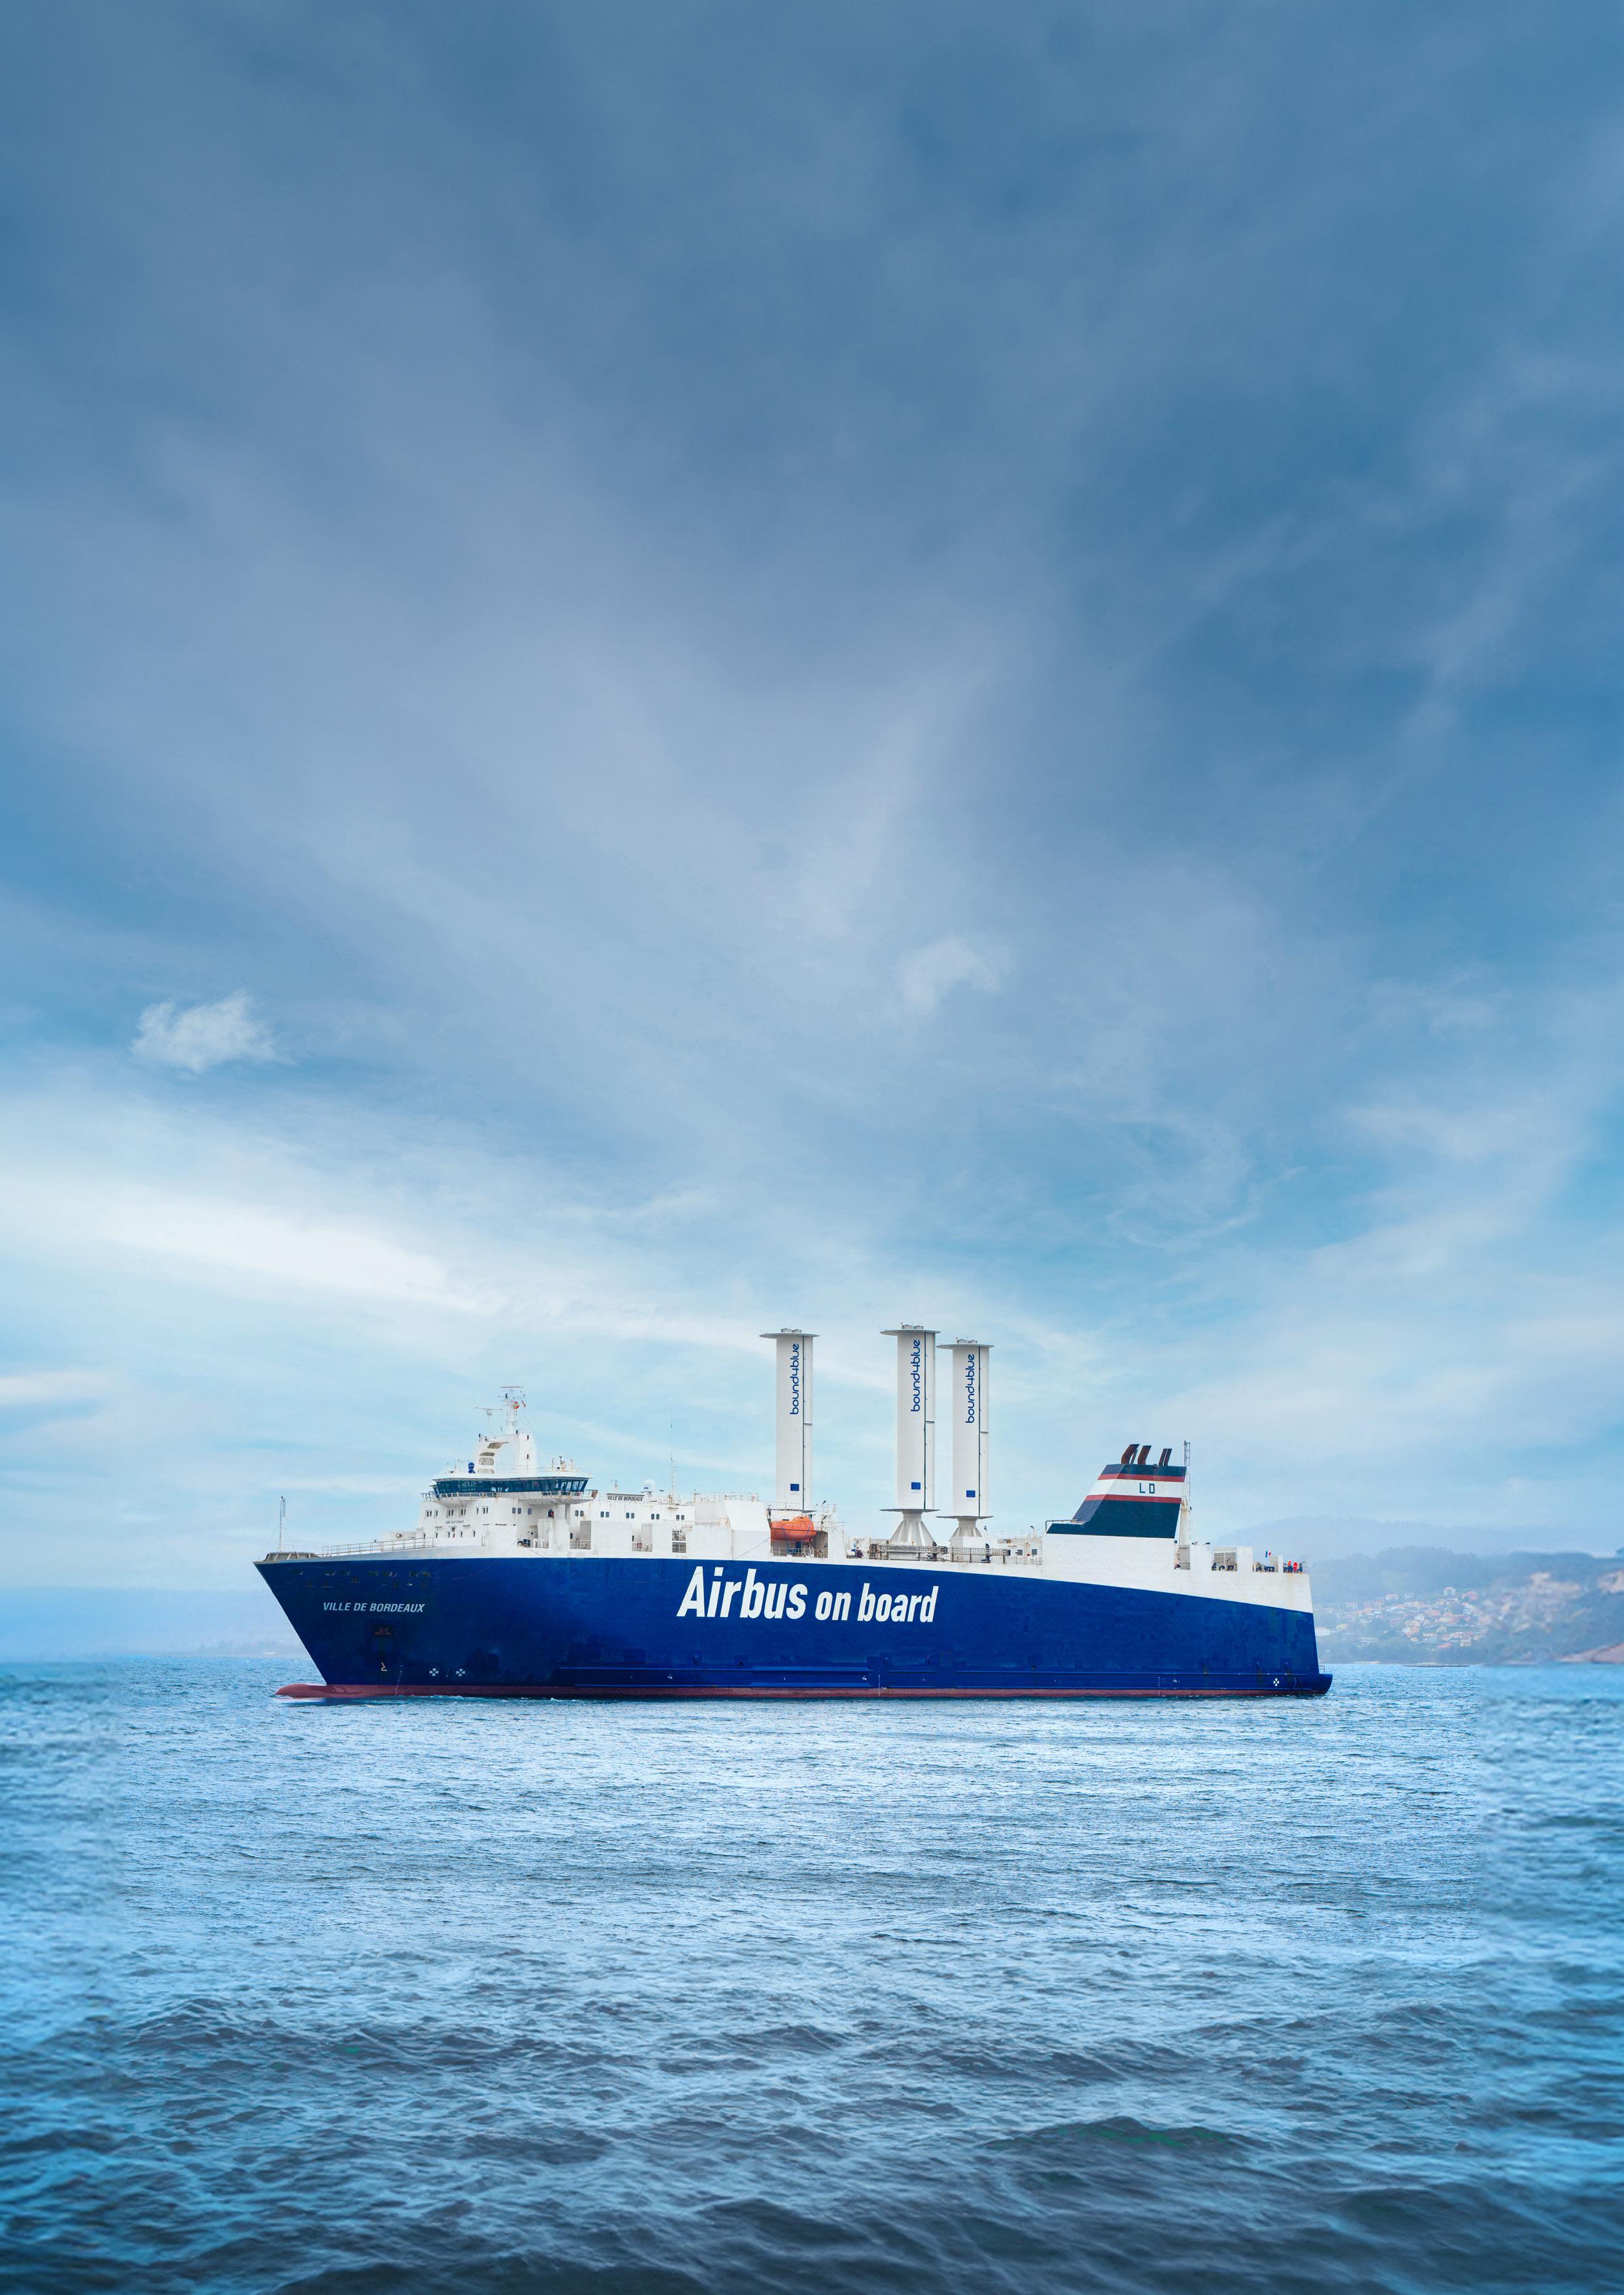
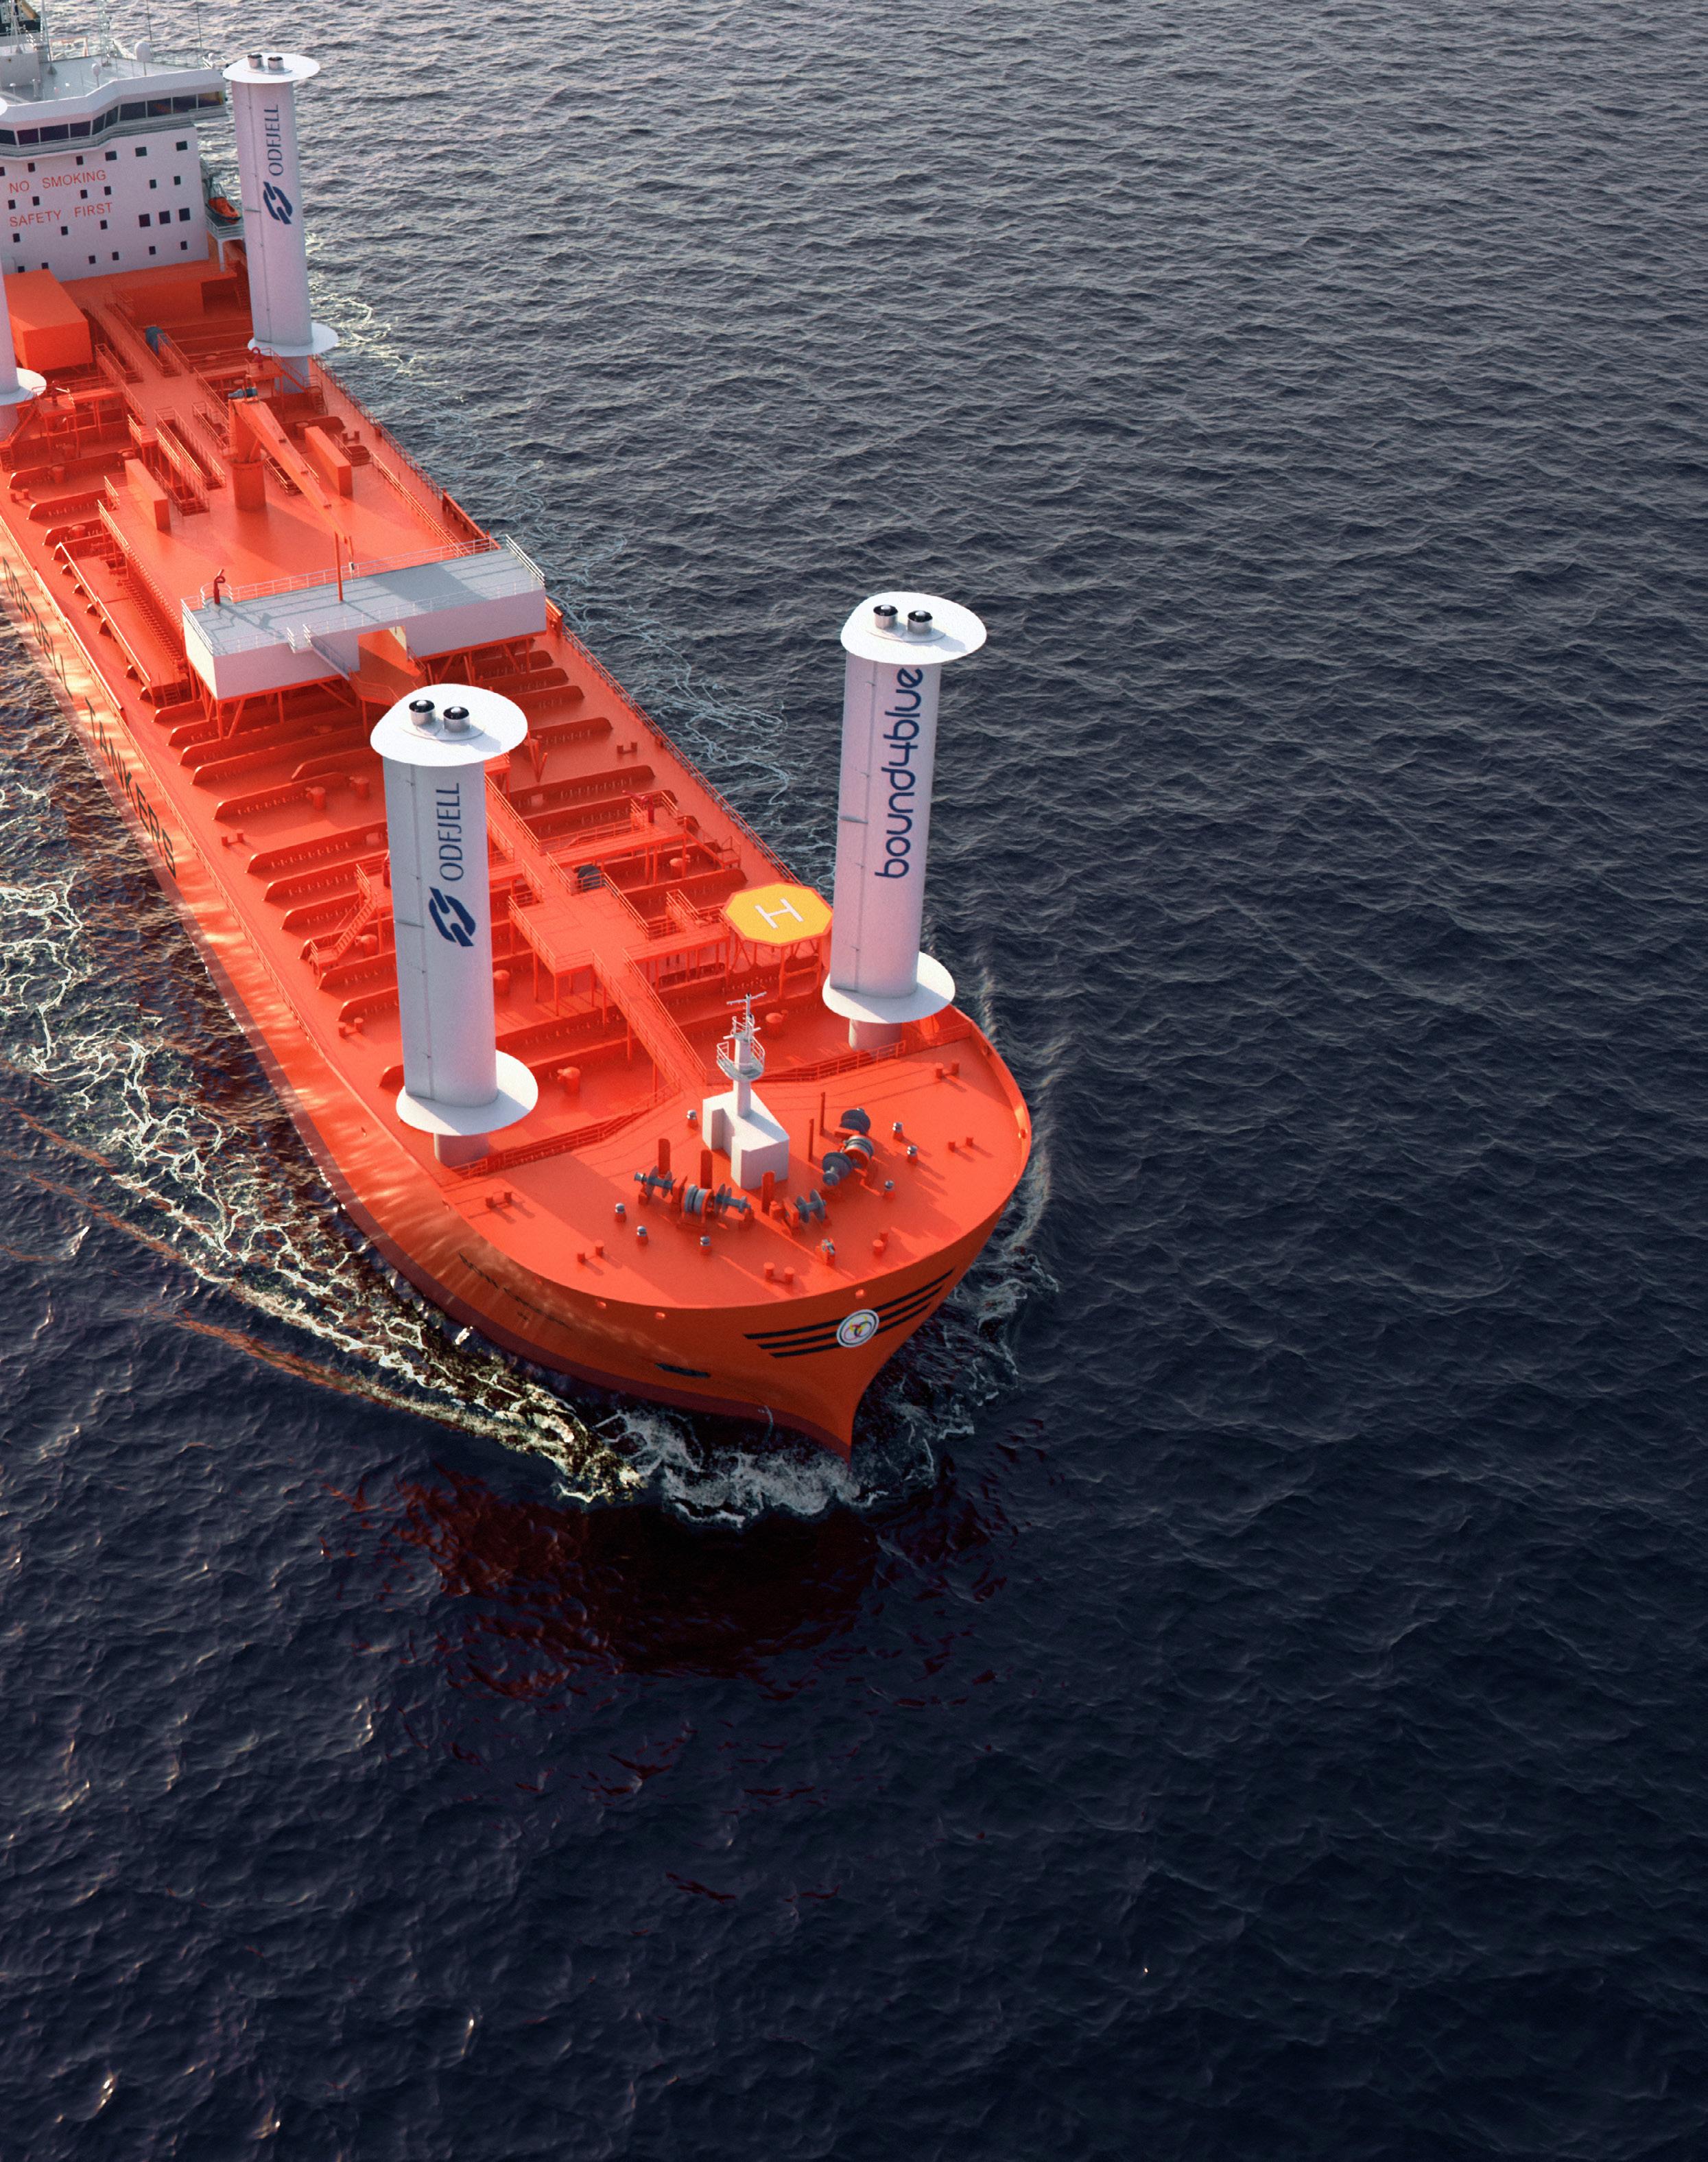
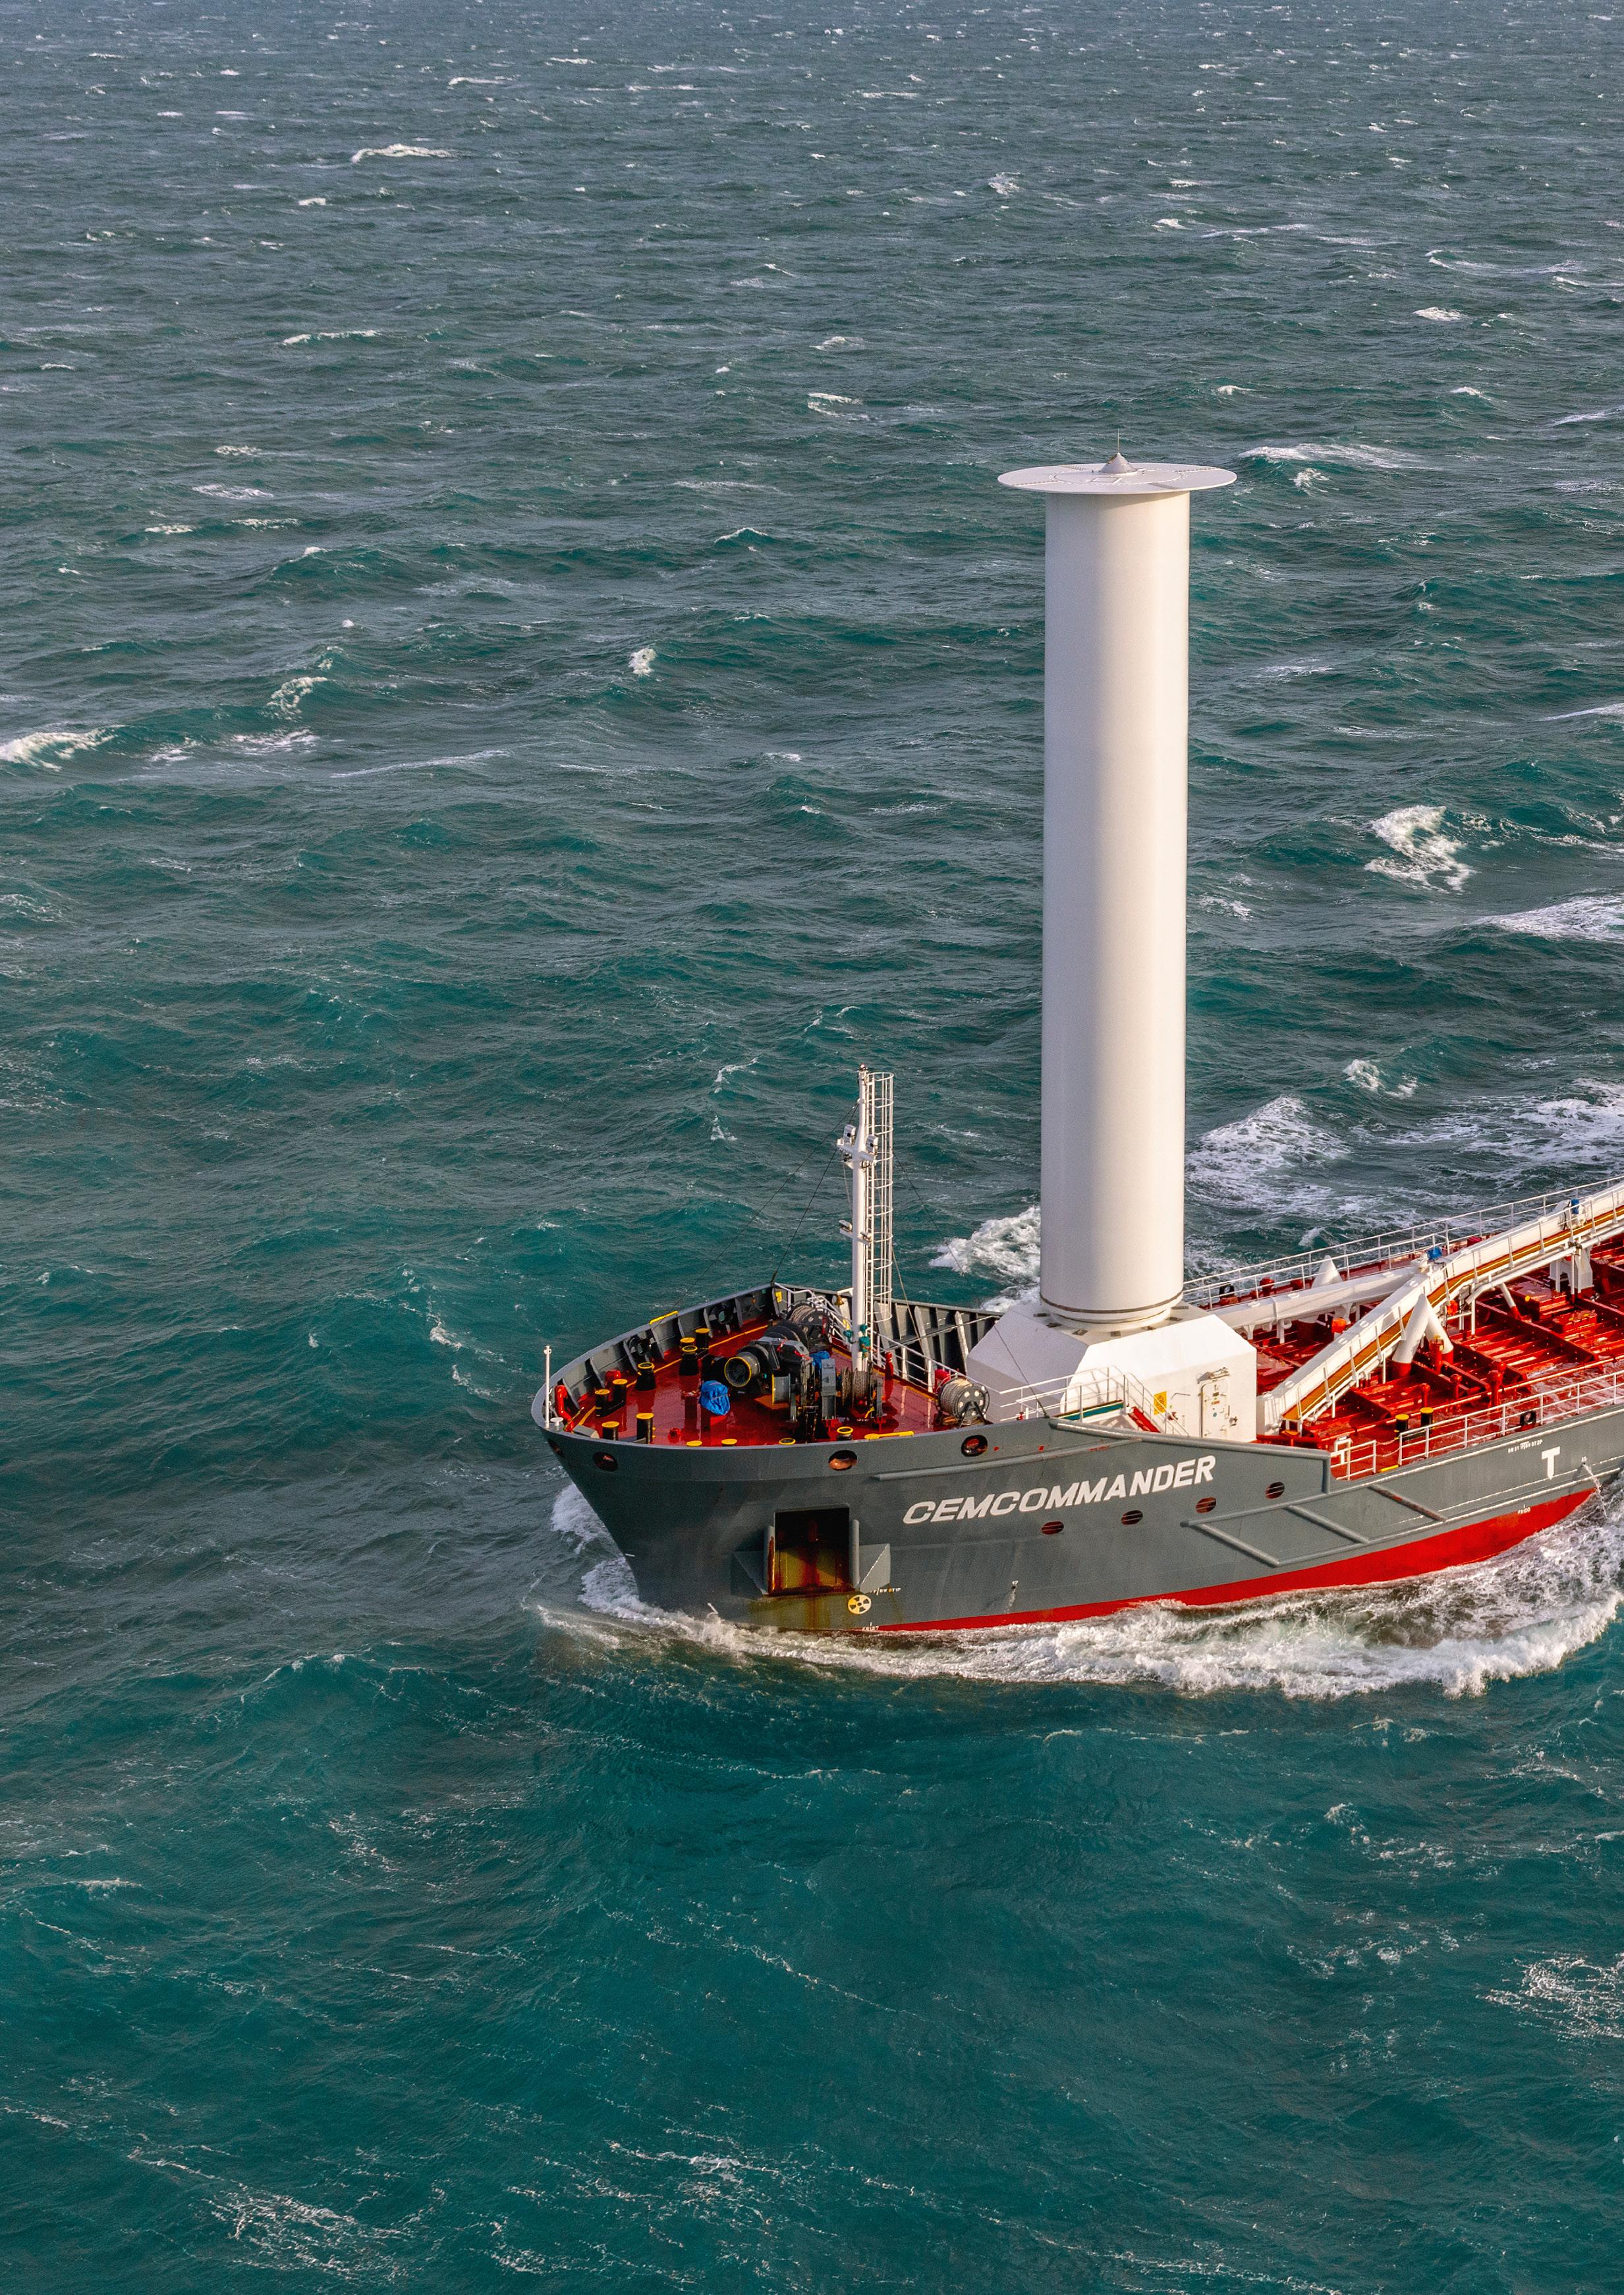
2.2.3 Suction Wing Sails
Suction wing sails resemble Flettner rotors, but they are not cylindrical, and they do not rotate at set angular speeds.
Rather, they are shaped like high-thickness wings, able to adjust their position around a rotation axis such that they encounter the apparent wind at certain angles of attack to produce lift force with a substantial thrust component. This effect is
Wind
Drag
Suction On Lift
Figure 5: Boundary layer separation delay due to axial fans’ operation. (Source: bound4blue)
amplified by the installation of axial suction fans on the highest point of the sails, which accelerate the wind flowing around one side of the wing, delay boundary layer separation and thus increase lift. This makes it possible to achieve the same thrust output as rotor sails with smaller sizes. Suction wing sails can be tiltable to reduce air draft and enable passage under bridges or cargo operations.
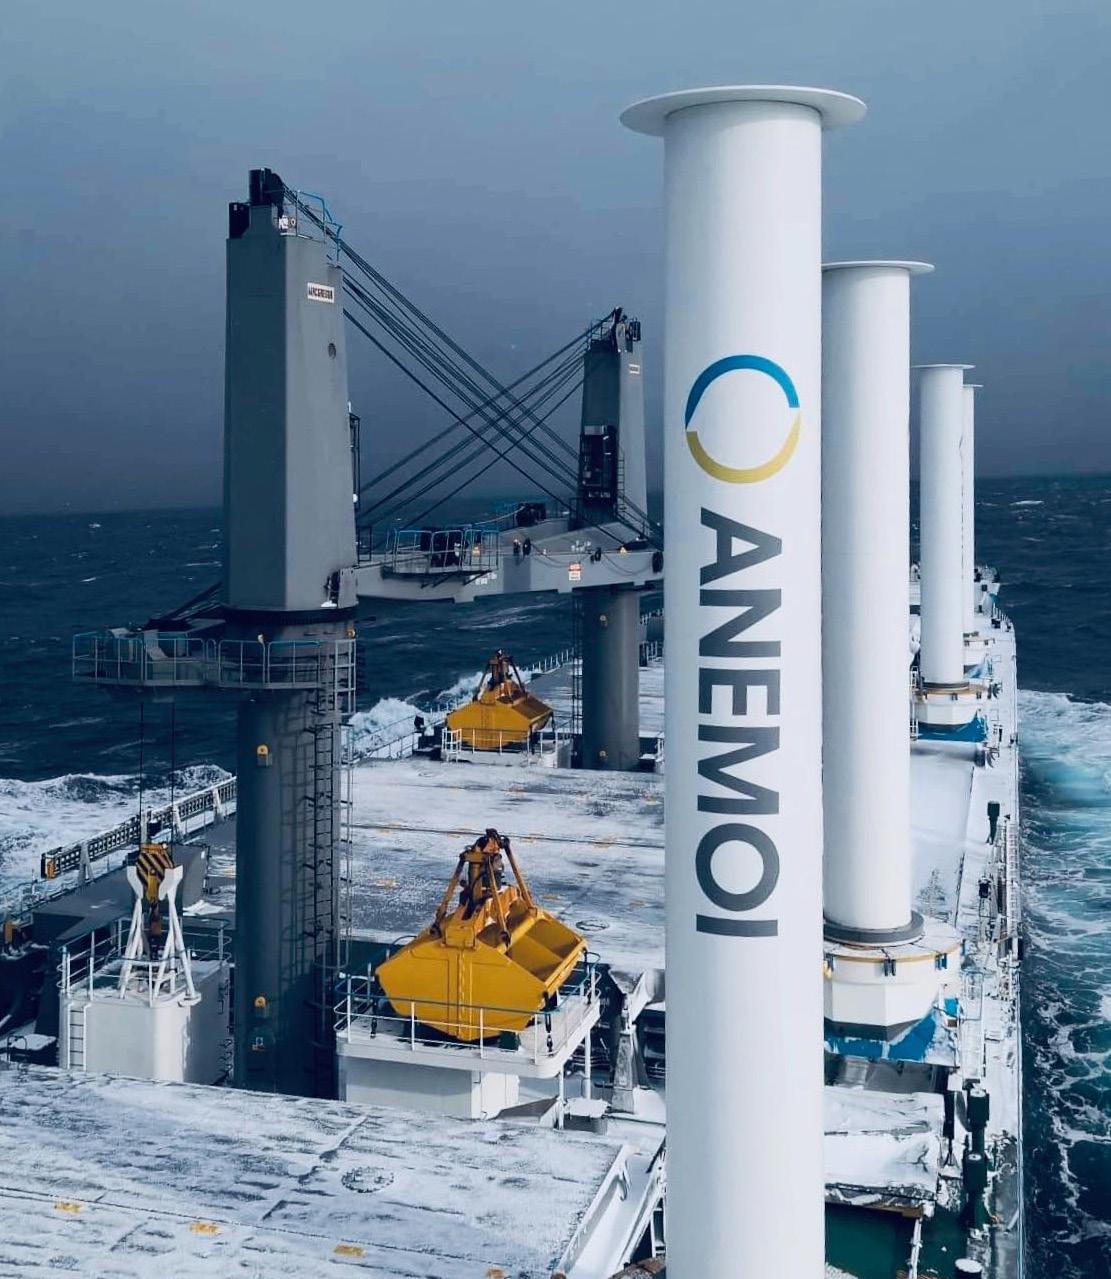
2.2.4 Towing Kites
A towing kite, resembling a paraglider wing, is connected to the fore part of the vessel using a cable, a winch and a control pod mechanism. The kite is the thrust-producing component of this installation, which operates at high altitudes, typically between 150 meters (m) and 400 m above sea level and angles between 10° and 35° (typically referred to as the “power zone”) with respect to the sea level, enabling the kite to take advantage of intense, more stable winds.
Unlike the previously described systems, the kite requires a minimum speed to achieve lift-off to tow the vessel. Also, the kite does not induce large heel moments on the vessel, as it is connected through a cable.
Figure 4: Suction wing sails.
Figure 6: Kite sails.
Image courtesy of EPS
The kite is actively controlled during its flight to execute a figure of eight motion, enabling motions which increase its apparent wind speed, thus increasing power output.
Kites achieve the most optimal towing force for the ship when the wind direction is in the reaching course or side tailwind rather than in the running course or full tailwind.
The system is launched using a telescopic mast which lifts the reefed kite to sufficient height for deployment. A winch releases the towing rope until the kite reaches operational height. The system is retracted by performing the same steps in reverse.
The system’s deployment and retrieval takes approximately 10’–20’ for each stage.
SECTION 2.3
Wind Propulsion Technologies — Advantages and Limitations
The various WPT discussed above differ in their operational principles, as well as their space requirements. The following table provides insights into the various systems’ specific characteristics.
System Type Operating Principle Parameters Affecting Performance Advantages
> Endplates dimensions
Flettner Rotors Magnus Effect
Rigid Sails Lift
> Aspect ratio
> Cylinder area
> Rotor’s revolutions
> Aspect ratio
> Sail area
> Angle of attack
> Scalability
> Flexibility in arrangement configurations
> Ability to exploit a large range of wind angles
> Scalability
> Flexibility in arrangement configurations
> Ability to exploit a large range of wind angles
Potential Limitations
Suction Wing Sails Magnus Effect — Boundary layer suction
> Suction power
> Incidence angle
> Aspect ratio
> Flap installation
Towing Kites Lift through dynamic flight ("8" flight pattern)
> Kite operating height
> Kite dimensions
> Operating angle
> Relatively small in size (compared to rotors) for the same output
> Visibility
> Stability
> Visibility
> Stability
> Visibility
> Stability
> Exploitation of intense and stable winds at high altitudes
> Insignificant area footprint
> Minuscule induced heel/ yaw angles
> Ease of installation
> Restricted wind angles operational envelope
> Complicated deployment procedure
> Lack of installation experience
Mast Adapter
Mast Kite
Control Pod Towing Rope Towing Point
Towing Winch
Reefing Winch
Figure 7: Towing kite components.
A common challenge for all systems, except for towing kites, is the interference of the WPT installation with the vessel’s operations such as cargo handling. However, most vendors provide retractable or foldable arrangements, thus mitigating any disruptions to the vessel’s operation.
The varying characteristics of various WPT indicate the need for an extensive, multidisciplinary set of studies to be conducted before a specific system is selected for installation.
SECTION 2.4
Factors Affecting the Performance of Wind Propulsion Technologies
2.4.1
Wind Conditions
Wind propulsion technologies (WPT) are, by definition, affected first and foremost by the prevailing wind conditions. Nevertheless, different systems react to the wind in different ways.
Rotors and wing sails are fixed on the vessel’s deck, except for adjusting their rotational speed and angle of attack, respectively. As a result, the apparent wind speed they experience is almost the
same as that of the vessel. Since they operate on the principle of circulatory lifting flow (where the resulting lift force is always perpendicular to the free-stream velocity), their efficiency is maximized at apparent wind angles close to plus or minus 90°, i.e., winds from port/starboard side, assuming constant apparent wind speed.
In contrast, towing kites operate at high elevation, between 150 m and 400 m above the waterline and they perform a motion pattern resembling the number eight, aiming to maximize their apparent wind speed. While the principle here is the exploitation of lift occurring from circulatory motion, the resulting force is maximized for winds close to the downwind direction (i.e., towards the vessel’s heading direction). An implication is that the kite’s performance deteriorates at high vessel speeds, since the apparent wind speed for streams blowing from the vessel’s aft is reduced.
However, high winds coexist with large wave heights requiring a balance be maintained between WPT performance and added wave resistance. Another aspect that must be always considered is sailing safety in terms of stability and structural strength.
Adopting WPT could lead to a paradigm shift in navigation.
2.4.2 Hull Design and Efficiency
The hull’s design can affect the performance of WPT in a variety of ways. For example, placing multiple rotors or wing sails on the deck induces interaction effects between the installed units, which can adversely affect their thrust production capabilities. Similarly, the distance between the units and solid boundaries (e.g., the vessel’s accommodation) affects the WPT performance. This highlights the need to carefully consider the interactions in such installations, and more importantly, the need for radical reframing of the design paradigm for newbuilds where WPT are installed, ensuring that maximum gains from propulsion wind-assisted propulsion are attained.
From a hydrodynamics point of view, auxiliary thrust production from WPT induces propeller unloading. In extreme cases, the propeller could enter a high-advance coefficient regime, where its efficiency is rapidly decreasing. This phenomenon could theoretically reverse the effect of WPT installation by increasing total fuel consumption instead of reducing it. Also, the propeller’s operation in a high-advance coefficient regime can cause vibration problems. A logical approach would be to combine the operation of a WPT with software that tunes the propeller’s revolutions to avoid problems and ensure that no excess fuel is consumed.
The thrust delivery from WPT primarily depends on shipyard-installed bridge anemometers, which fail to accurately detect the locally dynamic wind conditions affecting the WPT units’ performance. Alternative wind sensing options, such as enhanced anemometers, LIDARs, pressure
sensors, and fiber optic sensors, can provide better accuracy, allowing each sail installation to optimally adjust its operational parameters in realtime [2]. Maneuverability is substantially affected by WPT installation. In systems operating on the principle of lifting flow (e.g., rotors, sails), side forces and corresponding moments are developed which must be counteracted by the vessel, leading to non-zero rudder angle, drift angle and heel angle. These affect the vessel both from safety aspects and hydrodynamic performance due to the associated resistance increase.
2.4.3 Operational Factors
Traditionally, ships’ masters and operational managers in the maritime industry plan the vessel’s course aiming to avoid adverse weather conditions, driven by safety considerations and requirements.
To maximize WPT performance, ship managers could consider adjusting their navigational routes to chase the wind. This would vary depending on the specific system. For example, rotors and sails work best with sidewinds, while kites are suitable for downwind operation. Promising results have already been demonstrated in studies where routing optimization was conducted that considered the wind potential.
The biggest challenge for the industry is to reach an acceptable compromise. On the one hand, navigational safety must be ensured, on the other, gains from WPT installation must be fully exploited. Advanced weather routing and voyage optimization algorithms which model the vessel’s propulsion installation and its interaction with the WPT while applying navigation safety restrictions could propel the safe and efficient adoption of WPT. During sailing, automation systems could adjust the WPT operational parameters (e.g., rotors’ revolutions, sails’ angle) to ensure that both propulsion performance is optimized and adverse forces are avoided in cases of severe weather.
2.4.4 Maintenance
The efficient operation of marine equipment is largely dependent on proper maintenance. Moving parts such as those found in rotors, wing sails, etc.,
as well as supporting structure, should be subject to scheduled inspection and maintenance.
Excess wear and tear can cause performance degradation in WPT with moving parts. For example, bearings may increase friction losses if not properly maintained, hence increasing power requirements for operation. Similarly, fans in suction wings will increase their power requirement if not regularly maintained, reducing the overall efficiency of the system.
Apart from maintaining high propulsive performance, it is crucial to ensure that WPT installations do not introduce danger to the vessel, its crew, and its cargo. Routine inspection should be undertaken to avoid detrimental structural failures, e.g., failure of rotors, sails or even electrical failures.
REDUCTION OF GHG EMISSIONS AND INTENSITY
The effect of WPT on greenhouse gas (GHG) emissions is at first glance directly proportional to the fuel consumption reduction that stems from their operation while the vessel is underway.
WPT operation reduces fuel consumption that has the most adverse performance on the vessel’s GHG intensity. This affects the vessel’s performance with respect to legislative initiatives such as FuelEU Maritime and EU ETS. The effect is expected to be especially pronounced with regard to the FuelEU Maritime legislation, considering the sensitivity of the compliance balance on the GHG intensity, as well as the reward factor associated with WPT installations.
Zeroing in on the fact that the current world fleet is propelled by slow-speed 2-stroke diesel engines, the impact of WPT on GHG emissions is greater when operating on heavy fuel oil (HFO) in open seas outside EmissionsControlled Areas (ECAs) .
The EU applies reward factors for the installation of WPT in the context of the FuelEU Maritime regulation (EU Regulation 2023/1805 [3]). These factors can reduce the attained GHG intensity of the vessel up to 5 percent. This can be the difference between having to pay a penalty or having a compliance surplus which can be utilized by pooling with other vessels which have a deficit. The reward factors are calculated based on the IMO methodology, as presented in MEPC.1/ Circ.896 [4].
Table 1: Reward factors for wind-assisted propulsion, FuelEU Maritime regulation.
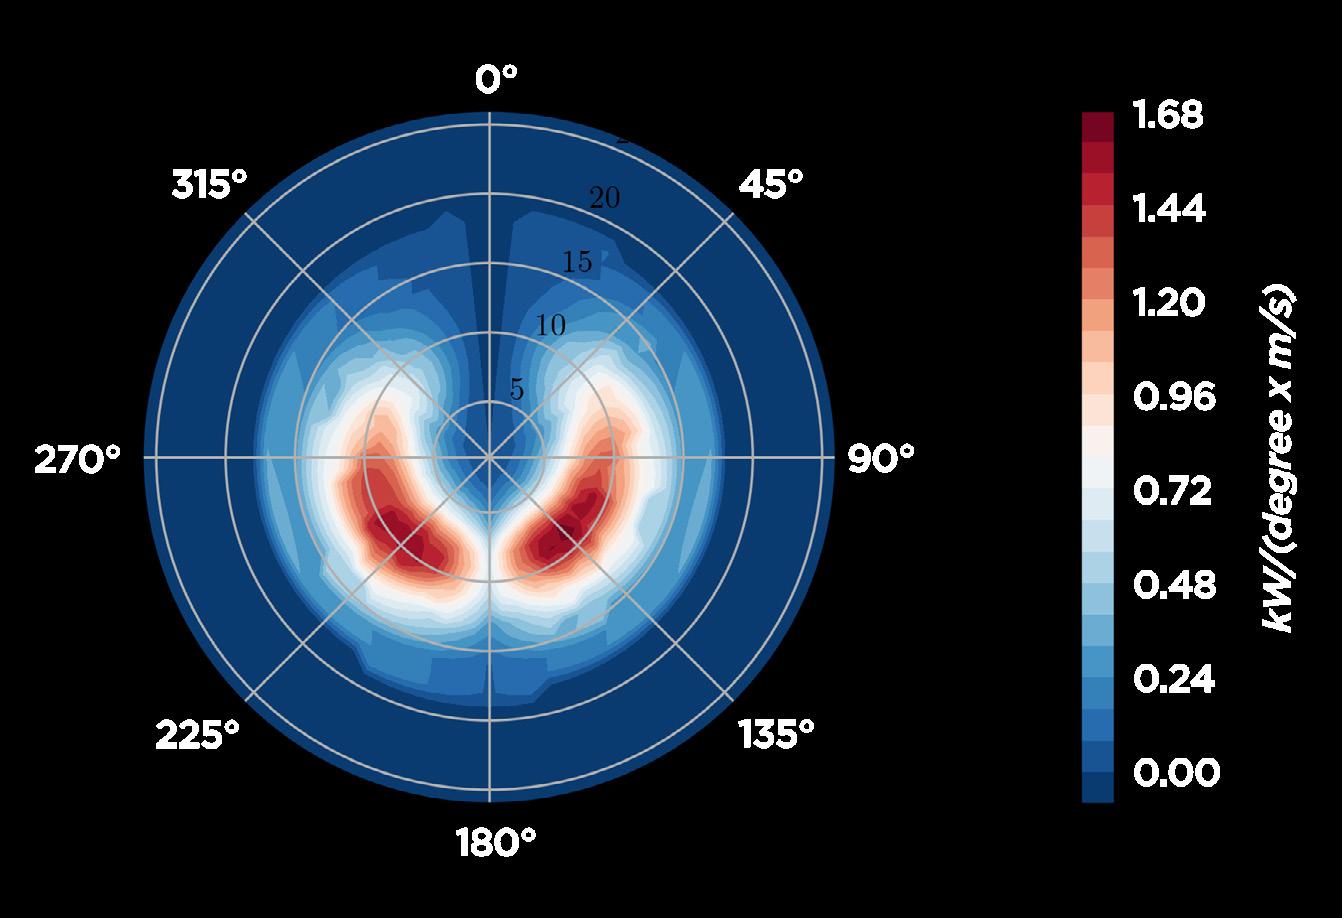
Figure 8: Calculation of shaft power reduction density versus relative wind angle, relative wind speed (m/s) due to WPT, according to MEPC.1/Circ.896. Results used for calculation of WPT reward factor in FuelEU Maritime regulation.
SECTION 4
MARKET OVERVIEW
The WPT market had been limited until recently. EMSA found that until mid-2023, WPT had been installed on 30 vessels [5]. According to data provided by the International Windship Association (IWSA) at the end of Q3 2024, there are about 45 vessels with WPT installed, and at least 34 planned to be delivered with such installations. Ten vessels are also characterized as wind-ready, nine of which have been built between 2023 and 2024.
Regulatory imperatives, environmental goals and experience gained from the systems that have been installed drive the development of the market. The last factor is traditionally very important in the shipping industry, where “few want to be the first, but everyone wants to be second.” Also, the costs of new fuels being increasingly used towards the decarbonization
goals set by IMO and the various costs associated with emissions, such as FuelEU Maritime and EU ETS regulations, make wind propulsion even more appealing.
According to IWSA, in late August 2024, WPT installations increased three-fold compared to the previous 12-month rolling period. A combination of accumulated experience from the increasing number of installations, and high fuel prices — especially when considering greener alternative ones — have led to lower ROI.
U.K.’s Clean Maritime Plan (2019) assessed that by the mid-century, the WPT annual global market will be about 2 billion GBP, implying that there will be hundreds of WPT installations annually — at that point, newbuild installations will be dominant [6].

Figure 9: WPT uptake (as of Q3 2024).
WPT UPTAKE BARRIERS AND MITIGATION MEASURES
A shipowner (or any other stakeholder) may proceed with adopting a WPT if they can ensure:
These barriers are not specific to WPT, rather they are present in the context of cost-saving technologies in general.
SECTION 5.1
Applicability
Available deck space is the most prominent consideration. WPT adoption is more straightforward in the tankers and dry bulk sectors. Containerships pose challenges due to the containers’ stacking and terminal operations. In this case, a solution would be to consider towing kites which require minimal deck space. Air draught increase can also pose a problem for vessels operating in routes involving under-bridge passages.
Infrastructure barriers could pose problems in port operations for vessels equipped with WPT, as many of the existing technologies take up deck space which is utilized by loading/unloading equipment. Again, towing kites provide an obvious solution to this problem. However, many rotor and rigid sail installations are delivered with provisions to retract the main body of the WPT, thus eliminating this issue.
Stability and maneuverability are usually impacted by WPT installations. The effect is more substantial in retrofitted vessels than in newbuilds, the latter being adapted to WPT from an early design stage. An investigation of intact stability and maneuverability of test vessels equipped with WPT has been carried out under the WiSP Phase 2 project [7].
SECTION 5.2
Access to Capital
Financing of green shipping technologies has proven to be one of the major obstacles in their adoption. As there are no freight premiums for green ships, there is no widespread cohesive strategy on how to financially reap the benefits associated with their enhanced operational and environmental efficiency. Moreover, banks — which typically provide shipping funding through loans — are more comfortable with financing newbuilds instead of retrofits due to the loan security complications; in the case of a newbuild, the ship itself acts as collateral. This hinders financing the capital investment required for wider adoption of WPT retrofits of the existing fleet. Nevertheless, WPT adoption stands advantageous in terms of financing with respect to other green shipping technologies, despite the increased capital expenditure (capex), the operation of WPT reduces the operating expenditure (opex) contrary to, e.g., modifications to enable consumption of green fuels, ignoring possible regulatory-related expenses.
To finance the significant capital expenses for WPT installations, the pay as you save (PAYS) model has been proposed (Schinas, 2019 [8]). In this scheme, the shipowner provides a portion of the capex, while an external financier supplies the rest. The savings arising from WPT utilization due to reduced fuel costs are split between owner/ financier for an agreed timeframe at a certain ratio, during which the financier aims to cover their capital investment. Afterwards, the shipowner gets all the benefits associated with the WPT operation.
Applicability of WPT
Access to necessary capital
Cost efficiency of WPT
Grants and subsidies are a potential source of funding; however, they are often local in application and have many limitations to access. Furthermore, they usually apply to research and pilot projects instead of financing the application of WPT on a fleet-wide scale.
Stakeholders in WPT development, i.e., technology providers, also face the financing issue — and it is arguably more critical compared to the case of WPT adoption. Researching, designing, developing, testing and finally producing WPT is costly. Funding is difficult to access, as many of the companies involved are small scale which makes it difficult to establish collaboration with banks. Moreover, the inherent uncertainties in assessing WPT raise the difficulty of funding for WPT development.
Some WPT development companies have been funded by venture funds, which are often backed by public funds. Funding from private sources has been typically low, inadequate to cover the whole development pipeline.
SECTION 5.3 Cost Efficiency of WPT
The efficiency of WPT, measured in fuel quantity saved compared to operating the vessel without them, has proven to be generally elusive in the industry. This is a direct result of the complexity of their operational performance, since any gains are dependent on the installation itself, as well as the actual wind conditions the vessel encounters which are in large part not controlled by the vessel’s operators. The issue is amplified by the technology providers as they are in a competitive market and hesitate to share detailed performance information. Consequently, performance predictions are hard to come by, considering also the lack of a standardized approach on behalf of the industry, one which would reflect the inherent complexities in the operation of WPT systems in tandem with the vessel’s propulsion system and the prevailing weather conditions.
5.3.1 Industry Attempts to Establish WPT Performance Assessment Methodologies
The industry has in recent years made attempts to establish methods for the performance evaluation
of WPT. A notable example is the WiSP project, a joint initiative of MARIN and ABS, which has already established methodologies to assess the effect of WPT in the EEDI/EEXI context, and is now on its 3rd Phase, which will be completed in 2026. The scope of the project is improved performance predictions, improved rules and regulations, setting industry standards for testing, and development of a tool to assist the industry in performing WPT performance assessments. Another initiative to which ABS is a partner is the ongoing SWOPP project, which aims to benchmark WPT performance predictions from various participants in the industry and establish a baseline to act as guidance. ITTC published a guideline [9] for predicting the power saving of wind powered ships, as well as a guideline on sea trials for assessing the power saving from wind assisted propulsion [10]. ABS has presented at Wind Propulsion 2024 Conference a methodology on the prediction of fuel consumption savings for wind-powered ships [11].
Figure 10: Flettner rotors.
5.3.2 WPT Attained Gains: Performance
Evaluation Post-Implementation
Establishing the effectiveness of retrofits on a vessel’s performance is inherently difficult. The reason is that post-retrofit, the observed vessel’s performance includes the effect of the retrofitted equipment, while the performance of the vessel, had the retrofit not taken place is unknown. However, prudent shipowners would rightly consider it crucial to have an estimate of the attained savings to decide if the retrofit should be applied to more vessels.
This problem can be tackled through a reference vessel performance model, i.e., a computational model which, given input such as the vessel’s speed, draft, and encountered weather, can calculate the required shaft power to propel the vessel. Using actual operational data as input to the model, the model’s results can be compared to actual shaft power values. This enables the assessment of the WPT actual performance with respect to the performance of the vessel prior to the system’s installation. This approach can be integrated in the analysis of in-service measurements obtained with WPT in operation or idle (ON/OFF).

Figure 11: Measured shaft power, predicted from reference model shaft power (without WPT forces), and their relative difference ΔP.
5.3.3
Fuel Prices
A significant source of uncertainty in the adoption of WPT is the fuel price fluctuation in the future; in general, the higher the fuel price, the shorter the payback from an energy efficiency measure. This implies that periods of economic growth and increased demand are drivers for the adoption of WPT. Nevertheless, such periods might be associated with increased demand for shipyard slots, thus increasing capex. Life-cycle cost analyses supplemented by appropriate sensitivity studies can certainly shed light on this matter’s intricacies.
5.3.4 Maintenance
The WPT installation itself is seen as an additional safety risk for the vessel and its crew, as well as a potential source of technical issues. This can be associated with extra costs due to maintenance, wear and tear, and training to familiarize the crew with the associated onboard systems. This is important, especially given that no specific technology has emerged as dominant in the WPT market, a development which would alleviate some of these issues.
PLANNING A WPT RETROFIT

The Need For Transparent Modeling
WPT data that enable predictions of the associated savings by interested parties are highly important.
WPT installations are not very common yet, and the scope of work necessary for the completion of the project is rather extensive. Such retrofit projects include design and regulatory challenges which have not been substantially undertaken by the marine and shipbuilding industry until now. Therefore, substantial work, starting many months before the vessel even reaches the shipyard, is necessary for timely and successful completion of the project.
SECTION 6.1
Investigating WPT Solutions
Detailed performance assessments, based on a vessel’s design characteristics, actual operating profile based on observed voyage data and WPT performance models should be undertaken before a WPT arrangement is decided. In this phase, it is crucial to acquire comprehensible performance data from suppliers, as WPT performance is
Be wary of generic savings claims, unsupported by technical data.
the result of the complex interplay between the vessel, the system and the weather conditions encountered.
Results from a vessel performance analysis should be supplied as input in a life-cycle cost analysis to obtain meaningful results regarding the economics of the WPT installation. For this purpose, shipowners will need the following:
Capex including design, manufacturing, transportation, installation, commissioning tests
Opex including periodic, preventative maintenance, energy requirements and crew training expenses
Cooperation In WPT Installation Projects
The inherent complexity and the sheer volume of the design and installation issues related to WPT adoption emphasize the importance of transparent cooperation between the project’s stakeholders.

With regards to capex, owners should be aware that WPT manufacturers tend to quote per project, depending on the size, number of WPT units, and design integration including automation, safety controls, hull structure strengthening and location of the installation.
Focusing on opex, shipowners are advised to approach manufacturers and obtain clarifications related to contractual warranties on in-service performance and reliability of WPT and their components. In addition, shipowners should account for additional costs relating to personnel training and familiarization.
Availability, supply and installation of hardware and software for online logging, and guidance for optimum use are also worth researching during this phase. Automatically logged WPT information should ideally be suitable for both performance evaluation as well as assessing environmental metrics. This ensures that WPT operation and any associated performance gains are easily available to shipowners — and thus to other stakeholders, e.g., charterers — in a clear, comprehensive and transparent manner.
Key WPT manufacturers can be found in IWSA.
SECTION 6.2
Project Preparation
Based on the scale of the installation and its operation in potentially hazardous conditions, risk assessment is deemed necessary. Hazard Identification (HAZID)/Hazard and Operability Study (HAZOP) should be conducted to identify the risks with operating WPT, considering specifics of each vessel owed to each design and operations. Close cooperation between ship manager, WPT vendor and designer and classification society is crucial to the project’s success. EMSA has recently conducted HAZID workshops and published their findings [5]. ABS has presented at Wind Propulsion 2024 Conference findings and recommendations from HAZID/HAZOP workshops [11].
Image courtesy of
Design studies for the installation of WPT must deal with a lot of issues, such as:
General arrangement of the installation
Availability of cargo handling space
Availability of maintenance space and accessibility of equipment for maintenance
Port accessibility
Reinforcement of supporting structures
Bridge Visibility
Stability
Maneuverability
Anchoring and Mooring equipment number
Electric power management
Automation and controls
Installation of WPT in the context of retrofits is expected to take place during scheduled drydocks, increasing the volume, complexity, and cost of the work. Consequently, shipyard specifications should include WPT-related work from the outset of the contract to enable cost control and transparency.
In the earlier stages of WPT adoption, especially in the case where the shipyard undertaking the retrofit work is not yet familiar with such projects, inclusion of design experts in compiling specifications for shipyards is strongly advised.
SECTION 6.3
Classification and Statutory Requirements
ABS published the Requirements for Wind Assisted Propulsion System Installation in July 2022 [12], which details the class installation requirements for the Wind-Assisted Ready notation, Wind-Assisted notation and Wind-Assisted+ notation. The ABS Survey After Construction requirements for WPT are found in Rules for Building and Classing Marine Vessels – Part 7, Chapter 9.
A non-exhaustive list of statutory requirements is provided below.
• SOLAS Chapter V, Regulation 22 — Navigational Bridge Visibility
• SOLAS CHAPTER II-1, Regulations 5.4, 5.5. — Stability
• MSC.1/Circ.1362/Rev.1 — Annex — Unified Interpretation of SOLAS Regulations II-1/5.4 and II-1/5.5, Relating to the Amendment to the Stability/Loading Information in Conjunction with the Alterations of Lightweight
• MSC.1/Circ.1627 — Interim Guidelines on the Second Generation Intact Stability Criteria
• Circular MEPC.1/Circ.850/Rev.3 — Guidelines for determining Minimum Propulsion Power to maintain the maneuverability of ships in adverse conditions
• MARPOL ANNEX VI, Regulation 2.2.17 — Definition of “Major Conversion”
• IMO MSC.137(76) — Standards for Ship Maneuverability
• COLREG — Requirements for Navigational Lights
• IMO MSC.1/Circ.1574 — Interim Guidelines for Use of Fiber Reinforced Plastic (FRP) Elements Within Ship Structures: Fire Safety Issues
• ISM Code — Potential hazards in ship’s operational procedures
• ISPS — a new Ship Security Assessment (SSA) may be required to determine if there are any new security vulnerabilities due to retrofit and potentially new Ship Security Plan (SSP)
• MLC — inspection may be required if substantial changes are made to ship’s structure or equipment covered under Title 3 of the convention
Addition of WPT does not render the vessel a “sailing vessel” under COLREG.
82,000 dwt Bulk Carrier
SECTION 7
TECHNOECONOMIC ANALYSIS
This section presents an example of a preliminary assessment of WPT installation. The propulsive performance of a bulk carrier is estimated from actual trading routes obtained through AIS data, both with and without WPT installed.
To perform the simulation, AIS data is augmented with metocean hindcast data acquired through the ERA5 Dataset. Results of this analysis are presented for both scenarios (base and WPT retrofit installation). This enables comparison of total costs during the vessel’s life cycle, including capex, opex, fuel prices and compliance costs.
SECTION 7.1
WPT Performance Characteristics
A comparison will be made between the vessel’s performance in a business-as-usual scenario, and the vessel’s performance with WPT installed. The WPT assumed consists of four Flettner rotors.
Table 2: Vessel data for techno-economic study.
Number of rotors 4
Height 30 m
Diameter 5 m
Aspect ratio = Height/Diameter 6
Endplate size factor, De/D 1.7
Table 3: WPT installation information.
Each rotor’s performance is characterized by its lift and drag coefficients. They are functions of the spin ratio, essentially the ratio of circumferential velocity over apparent wind speed, as well as the rotor’s geometry, described by the aspect ratio AR and endplate dimensions D e /D. They are defined as follows [13]:
CL=Lift/(0.5 • ρair • AWS2 • AreaWPT )
CD=Drag/(0.5 • ρair • AWS2 • AreaWPT )
Lift force is always perpendicular to the apparent wind, while drag is always parallel. Projecting those forces on the vessel’s longitudinal axis, the thrust force generated by the WPT can be calculated. This enables the estimation of the savings gained by the WPT performance.
SECTION 7.2
Simulation of WPT Performance on Actual Trading Routes
To assess the effectiveness of the WPT installation presented in 7.1 under realistic conditions, vessel performance simulation is conducted on the routes that the vessel traded on in 2023, which are extracted from AIS data.
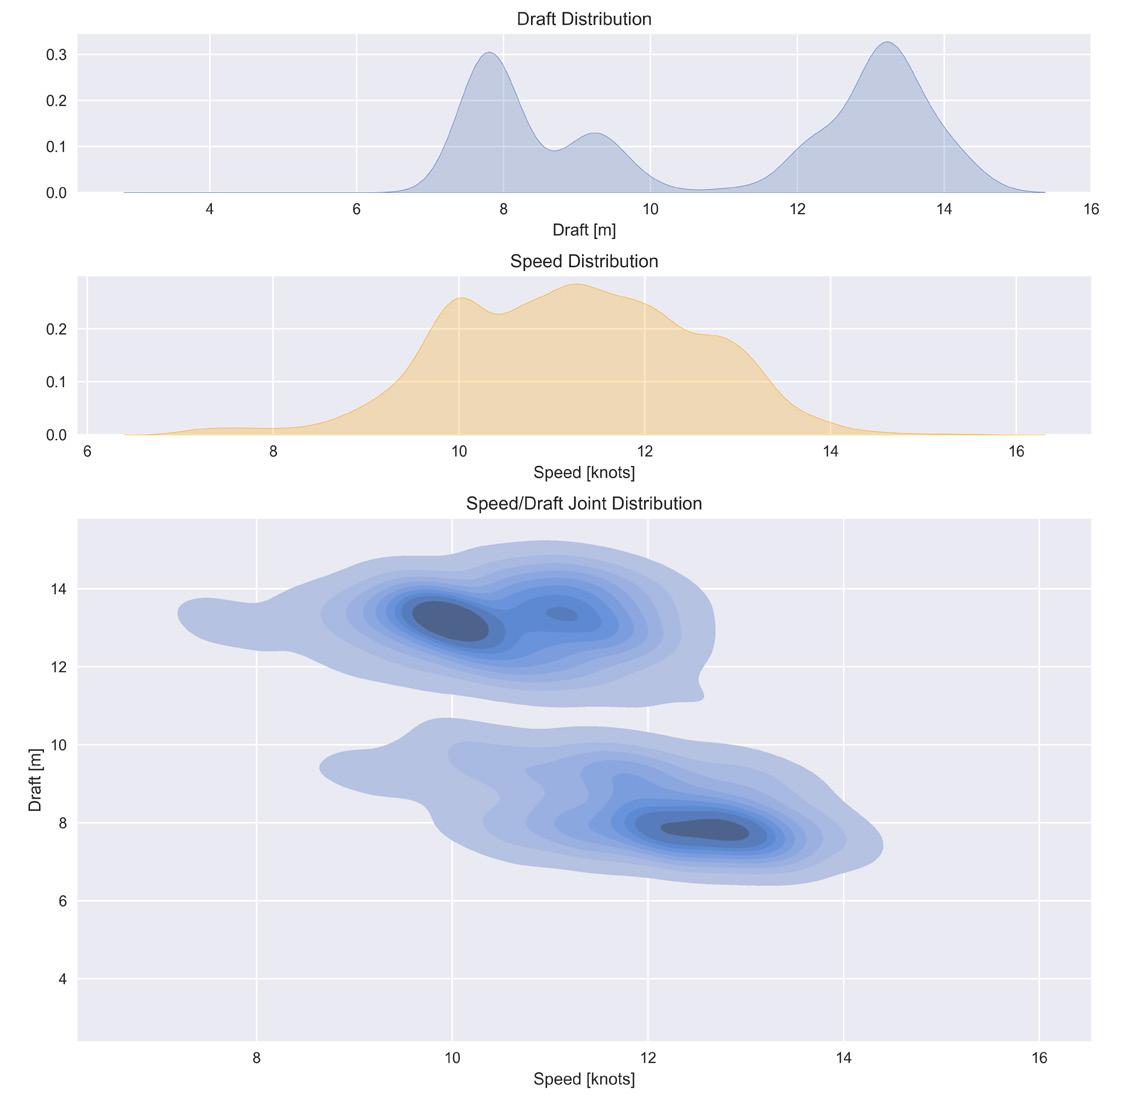
Through AIS data, the vessel’s observed operational profile can be established, i.e., the distribution of each speed and draft during its trading. This information is invaluable in making informed decisions based on the vessel’s overall performance in a spectrum of operating conditions, instead of single service speed and draft values.
The vessel’s operational profile is presented in Figure 14. It implies that the vessel is sailing mainly at two conditions: one at T ≈ 8 m and VS ≈ 12.5kn (ballast condition) and one at T ≈ 13.0 m and VS≈ 10kn (laden condition).
Figure 12: Lift and drag coefficients of chosen Flettner rotors; De/D = 1.7, AR = 4.5.
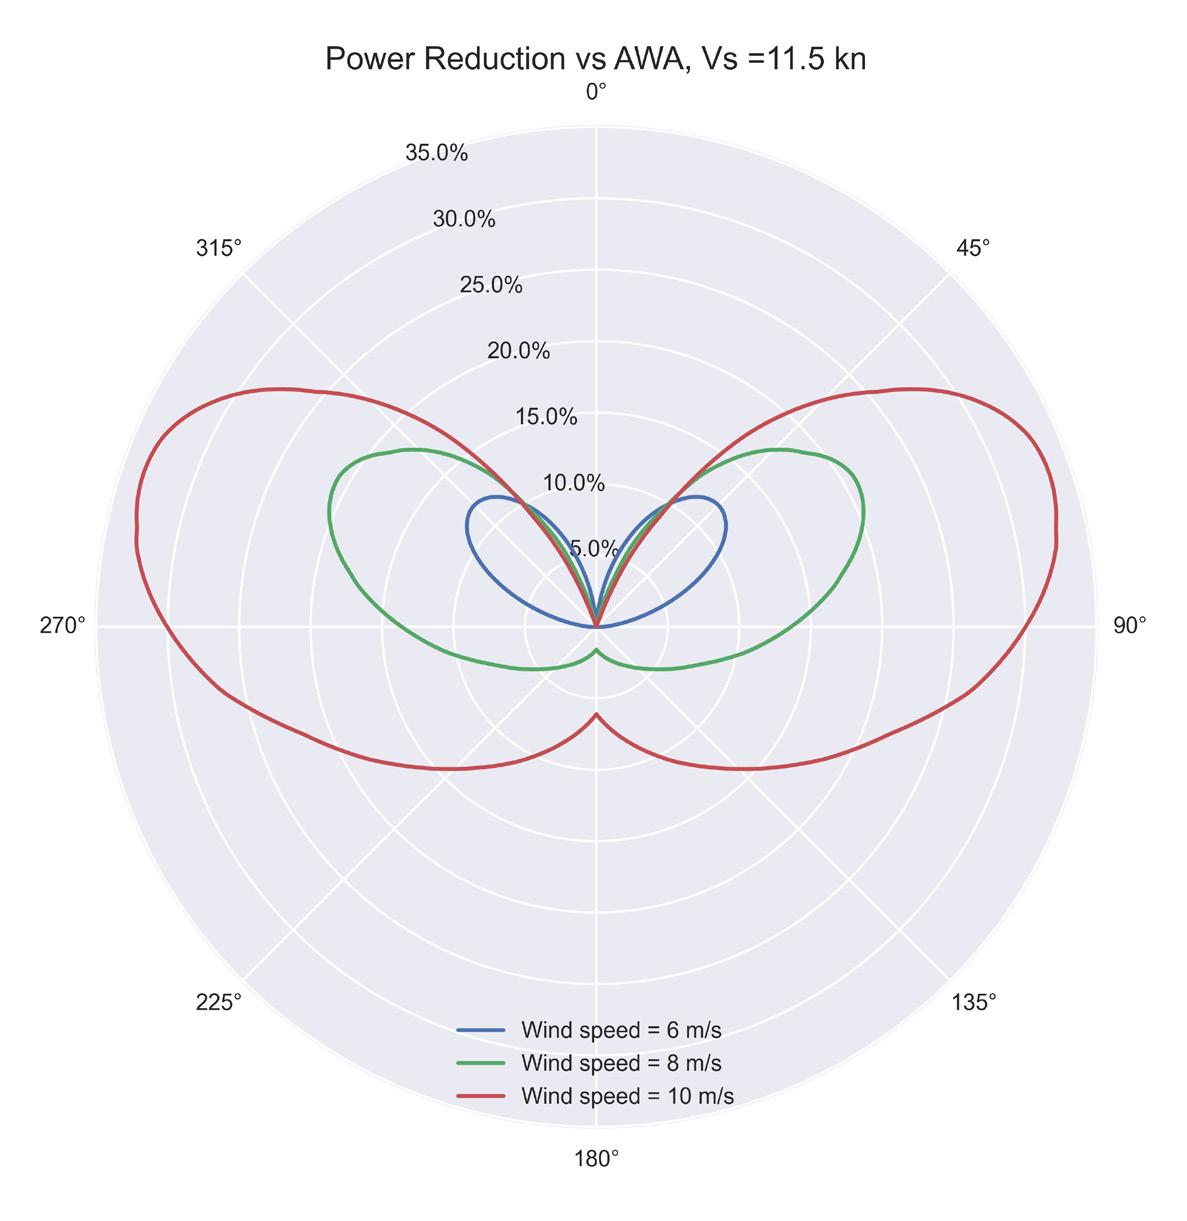
Figure 13: Power reduction from four (4) Flettner rotors, at fixed vessel speed.
The M/E fuel consumption is calculated, both with and without WPT, based on speed and draft values taken from the vessel’s operational profile, supplemented by hindcast metocean data taken from ERA5 dataset. The results are presented in Figure 15 in terms of fuel consumption distribution. It follows that the vessel’s propulsive fuel consumption is on average about 19.1 tonnes MDO/day. Assuming a retrofit of four rotors (see section 7.1), the average M/E consumption is reduced to ~17.0 MDO tonnes per day, amounting to a reduction of about 11%.
SECTION 7.3
Cost Analysis
Two scenarios are investigated:
Base scenario: business-as-usual
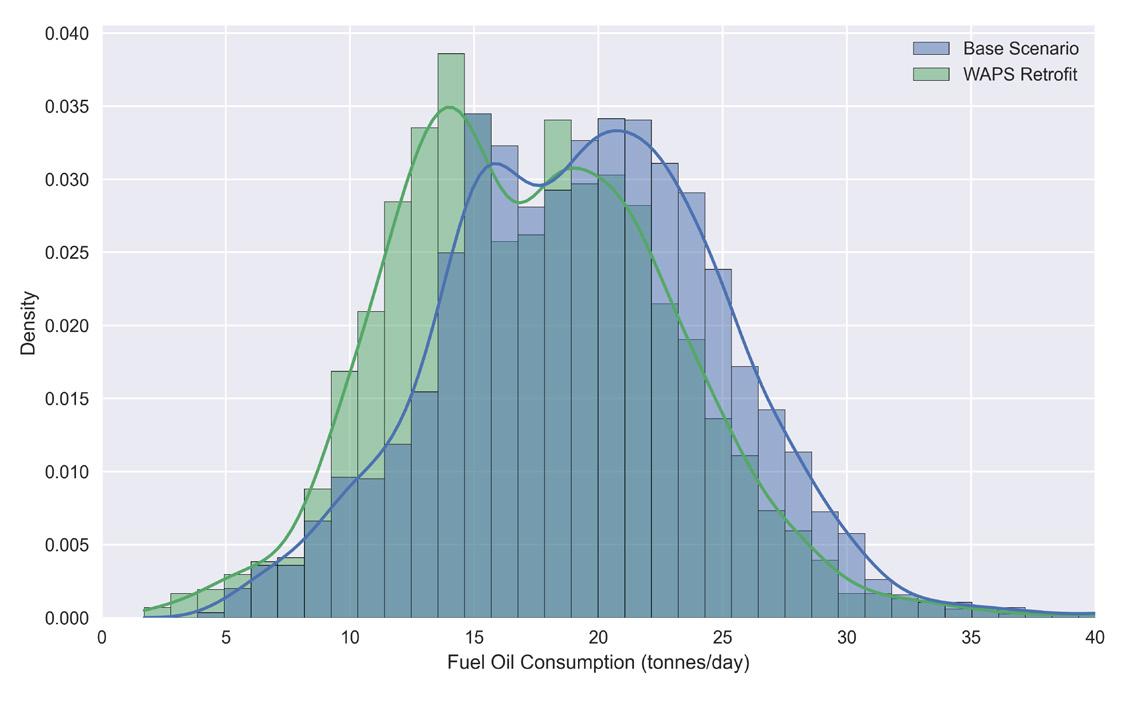
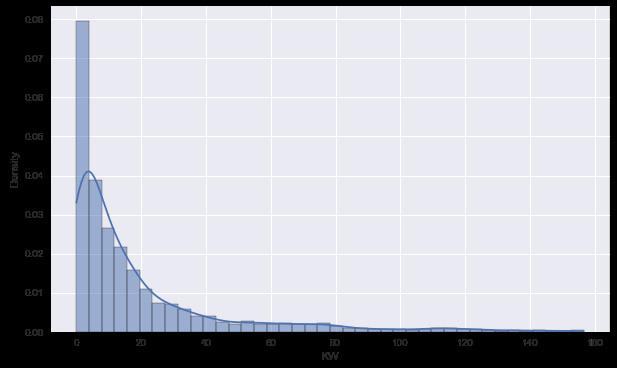
Figure 15: Top: Comparison of M/E fuel consumption — with and without WPT. WPT installation reduces consumption ~11%.
Bottom: Rotors required spinning power (simulation results). About 20kW are required on average.
WPT scenario: four rotors installed (refer to section 7.1)
To assess the effect of the WPT installation on the holistic vessel’s expenses, it is assumed that the vessel is using 100% low sulfur fuel oil (LSFO) in both scenarios.
This analysis considers the following:
• Fuel costs
• WPT capex
• WPT opex
• EU ETS
• FuelEU Maritime
Costs which are common to both scenarios are excluded.
Figure 14: Vessel’s operational profile in 2023.
7.3.1 Base Scenario
The average M/E consumption according to the analysis already presented, adjusting for LSFO lower calorific value, is 19.7 tonnes LSFO/day in the base scenario.
The vessel’s consumption for D/Gs is assumed to be 2.5 tonnes LSFO/day during sailing, 3.4 tonnes LSFO/day during port operations, and 3.9 tonnes LSFO/day during anchorage. Boiler consumption is negligible and ignored in the scope of this analysis.
In a calendar year, the vessel is assumed to be underway (M/E running) for 225 days, in port for 62 days, and waiting in anchorage for 78 days.
The numbers presented are taken from the vessel’s (see Table 2) reported data for 2023.
7.3.2 Alternative Scenario — WPT Retrofit
In the alternative scenario, the vessel is assumed to be operating on the same routes; however, its consumption is different, reflecting the effect of the rotors’ operation.
M/E fuel consumption is reduced by 11% (refer to section 7.2). This amounts to 487 tonnes LSFO saved annually. However, the auxiliary engine consumption is increased to support the operation of the proposed WPT. It was found that the rotors require on average 20 KW of power to rotate during actual conditions. Assuming 91% generator efficiency and 210 g/KWh specific fuel consumption of the D/Gs, rotors’ spinning amounts to about 0.12 tonnes LSFO/day during sailing. 1 2
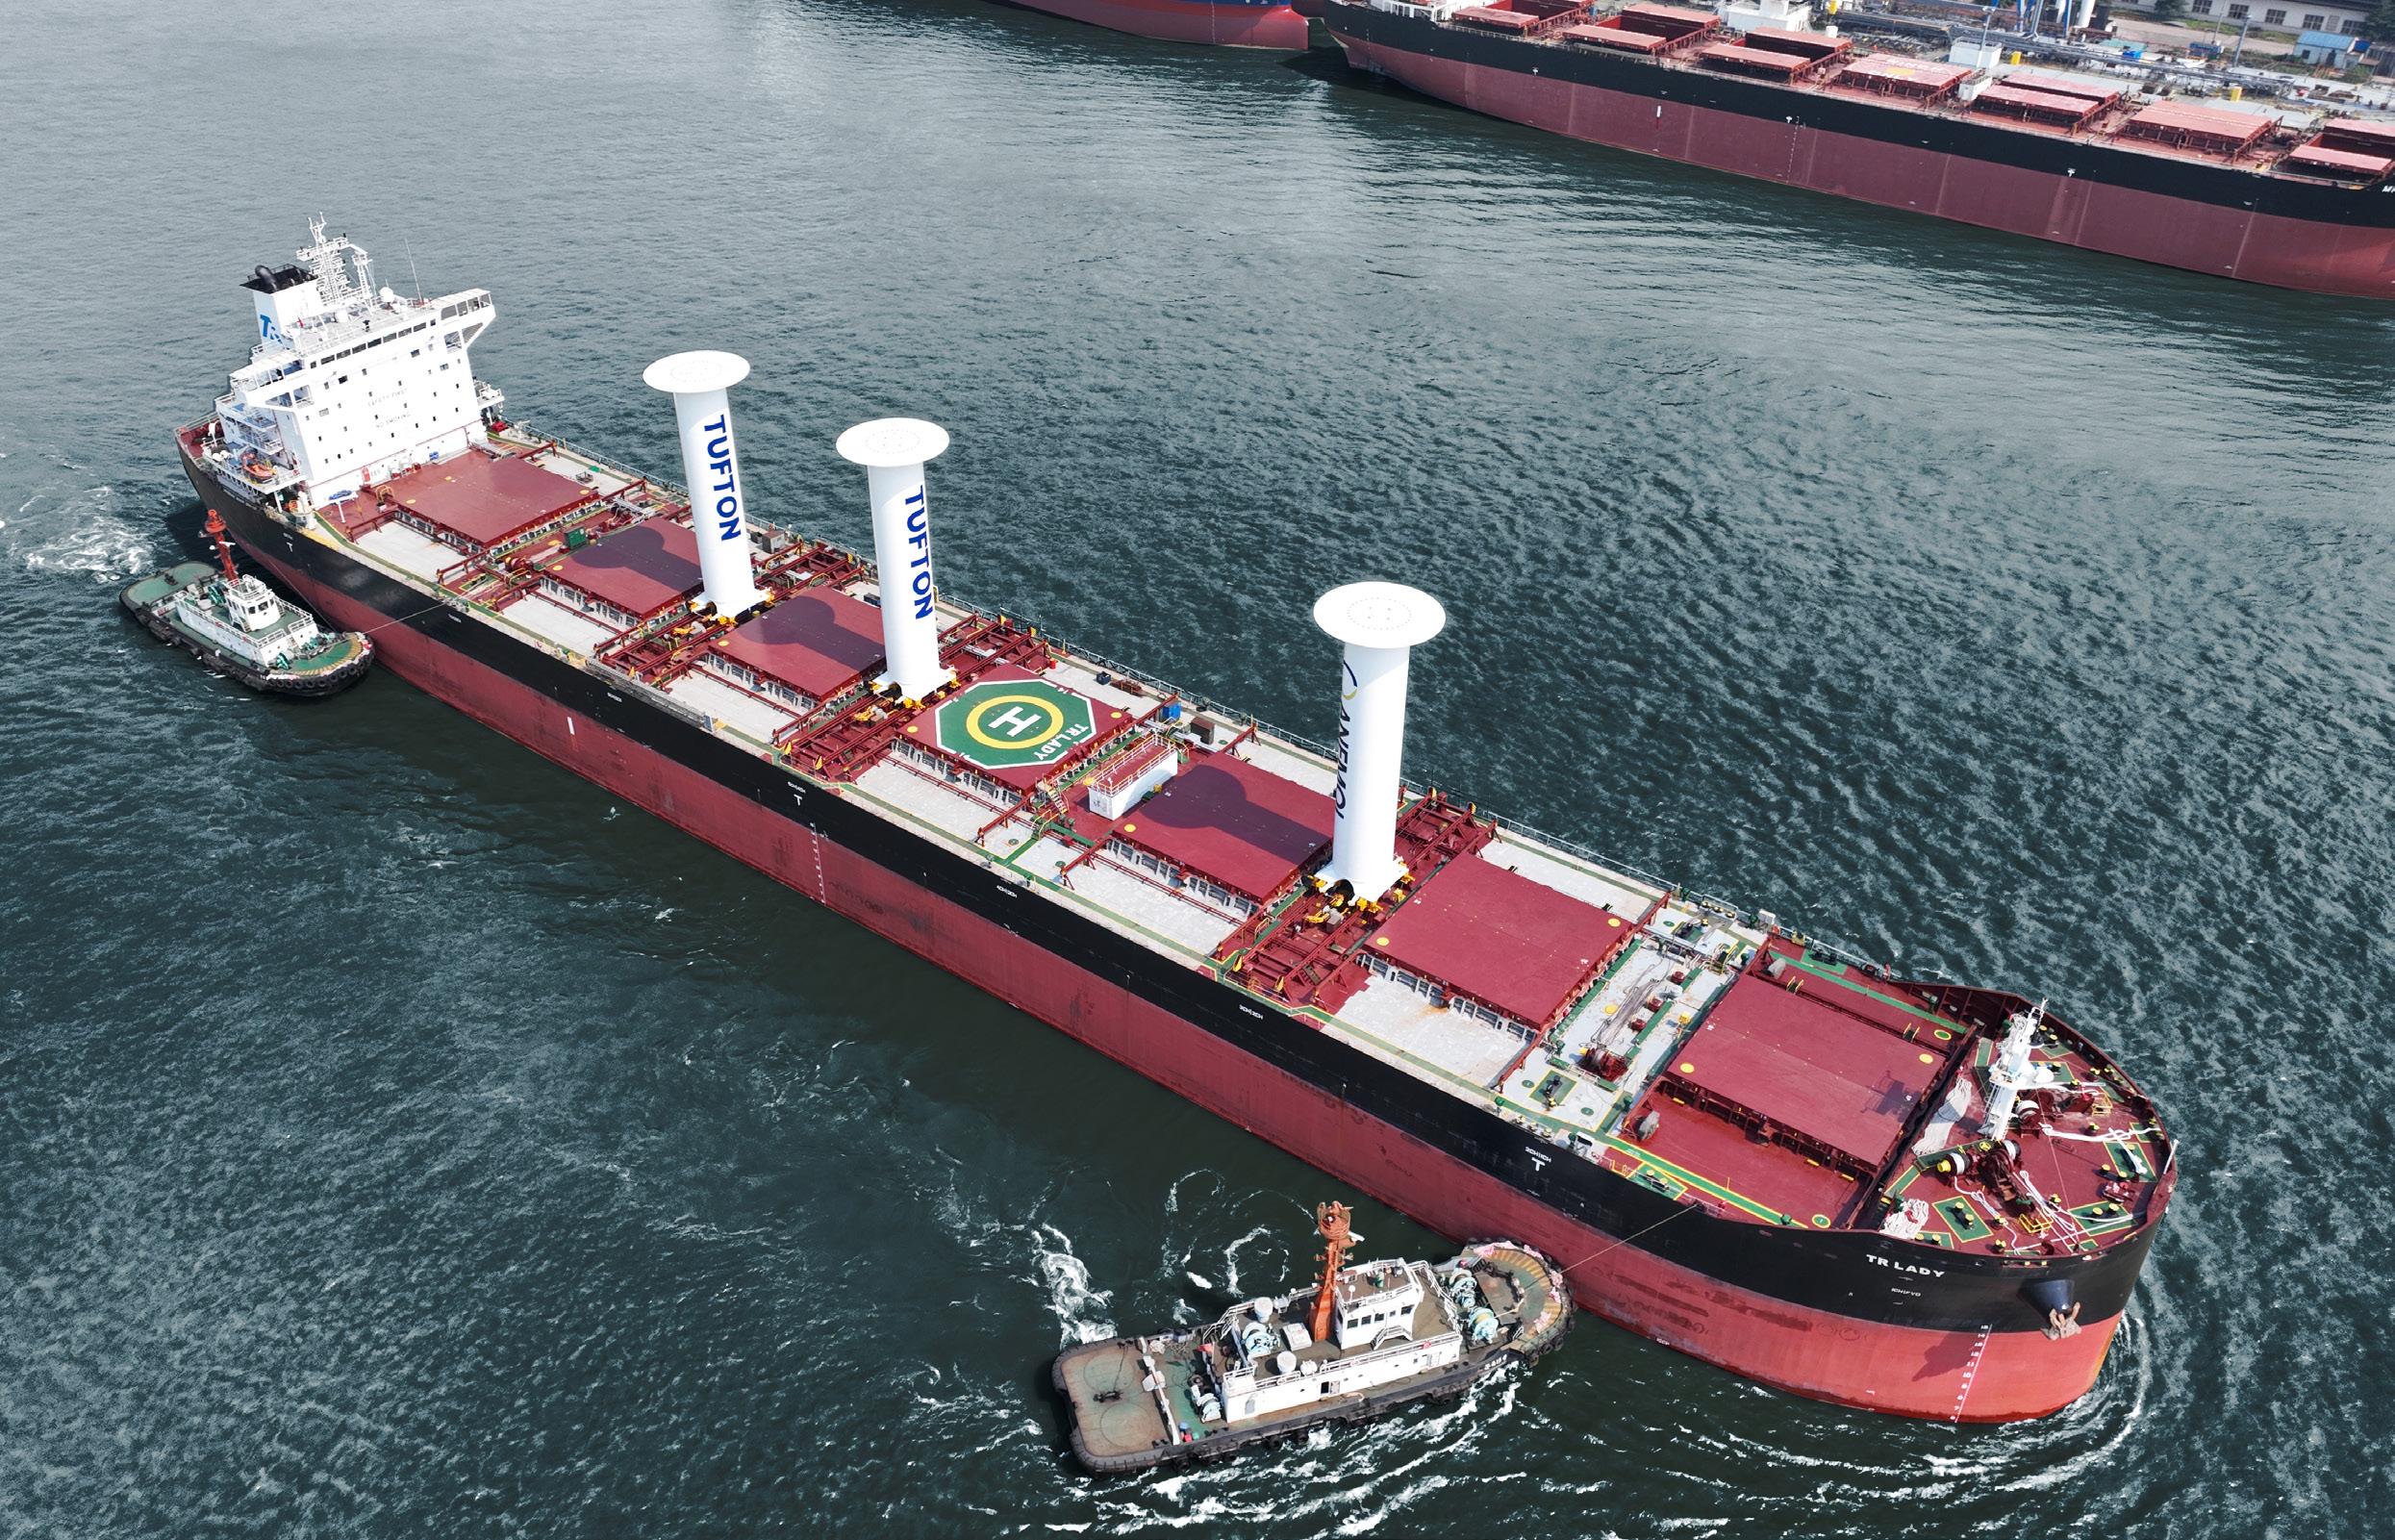
Table 4: Vessel’s operations and consumptions overview — base scenario.
Table 5: Vessel’s operations and consumptions overview — alternative scenario (WPT retrofit).
7.3.3 Comparison of Costs
The WPT capex for four rotors is taken equal to $3,000,000, while the annual opex, including maintenance and possibly crew training, is assumed to be $60,000.
Regarding the regulatory costs, it is assumed that 25% of the vessel’s emissions are subject to FuelEU costs and the EU ETS. Another assumption is that the vessel gets the maximum bonus from the WPT installation in terms of FuelEU Maritime, i.e., a 5% reduction in the calculated compliance balance.
Fuel LSFO price is taken from the publicly available Fuel Cost Calculator from Mærsk McKinney Møller Center for Zero Carbon Shipping. For 2023, its price is assumed to be 735.35 USD/ tonne, gradually reduced to 554.4 USD/tonne in 2030 and held constant for the next years.
$45,000,000
$40,000,000
$35,000,000
$30,000,000
$25,000,000
$20,000,000
$15,000,000
$10,000,000
$5,000,000
To compare costs between the base and the WPT retrofit scenario, we calculate the cumulative discounted cash flows until 2040. The discount rate is taken equal to 4%.
The presented analysis assumes that all the benefits in terms of fuel, as well as the compliance surplus from the first years of FuelEU Maritime regulation are attainable by the stakeholder that assumes the cost of capex and opex. Also, it is assumed that the charter rates are the same in both scenarios. Assuming charterers will reimburse the cost for EU Allowances, EU ETS costs are not considered in this analysis.
Figure 16 presents the cumulative costs in the form of TCO for the base and the WPT retrofit scenario. The intersection of the two curves corresponds to the investment’s payback time, which is approximately 7.9 years under the current assumptions.
Payback Time: 7.9 years
Base Scenario WPT Retrofit
Figure 16: Accumulated costs and payback time of WPT retrofit.
Image courtesy of Computed Wing Sail
7.3.4 Cost Sensitivity Study
Since various aspects of a vessel’s operation and its costs are dependent on factors subject to complex market dynamics, stakeholders are encouraged to undertake sensitivity studies to assess the effect of changes in these factors on the investment’s payback time.
Figure 17 presents a sensitivity study of payback time with respect to WPT capex and opex.
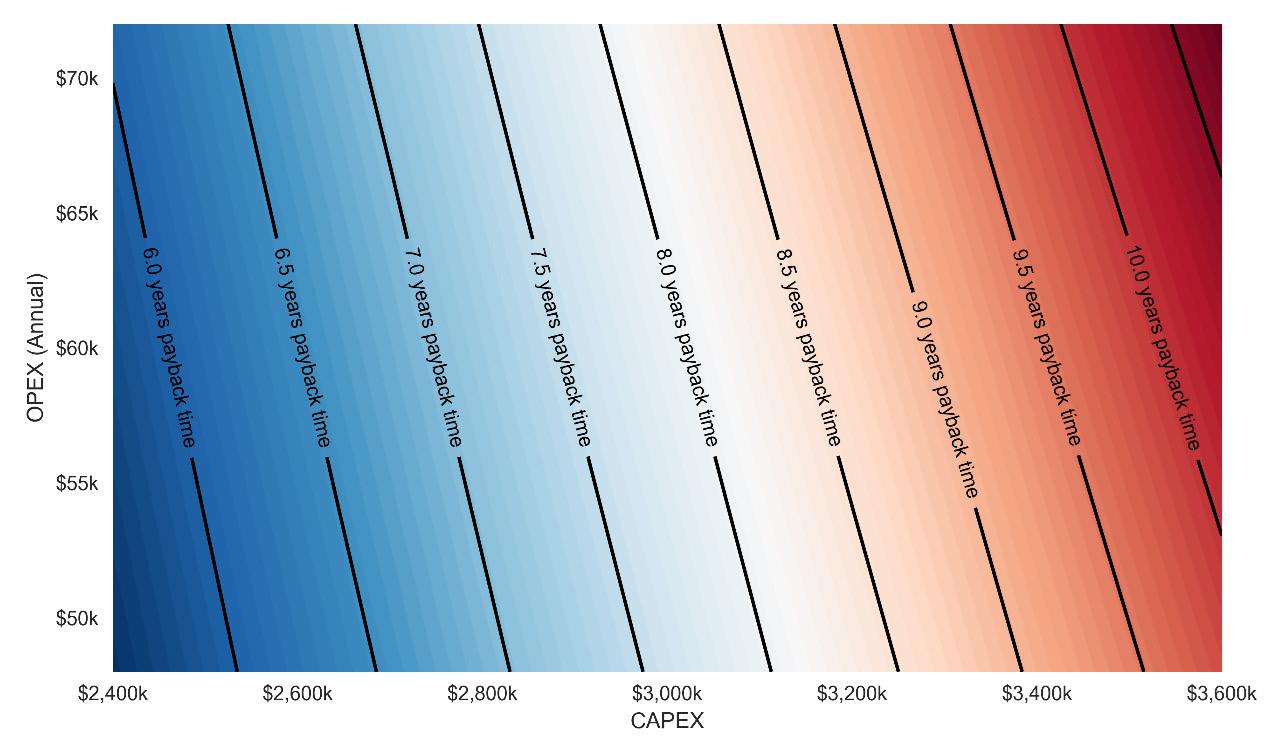
Figure 17: Example of sensitivity study on WPT retrofit payback time: capex, opex variation.
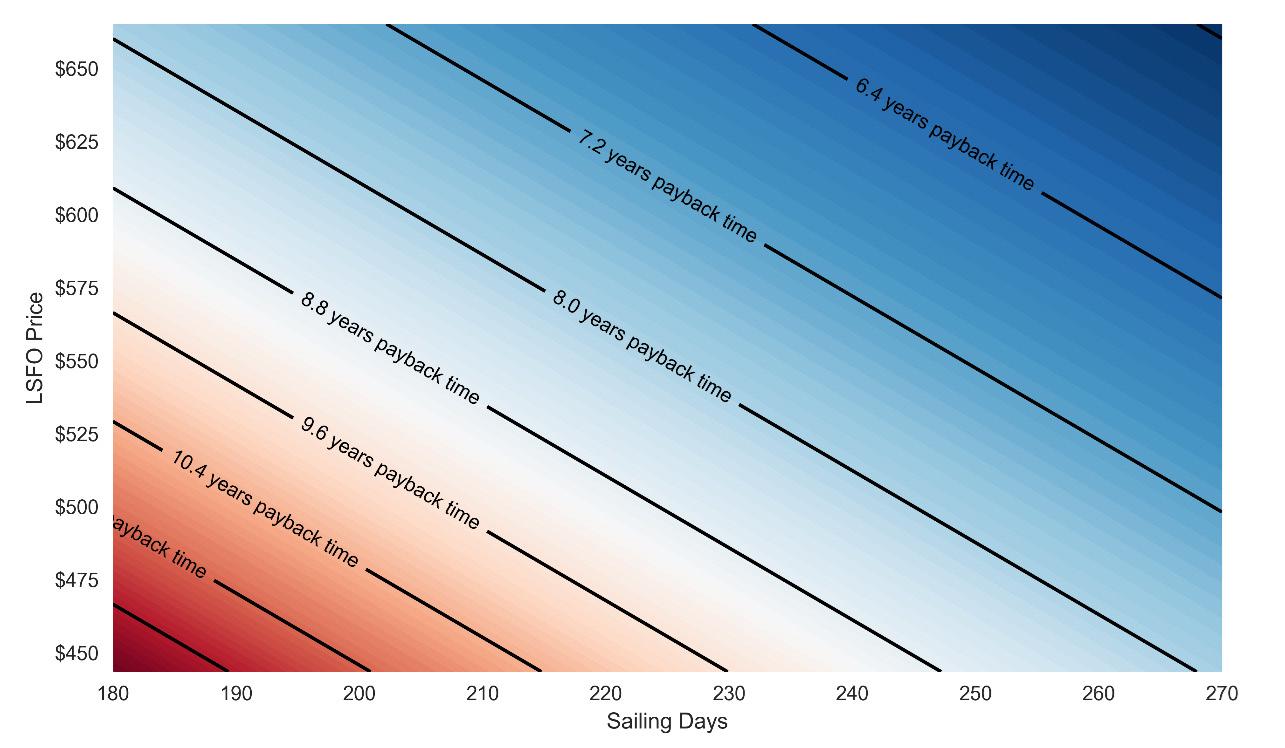
Figure 18: Example of sensitivity study on WPT retrofit payback time: Sailing days in year, LSFO price variation.
Figure 18 presents the results of a sensitivity study of the payback time with respect to the LSFO price and the sailing days in a year. Increasing the LSFO price shortens the payback period, as the increased fuel cost corresponds to larger cost savings due to the WPT retrofit. Similarly, increasing the days the vessel spends at sea corresponds to larger utilization of the WPT and therefore quicker accumulation of gains.
SECTION 8
SUMMARY
The increasing interest in wind propulsion technologies underscores the wind’s potential to reduce fuel costs and meet environmental compliance requirements. The coming years will be pivotal in shaping the
roadmap for WPT adoption, with more shipyards undertaking retrofits. Additionally, there will be a growing need for knowledge in operating, maintaining, and training personnel in the use of WPT.
ABS has been at the forefront of WPT development and adoption.
TYPE APPROVALS DESIGN REVIEWS
Publication of REQUIREMENTS AND GUIDES
Leading and participating in JOINT INDUSTRY PROJECTS
ESTABLISHING METHODOLOGIES IN PERFORMANCE PREDICTION and evaluation of WPT during service, providing dedicated ship-specific analysis leveraging actual operational data
REFERENCES
[1] N. Rehmatulla, S. Parker, T. S. Smith and V. Stulgis, “Wind technologies: Opportunities and barriers to a low carbon shipping industry,” Marine Policy, no. 75, pp. 217-226, 2017.
[2] K. Fakiolas and C. Knox, “Boosting Wind-Assisted Ship Propulsion (WASP) Performance Through Accurate Wind Sensing Techniques,” in Wind Propulsion Conference, London, 2024.
[3] European Parliament and Council, “REGULATION (EU) 2023/1805 on the use of renewable and low-carbon fuels in maritime transport,” Official Journal of the European Union, 2023.
[4] International Maritime Organization, “2021 GUIDANCE ON TREATMENT OF INNOVATIVE ENERGY EFFICIENCY TECHNOLOGIES FOR CALCULATION AND VERIFICATION OF THE ATTAINED EEDI AND EEXI,” 2021.
[5] European Maritime Safety Agency (EMSA), “Potential of Wind-Assisted Propulsion for Shipping, 2023.
[6] UK Department for Transport, “Clean Maritime Plan,” 2019.
[7] American Bureau of Shipping, “Final Report for WiSP2 JIP Task 6.2 Manoeuvrability, Course Keeping and Stability,” 2023.
[8] O. Schinas and D. Metzger, “A pay-as-you-save model for the promotion of greening technologies in shipping,” Transportation Research Part D: Transport and Environment, no. 69, pp. 184-195, 2019.
[9] ITTC, “Guideline — Predicting the Power Saving of Wind Powered Ships,” International Towing Tank Conference, 2024.
[10] ITTC, “Guideline — Sea trials for assessing the power saving from wind assisted propulsion,” International Towing Tank Conference, 2024.
[11] L. Karaminas, H. N. Patel, A. Priovolos and N. Lamprinidis, “Prediction of Fuel Savings and HAZID/HAZOP Workshops – Essential Actions for Every WAPS Project,” in Wind Propulsion Conference, London, 2024.
[12] American Bureau of Shipping, “Requirements for Wind Assisted Propulsion System Installation,” American Bureau of Shipping, 2022.
[13] M. R. Vilanova, Performance Prediction Program for Wind-Assisted Cargo Ships, Thesis for Master’s Degree, Copenhagen: DTU, 2020.
LIST OF ABBREVIATIONS
AIS Automatic Identification System
AR aspect ratio
capex capital expenditure
CII Carbon Intensity Indicator
COLREG Convention on the International Regulations for Preventing Collisions at Sea
D/G diesel generator
EEDI Energy Efficiency Design Index
EEXI Energy Efficiency Existing Ship Index
EMSA European Maritime Safety Agency
EU ETS European Union Emissions Trading Scheme
GHG greenhouse gas
HAZID Hazard Identification
HAZOP Hazard and Operability Study
IMO International Maritime Organization
ISM International Safety Management Code
ISPS International Ship and Port Facility Security Code
ITTC International Towing Tank Conference
IWSA International Windship Association
LSFO low sulfur fuel oil
M/E main engine
MARPOL International Convention for the Prevention of Pollution from Ships
MDO marine diesel oil
MEPC Marine Environment Protection Committee
MLC Maritime Labour Convention
MSC Maritime Safety Committee
opex operational expenditure
ROI return on investment
SOLAS Safety of Life at Sea
TCO total cost of ownership
WAPS wind-assisted propulsion systems
WPT wind propulsion technologies