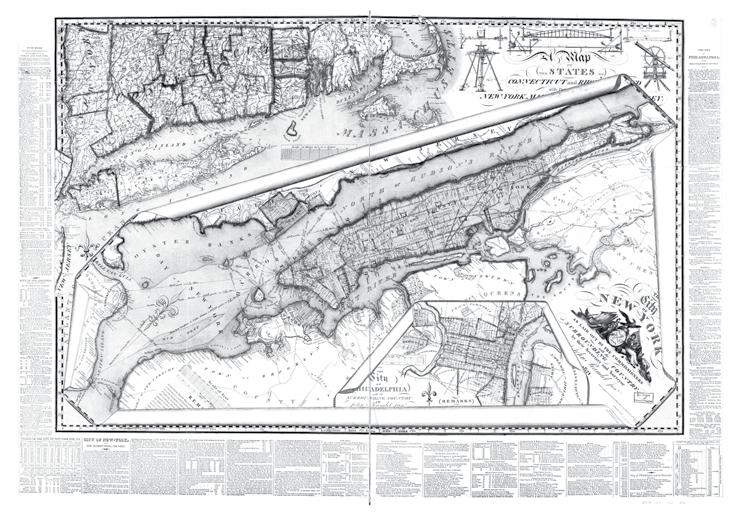
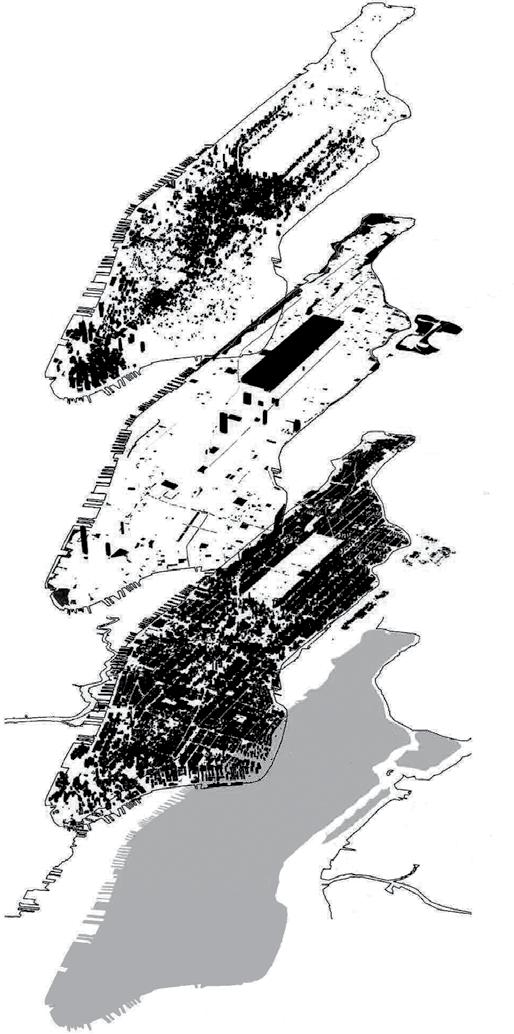
The Commissioners’ Plan of 1811 Provisional Map, Released in 1807
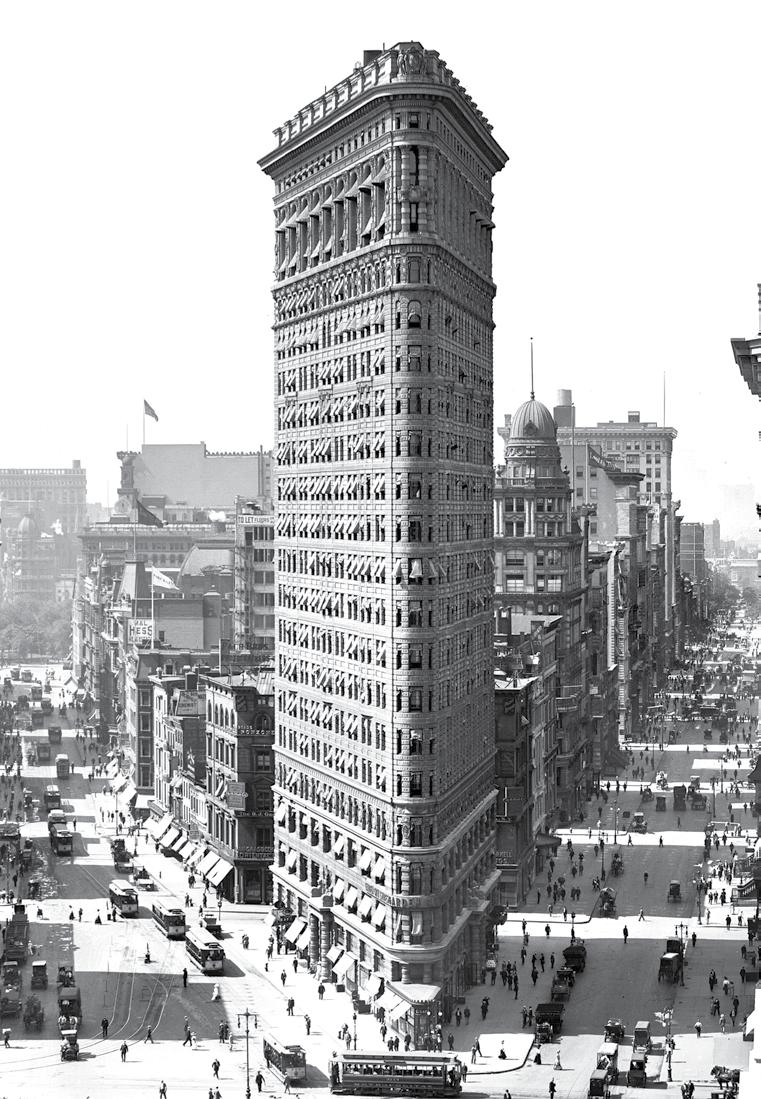
real estate developers, Broadway’s diagonality also attracted strong opposition in 1811 from traffic planners and engineers, who saw its abrupt presence as confusing to traffic movement. However, a valuable legacy of this grid-diagonal tension is the production of major public open spaces designed as visual termination points at six-way “bowtie” intersections whenever Broadway crosses an avenue, resulting in some of the most treasured public spaces serving the public interest: Union Square, Madison Square, Herald Square, and Times Square, which set the stage for diverse and eventful communal life. 6 These irregular plots presented design challenges for architects to design for non-orthogonal footprints. Some of the most iconic buildings in New York that emerged from these challenges include the Flatiron Building designed by Daniel Burham (1902), Trinity Church by Richard Upjohn
6 B. Davis, “On Broadway, Tactical Urbanism.” faslanyc, 2010; Stephen Carr et al., Public Space (Cambridge: Cambridge University Press, 1992).
Fig. 1
(1864), and the Marine Midland Building by Gordon Bunsha ft (1968).
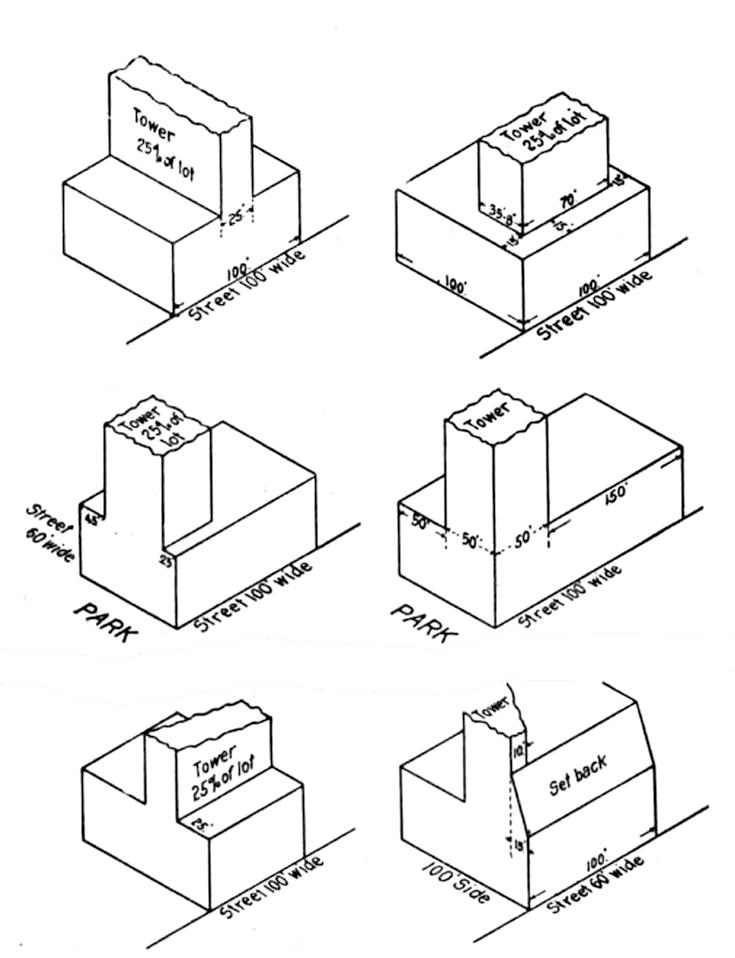
In addition to the 1811 Commissioners’ Plan, the Zoning Resolutions of 1916 and 1961 further induced dramatic changes to New York’s skyline. The 1916 resolution marked the inception of city-wide regulations that, for the first time, imposed use restrictions, bulk restrictions, and administrative provisions. This landmark resolution was a multifaceted product shaped by various influences, including reform ideology, Fusion politics, the tumultuous state of the real estate market, and the agitation of local interests.7 Striking a balance between aesthetics, economics, and health and safety considerations, the resolution aimed to accommodate a diversity of concerns and interests. The progressive era at the time prioritized public interest over market interest, placing the emphasis on addressing crises related to public health and population as the primary concern. 8 In this context, the protection of real estate value, while always significant, was relegated to a secondary consideration.9 Fig. 2-3
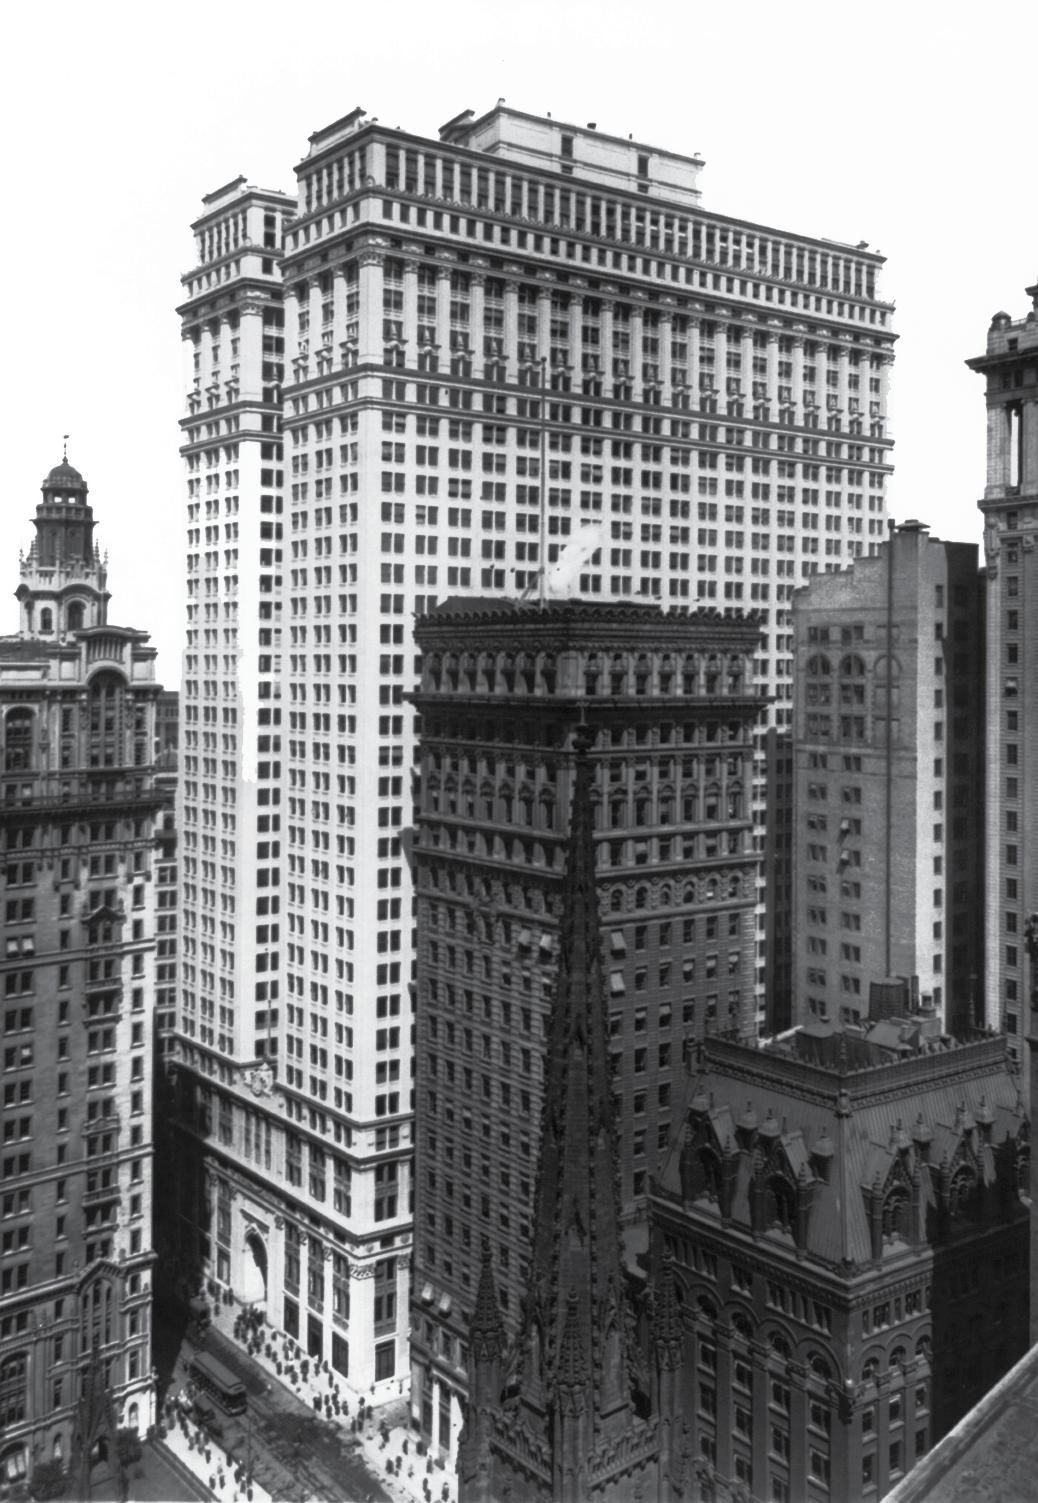
The Zoning Resolution introduced the principle of the zoning envelope which determined the shape, size, and position of the building and prevented the construction of structures at the scale of the Equitable Building (1915), whose massive size blocked out natural sunlight for the street and its nearby neighbors.10 The predefined zoning envelope effectively shaped the aesthetics of high-rise building design in New York and encouraged the wedding cake or ziggurat-shaped setback style—a terrace-like form toward the upper portion of a skyscraper—for owners who wished to exploit the maximum buildable volume allowed for the lot.11 As a compromise between financial pursuits and comprehensive regulation, the setback style casted positive impacts such as increased privacy, exposure, light and air, and activated utilization of the tower’s upper levels as commercial spaces or outdoor public spaces.12 According to commercial architect Ely Jacques Kahn, “The New York zoning laws protecting property rights, light, and air
7 Stanislaw J. Makielski, The Politics of Zoning: The New York Experience (New York: Columbia University Press, 1966).
8 Elliott Sclar, “The Infinite Elasticity of Air: New York City’s Financialization of Transferable Development Rights,” American Journal of Economics and Sociology 80, no. 2 (2021): 353–380.
9 Mel Scott, American City Planning Since 1890: A History Commemorating the Fiftieth Anniversary of the American Institute of Planners. No. 3 (Berkeley: University of California Press, 1969).
10 N YC Department of Planning, The Zoning Handbook (New York: NYC Department of Planning, 2018).
11 Willis, Form Follows Finance, 19-23.
12 Hugh Ferriss, The Metropolis of Tomorrow (Mineola: Dover Publications, 2005).
AR+D Publishing
Setback Tower Options, 1916, Described in the 1916 Zoning Report
The Equitable Building, Ernest R. Graham, 1915, New York
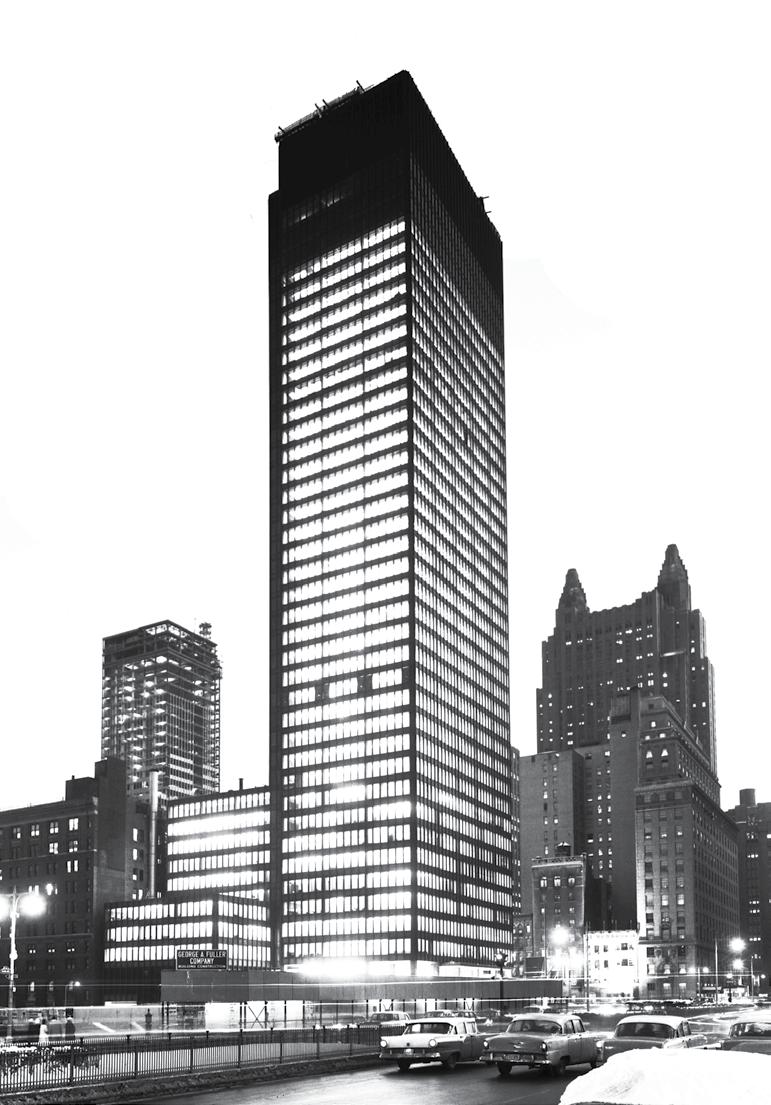
The Seagram Building, Ludwig Mies van der Rohe, 1958, New York
Design Premium
equal to roughly $450 per square foot and $430 million today. The entire building was financed by Seagram’s own funds without involving mortgages. It was a bold investment decision that entailed high risk; however, the project was financially profitable from the first year. The building’s operating expenses were easily covered by the rent that Seagram was paying for the space they occupied. The rent from other tenants was all profit. The rentable space was already 90% occupied in the opening year. Tenants were willing to pay $7 to $8.30 per square foot, higher than the average of $5.25 per square foot for similarly large, newly constructed buildings in the same neighborhood. The high rents yielded a net income of $400,000 the first year, equal to $4 million today.69
By 1960, The New York Times noted the trend: “The idea that good architecture is good business is becoming axiomatic in corporate management circles.”70
The unique investment strategy of both the Lever Brothers and Seagram—investing in new architectural ideas, looking at long-term return in public goodwill, and institutional advertising while generating competitive return from rents—proved to be a viable business model for others to follow.
The norm of filling every square foot of the legally allowed volume was finally being challenged. When the banks—institutions known for taking a conservative position in making investments—started hiring outstanding architects to design their headquarters soon after the Seagram Building, New York’s urban form was no longer a byproduct of the zoning regulation. In fact, the appreciation of Seagram Building’s public plaza spurred the revolution of New York’s zoning ordinance to incentivize developers to provide more open public space by offering an additional density bonus.
Developers, investors, and architects reconfigured architectural modernism to support business-oriented agendas.71 Clients recognized the architects’ creativity in integrating financial goals and zoning regulations into their rational forms. In addition, the glass curtain walls representing modern architecture were conceived as cutting-edge American technology that added significant value in increasing marketability and securing tenants.
69 “Seagram’s Bronze Tower,” Architectural Forum, July 1958.
70 Ennis, “Company Edifices ‘Sell’ Products.”
71 Stevens, Developing Expertise, 13.
AR+D Publishing
New York City Real Estate Market Milestones
Total Sales Volume ($ billions)
$2.5 $0
World Trade Center site cleanup ends.
LMDC announces new, international, open-design study of World Trade Center site and surrounding areas.
300 Madison Ave. construction complete, design to withstand catastrophic damage.
General Motors Building record sale for an office building.
Time Warner Center’s penthouse record sale for residential building.
Average price for Manhattan apartment tops $1 million for first time in history.
First private sector LEED Gold building, The Helena, 580 unit, residential apartment completed.
Hudson Yards site available for development due to failure in plan for NY Jets Westside stadium and 2012 Olympics.
High Line elevated greenway ground breaking.
Construction of One World Trade Center begins. A month later, 7 World Trade Center completed.
StreetEasy first technology company to disrupt NYC real estate.
Bear Stearns discloses two hedge funds, focusing on securitized subprime mortgages, have incurred almost total losses, marking onset of mortgage crisis.
Kushner Companies pays record $1.8 billion for 666 Fifth Ave.
Lehman Brothers collapses as financial crisis accelerates.
Bear Stearns collapses after operating for 85 years, signaling widespread panic on Wall Street.
Due to the economic downturn, real estate developer Macklowe fails to secure refinancing and defaults on approx. $7 billion worth of debt.
High Line opens, spurring a slew of residential projects on the West Side.
General Growth Properties files for bankruptcy, described by Reuters as “the biggest real estate failure in U.S. history.”
Residential sales plummet as buyers hastily withdraw from their purchase agreements.
Google’s purchase of 111 Eighth Ave. for $1.8 billion revitalizes the Manhattan commercial scene, sparking a surge in the Midtown South tech industry frenzy.
WeWork’s first space opens in Soho.
Sales at One57 start before completing construction.
Building’s units collectively marketed for $2 billion.
Conde Nast agrees to take 1 million square feet at One World Trade Center, positive impact for Lower Manhattan’s commercial market.
Related Companies and Oxford Property Group break ground on 28-acre Hudson Yards project.
Hurricane Sandy submerges much of Lower Manhattan, estimated $8.5 billion in property damage on private landlords.
AR+D Publishing
One World Trade Center tops out, becomes the tallest building in Manhattan.
how quantifiable design metrics influence commercial buildings’ financial valuation in urban contexts. This understanding transcends physical urban landscapes, echoing even in digital realms where spatial attributes carry monetary value, as evidenced by the rising value of properties. This interplay of city-level wide data integration and analytics creates a virtuous cycle, where the benefits and applications of digital twins reinforce further understanding of the built environment.19
3.2 Re se arch Methods
Over the past several years, the MIT Real Estate Innovation Lab has been developing computational frameworks, known as the Wide Data Experiment, that integrate architectural and urban design into financial econometric methods in order to automatically calculate real estate pricing and development valuation. The Wide Data Experiment is essentially a combination of publicly available data from New York government entities and private data providers such as Real Capital Analytics (RCA) and Compstak. The integrated database provides fundamental hedonic variables for asset pricing analysis. Using the Wide Data Experiment’s geometric, geospatial, and relational databases, we have begun to test valuation forecasts at the urban scale. Fig. 13
Each of our studies endeavors to provide empirical evidence demonstrating the financial value of design within commercial real estate in the context of Manhattan, using transaction and rental data spanning nearly two decades, from 2000 to 2017. For each study, we begin with a basic asset pricing model that includes data provided by transaction and rental data providers Real Capital Analytics and Compstak.
Real Capital Analytics (RCA) is a private data provider specializing in property transaction data based in New York City. The database collects data from a network of independent sources, with particular emphasis on the building transaction data that includes financing details, prior transaction history, and true owner identification to complete profiles. From this database, we use variables including the transaction price for
19 To push forward this endeavor requires an inclusive group of actors—not only architects, urban planners and designers, policymakers who are more traditional urban-related fields, but also emerging tech industry players. One leading actor is Epic Games, who developed the widely adopted Unreal Engine, which is promising for realizing digital twin applications. For more information, see: https://www.unrealengine. com/en-US/digital-twins.
AR+D Publishing
The Wide Data Experiment
Urban Geometry
Cell Towers (GeoTel)
Financial Performance Data (RCA, Compstak)
Design Performance Data (MIT REIL)
LOD2 Building Geometry (NYCDoITT)
MapPLUTO Parcel Data (NYCDCP)
Fiber-lit Buildings (Geotel)
Fiberoptic Cables (Geotel)
NYC Subway routes and stops
The Wide Data Experiment Summary: Building Sales Data From
Total of 3,318 Transactions for 1,540 Buildings
Building Class:
2000–2017
The Wide Data Experiment Summary: Building Sales Data From 2000–2017
The Wide Data Experiment Summary: Building Rental Data From 2003–2016
Total of 22,201 Rental Observations for 1,655 Buildings
Rental Market Characteristics
Building Characteristics
Building
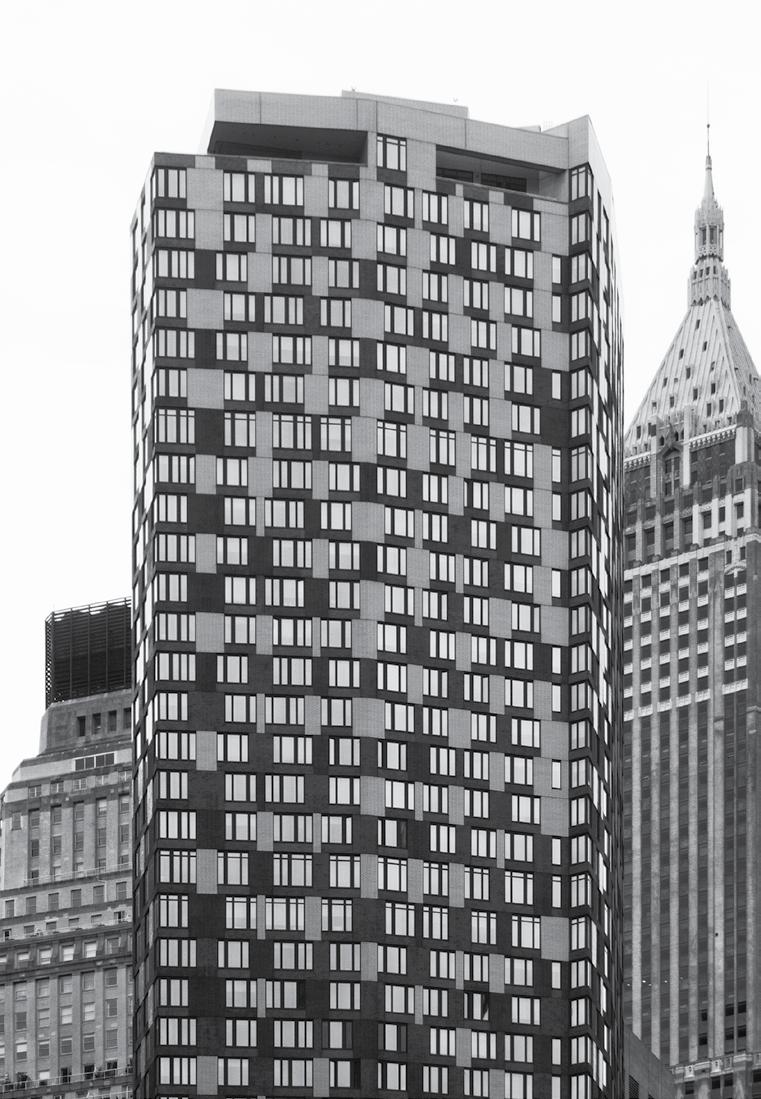
William Beaver House, Tsao & McKown, 20 08, New York
Fig. 60
Rays
Projection
From a n Individual Viewpoint
Note: 120-degree cone of vision at the eye-level viewpoint, used to construct a spatial grid of viewpoints.
61
Rays Projection From a Single Viewpoint in an Open Plan
AR+D Publishing
Note: Image showing how rays are projected from a single viewpoint on the 32nd floor of 17 State Street in New York. Black dots on the graphic represent a spatial grid of viewpoints. From one of these dots, the colored lines represent the type of view element that the ray intersects with in the environment around the building.
Fig.
View Elements in the 3D Model
Buildings in sample
Iconic landmarks and green spaces
Neighboring buildings
Distant views of water and the greater metropolis
AR+D Publishing
Note: The sample includes a variety of structures such as renowned landmarks and parks, adjacent buildings, expansive views of water bodies and the broader metropolitan region, as well as the skyline.
Buildings
market barrier is effectively the long construction time. The project length essentially increases the uncertainty of total project costs and ultimately the uncertainty around the developer’s expected return on equity. However, this additional time required to construct green buildings will reduce with time as both developers and construction companies become more experienced with green building construction.
On the other hand, the higher construction cost elements related to design, fittings, and finishes discourage decision-making developers who must make the upfront payment from their equity.114 Although these cost elements on aggregate represent a small proportion of total costs and are presumably capitalized into the price at which the developer can sell an asset, they accrue to a group of stakeholders making decisions that impact the lifecycle value of the entire building. Importantly, even though design fees are only 3% of overall costs, these fees are investments with a significant risk, since fees are paid during a phase when developers still face fundamental uncertainty regarding the success of their project.
These fees can thus be regarded as the premium a developer has to incur for the option to develop a building. The fact that the results show design fees that are more than 150% higher for the most advanced green buildings reduces the likelihood that developers engage in the option to develop such projects. Fittings and finishes are implemented later in the development process, but if lenders are unwilling to provide additional financing for more sustainable, green buildings, these additional costs might prohibit green construction.
For the first time, we are able to systematically present evidence to show potential barriers to green building adoption, which primarily consist of high upfront design costs and long construction times. However, we can see that the marginal benefits of green construction in the long run outweigh the marginal costs, making a case for green building adoption not only from an environmental sustainability perspective but also from a financial sustainability perspective.
Augmenting the existing quality of a product or process often requires a significant amount of effort, which leads to the “slow diffusion problem” that we see with green building adoption in the building design and construction industry. Changing the way we do things costs time and effort that many building practitioners are unwilling to spend. However, innovation comes in iterative waves as forward-thinking designers and developers continue to create products that disrupt conventional practices which ultimately help move forward the standards and qualities of our products. Eventually, we arrive at a steady state in which new standards are established and acknowledged as accepted practice, and from which the cycle of innovation and disruption repeats. It is important to understand how we move from these innovative design approaches to normalizing them as new standards that could help us solve greater societal challenges such as climate change, an effort that requires a productive coalition between designers, developers, researchers, and policymakers.