3 minute read
direction of axial force application. A displacement rate of

from PEEK as a Potential Material for Dental Implants and its Biomechanical Properties and Osteoblast Cel
by acquire info
![fixture [10]. PEEK has an elastic modulus range from 3 to GPa and has a compound structure that helps to disperse the](https://static.isu.pub/fe/default-story-images/news.jpg)
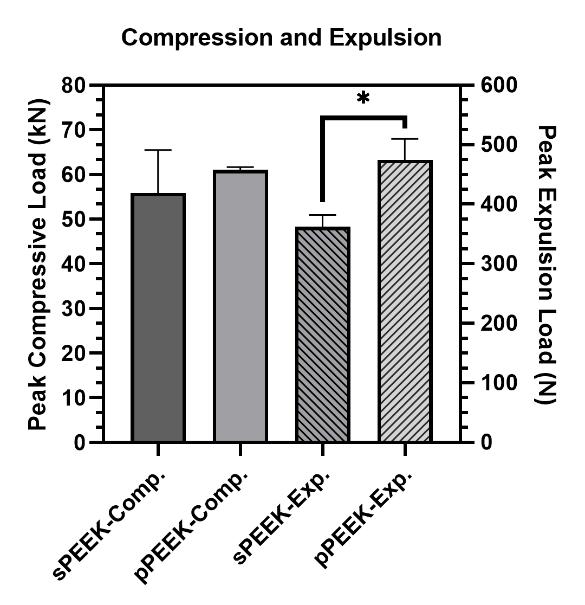
allows it to move easier in the body compared to titanium which has a coefficient of friction of approximately 0.36 [16]. Expulsion testing was completed on the smooth and patterned PEEK in this study to determine if the patterned surface would decrease the ability of the material to move within the body. Expulsion and compression results are shown in Figure 3. Expulsion data shows that the patterned PEEK specimens had a significantly higher peak expulsion load (474 N) over the smooth PEEK specimens (362 N). This indicates that the patterning would have significant mechanical interlocking capabilities in vivo as either a dental or a spinal implant.
Figure 4. Peak loads for compression testing and expulsion testing. The * indicates significant difference of p < 0.05.
Advertisement
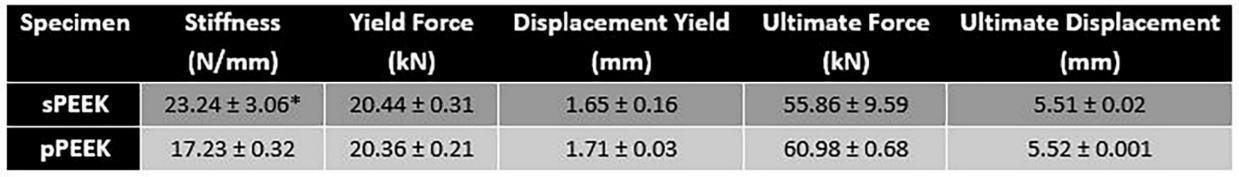
One of the major concerns with metallic implants is the phenomenon of stress shielding due to a mismatch in stiffness of bone and the implant material. PEEK is reported to have a Young’s modulus of elasticity range of 3-8 GPa which is close to that of natural bone [16]. Bone stiffness is a difficult quantitative value to determine because human beings are not homogenous. Differences in age, gender, physical condition, type of bone and many other factors influence the stiffness. The purpose of the compression testing for this research was not to compare the properties of the PEEK material to bone but to compare the properties between the smooth and patterned surfaces. The compression peak load is shown in Figure 3 and the data is tabulated in Table 2. Compression testing data showed similar values between sPEEK and pPEEK indicating that the patterned surface has no significant effect on the overall compression strength of PEEK. Stiffness values for the sPEEK were significantly higher than for pPEEK; however, all values are sufficient for implant use. This decrease in stiffness of the patterned PEEK was hypothesized to come from the initial crushing of the patterned PEEK columns into the valleys of the surface. There were no significant differences found for the force or displacement values at yield and ultimate. This data indicates the patterning on the PEEK surface does not negatively impact the mechanical strength of the material. Another concern for dental implants is the ability of the material to withstand mastication without failure. Mastication has been
shown in the literature to have a wide range of force due to the difficulty of accurately measuring it, differences between different locations in the mouth, and the variability of humans (age, gender, physical ability, etc.) [17]. The range of values measured from strain-gage devices is reported to be in the range of 446 N to 1221 N [17]. The patterned and smooth PEEK samples had yield load values of 20,360 N and 20,440 N, respectively, which are significantly higher than the highest bite force reported.
3.3 In Vitro Characterization
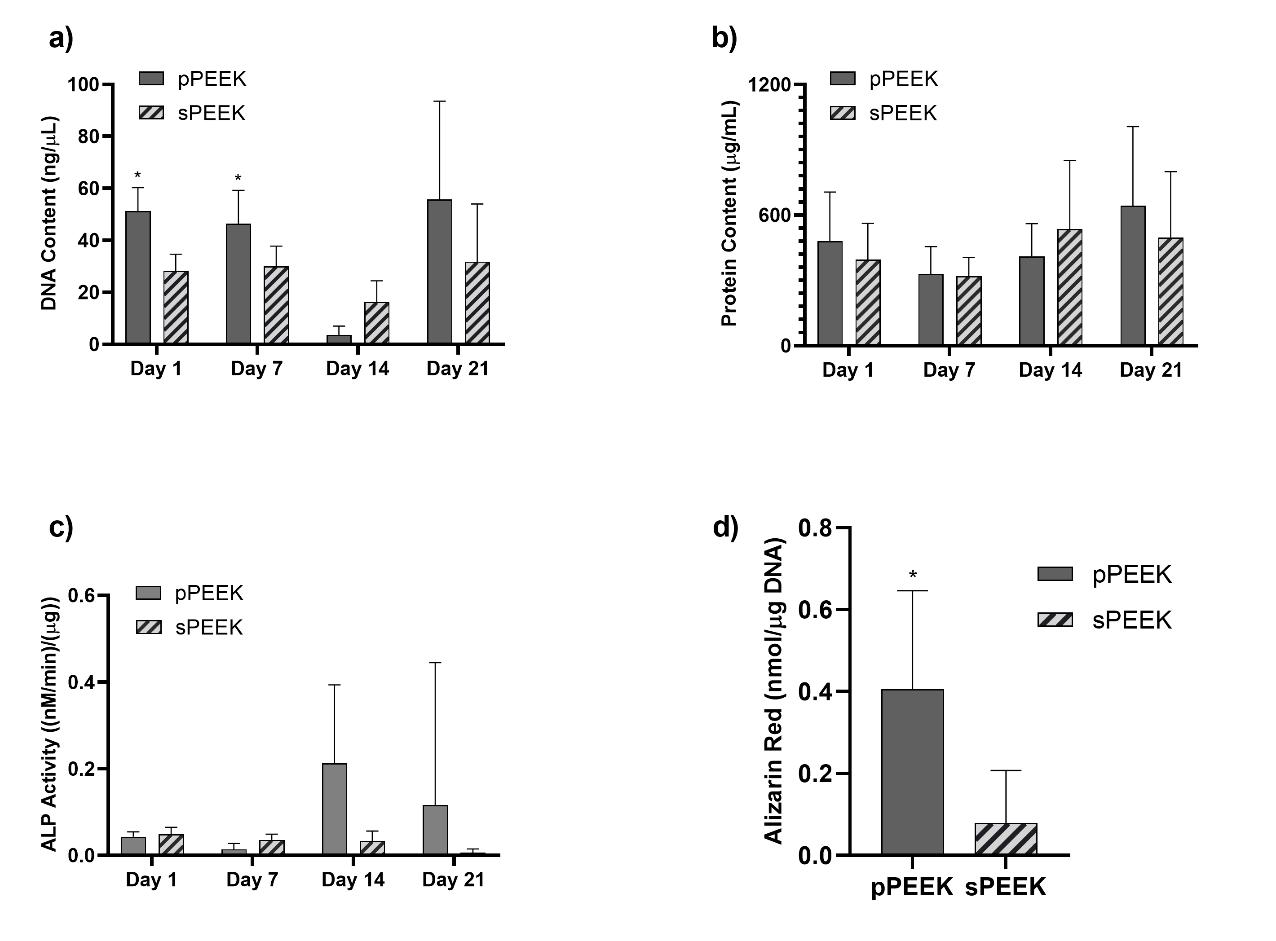
When observing the DNA content data and the live/imaging data, it appears that the solid PEEK specimens were more favorable for cell proliferation and did not readily switch from proliferation to the differentiation phase. This conclusion is corroborated by the images shown below in Figure 4, which represent qualitatively, living cells present on the specimens at day 21. The corresponding images that stain the dead cells red showed very little, if any, dead cells on the specimens (images not shown). This could possibly be attributed to the sPEEK surface, while being hydrophilic in nature with an average contact angle of 40°, was still more hydrophobic than the pPEEK specimens which had complete wetting. Kennedy et al. had similar findings after testing hydrophobic gradient slides, having contact angles ranging from 25° to 95°, that were immersed in human fibronectin [44]. The researchers observed that cell proliferation was higher on the more hydrophobic surfaces after 64 hours [44].
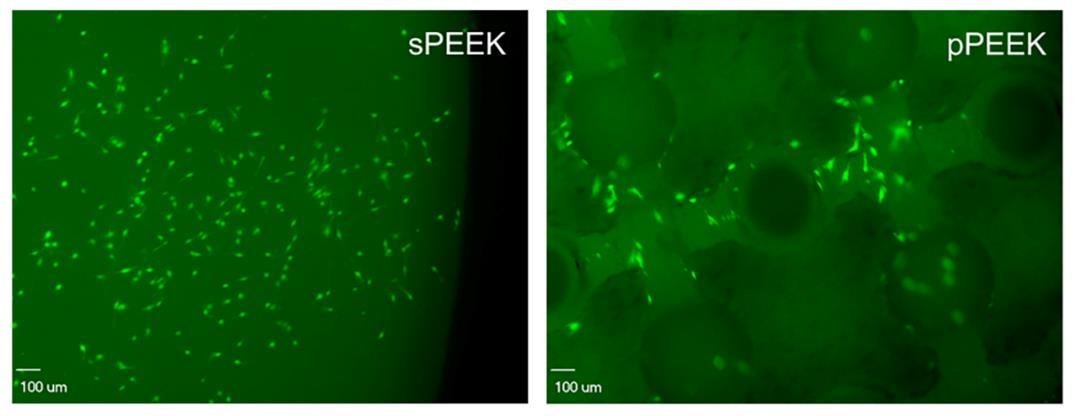
Figure 5. The images shown represent the cells that are alive (green) on each specimen type.
Figure 6. Graph (a) represents data from the DNA assay. Graph (b) shows protein content on each specimen type. Graph (c) shows ALP activity for each specimen. Graph (d) shows total Alizarin Red present on the specimen types. The * indicates significant difference of p < 0.05 for that specific timepoint.