7 minute read
mm and had the following two group configurations

from PEEK as a Potential Material for Dental Implants and its Biomechanical Properties and Osteoblast Cel
by acquire info

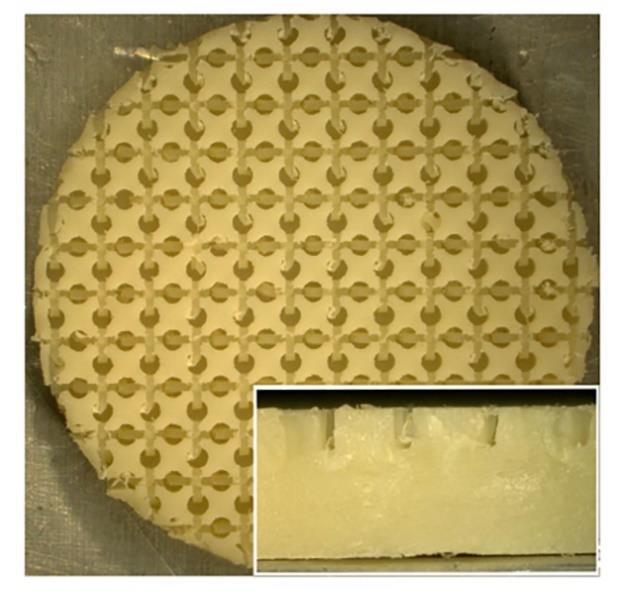
Figure 1. Digital image of the patterned PEEK specimen. Enlarged image is the side view of the specimen.
2.2 Surface Characterization
Advertisement
2.2.1 Atomic Force Microscopy and Roughness Measurements
Atomic Force Microscopy (AFM, Bioscope Catalyst, Bruker, Santa Barbara, CA) was used to determine the surface roughness (Ra) values of the sPEEK specimens. The pPEEK specimen’s machined surfaces had a height differential that was greater than could be measured with the AFM. The 50 µm x 50 µm area scans were acquired in ScanAssyst mode (0.100-0.25 Hz, and 512 samples/line) and analyzed by the Gwyddion software (Version 2.41). The patterned specimens were not able to be scanned using AFM due to their highly tortuous surfaces. Instead, the height of each patterned area was measured using a VHX digital microscope (Keyence Corp., Osaka, Japan), which equates to the roughness of the surface.
2.2.2 Pattern Measurements
The pattern on the pPEEK surface was measured for pore size, channel length, and channel width using a VHX digital microscope (Keyence Corp., Osaka, Japan).
2.2.3 Wettability
Contact angle analysis was conducted on the sPEEK specimens using distilled water to determine the hydrophilicity of the material type. The patterned specimens were tested but due to the surface structure resulted in
complete wettability or the absorption of the water into the pores and channels of the pattern. All measurements were performed at ambient room temperature using 3 µL droplets of distilled water. Images were captured using a VHX digital microscope (Keyence Corp., Osaka, Japan) and water contact angles were analyzed using the Keyence software.
2.3 Mechanical Testing 2.3.1 Expulsion Testing
Expulsion testing was conducted on both patterned and smooth PEEK samples (N = 6) according to ASTM Draft F04.25.02.02 with an MTS (MTS, Eden Prarie, MN) Sintech 2/G Load Frame. An aluminum fixture was manufactured to
hold the sample in between two grade 15 polyurethane foam test blocks. The implant was seated in the polyurethane foam blocks and an axial preload of 500 N was then applied to the construct. The test fixture was then oriented 90° to the
direction of axial force application. A displacement rate of 6 mm/min was applied to a load applicator to the implant forcing it out of the polyurethane foam blocks. The ramp was continued until the foam test blocks fractured at the mounting screw holes before forcing the implant out of the foam blocks or the load continued to lower. Force (N) and displacement (mm) data were recorded. Maximum expulsion force was recorded as the peak force.
2.3.2 Compression Testing
Static compression testing was conducted on both patterned and smooth PEEK samples (N = 6) according to ASTM F2077-17 Test Methods for Intervertebral Body Fusion Devices with an MTS 810 load frame (MTS, Eden Prairie, MN). The static compression samples were tested with stainless steel inserts at a displacement rate of 2 5 mm/min until failure in room temperature air. Load vs. Displacement graphs were produced from the data and stiffness (N/mm),
yield force (N), displacement at yield (mm), ultimate force (N), and ultimate displacement (mm) were calculated.
2.4 In Vitro Characterization
2.4.1 Cell Culture
MC3T3-E1 mouse pre-osteoblastic cells (American Type Culture Collection, Manassas, VA) were maintained and expanded at 37°C and 5% CO2 in alpha-modified Eagle’s minimum essential medium supplemented with, L-glutamine, sodium pyruvate, 10% fetal bovine serum, and 1 % penicillinstreptomycin with the pH adjusted to 7.4. An osteogenic media was made from Dulbecco’s modified eagle medium, 10% fetal bovine serum, 10 nM dexamethasone, 50 mM Lascorbic acid, and 10 mM β-glycerophosphate and 1% penicillin/streptomycin. Approximately 30,000 cells/specimen were seeded and acclimatized for a day. Thereafter, the cell-seeded specimens were supplemented with 1 mL of the osteogenic media every 48 hours of culture for up to 21 days.
2.4.2 Live/Dead Imaging
Cell viability on each specimen surface was imaged on day 21 using a Live/Dead assay kit (ThermoFisher) following manufacture’s protocol. Briefly, the cell-seeded specimens were washed with PBS and incubated with 4 µM EthD-1 and 2 µM calcein AM. The Live/Dead images were captured using an Olympus IX81 (Olympus America, Center Valley, PA) epifluorescence microscope analyzed using Slidebook image analysis software.
2.4.3 Biochemical Analysis
The cells were harvested from the specimens after specific time points: day 1, 7, 14, and 21. At each time point, the specimens were rinsed with PBS and the attached cells were trypsinized, collected, and stored at -80 °C. The collected cells were then lysed by sonicating for 1 min at 10% amplitude. All assays were conducted in triplicates.
2.4.4 Cell Proliferation
The cell proliferation was measured using a DNA quantification assay (CyQUANT™, ThermoFisher) according to the manufacturers’ protocol. A Biotek FLx800 plate reader (Winooski, VT, USA) was used to measure the fluorescence at an excitation wavelength of 460 nm and an emission wavelength of 520 nm.
2.4.5 Cell Differentiation
Cell differentiation was quantified using protein and alkaline phosphatase (ALP) assays. A BCA total protein assay (ThermoFisher Scientific) was used to measure total protein content, and absorbance at 540 nm was measured with a Biotek ELx800 plate reader (Winooski, VT, USA). For ALP quantification a QuantiChrom ALP assay kit (BioAssay Systems, Hayward, CA, USA) was used according to the manufacturers’ protocol. The absorbance was measured at 405 nm using an ELX-800 absorbance plate reader (Biotek, Winooski, VT).
2.4.6 Cell Mineralization
To quantify the amount of calcium deposition on each sample, which verifies maturation and mineralization of the pre-osteoblasts, Alizarin Red staining was utilized on day 21 via osteogenesis quantitation kit (EMD Millipore, Billerica, MA, USA). Initially, the specimens were fixed with 4% paraformaldehyde, followed by incubation in Alizarin Red stain solution for 20 min. The specimens were then washed, and the stained mineral deposits were imaged using a VHX digital microscope (Keyence Corp., Osaka, Japan). For quantifying the mineral deposits, the cell layer was dissolved using acetic acid, and the Alizarin Red stain was extracted. The absorbance was read at 405 nm using an ELX-800 absorbance plate reader.
2.5 Statistical Analysis
Statistical analysis was done using R software, a ShapiroWilk normality test was conducted in order to determine the normality of the data. If the data was normal a Levene’s test was used to determine if the data had equal variances. If the data met all the assumptions, then an ANOVA with Tukey’s post hoc was used and if the data did not meet the assumptions a Kruskal-Wallis rank sum test followed by pairwise comparisons using Wilcoxon rank sum test was used. A pvalue of 0.05 was used as statistical significance. Mechanical testing data was analyzed using a Man-Whitney test in Minitab® .
3. Results and Discussion
3.1 Surface Characterization
The objectives of this study were to determine the difference in mechanical properties between sPEEK and pPEEK and to determine if a macro pattern on PEEK would stimulate
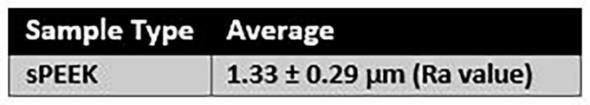
osteoblast mineralization. Atomic Force Microscopy (AFM) and the VHX digital microscope were used to determine the roughness of the sPEEK and pPEEK. The average roughness value of the sPEEK specimens are shown in Table 1. There is an obvious significant height difference seen between the specimens due to the patterning, However, the top surface of the pattern is assumed to have the same roughness as the sPEEK samples given that these patterned surfaces were machined in the same method. The measurements of the
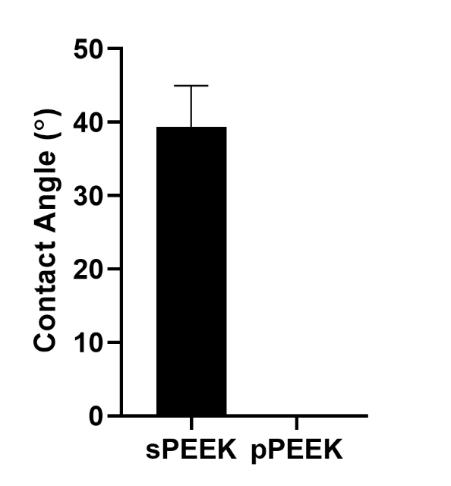
pPEEK pattern were done using the VHX digital microscope and the channel width, length, and the diameter of the circular portion of the pattern were measured. The average diameter was 476.5 4.1 µm and the average width and length were 195 13.8 µm and 608.5 30.4 µm, respectively. Figure 2 shows the wetting angle results for the sPEEK specimens. The sPEEK specimen had an average wetting angle around 40° which indicates a relatively hydrophilic surface. The pPEEK also readily took on water during contact angle testing indicating that the pattern on the surface does not have a high surface tension and has a high wettability. The surface roughness and hydrophilic nature of both PEEK surfaces are within the reported values in the literature for improved osseointegration [41-43].
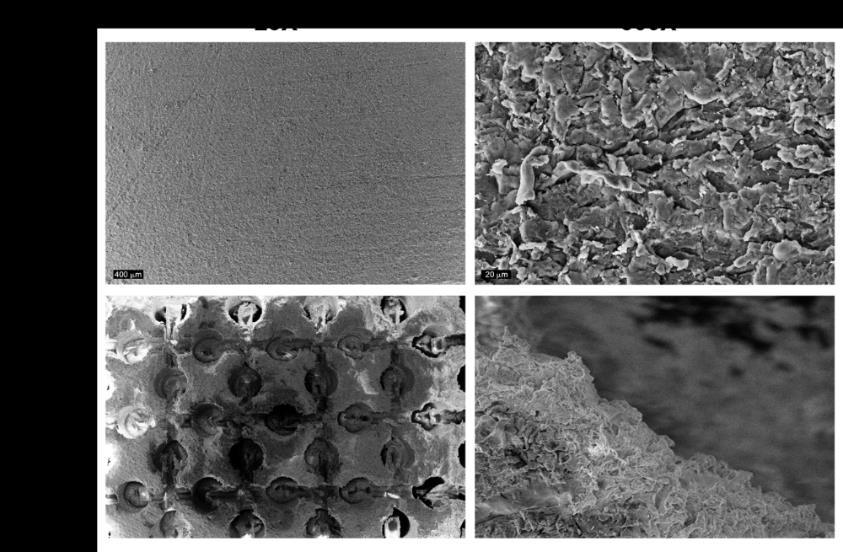
Figure 2. SEM images at 25x and 500x of sPEEK and pPEEK.
Table 1. Roughness value of the sPEEK specimens.
Figure 3. Contact angle analysis done on sPEEK and pPEEK. pPEEK specimen showed complete wettability within the pattern matrix.
3.2 Mechanical Testing
Expulsion testing is typically conducted on spinal implant body materials to measure the ability of the implant to resist movement in the body. The resistance of the implant to move is a combination of several variables including implant design, surface roughness, and the material’s coefficient of friction. Non-modified PEEK (smooth surface) has a low coefficient of friction of approximately 0.10 - 0.17, which

