O‘ahu Home Sales Maintain Stable Trend Through First Half of 2024 Single-family home sales rose 6.7% in the first half of 2024, while condo sales fell by 5.8%
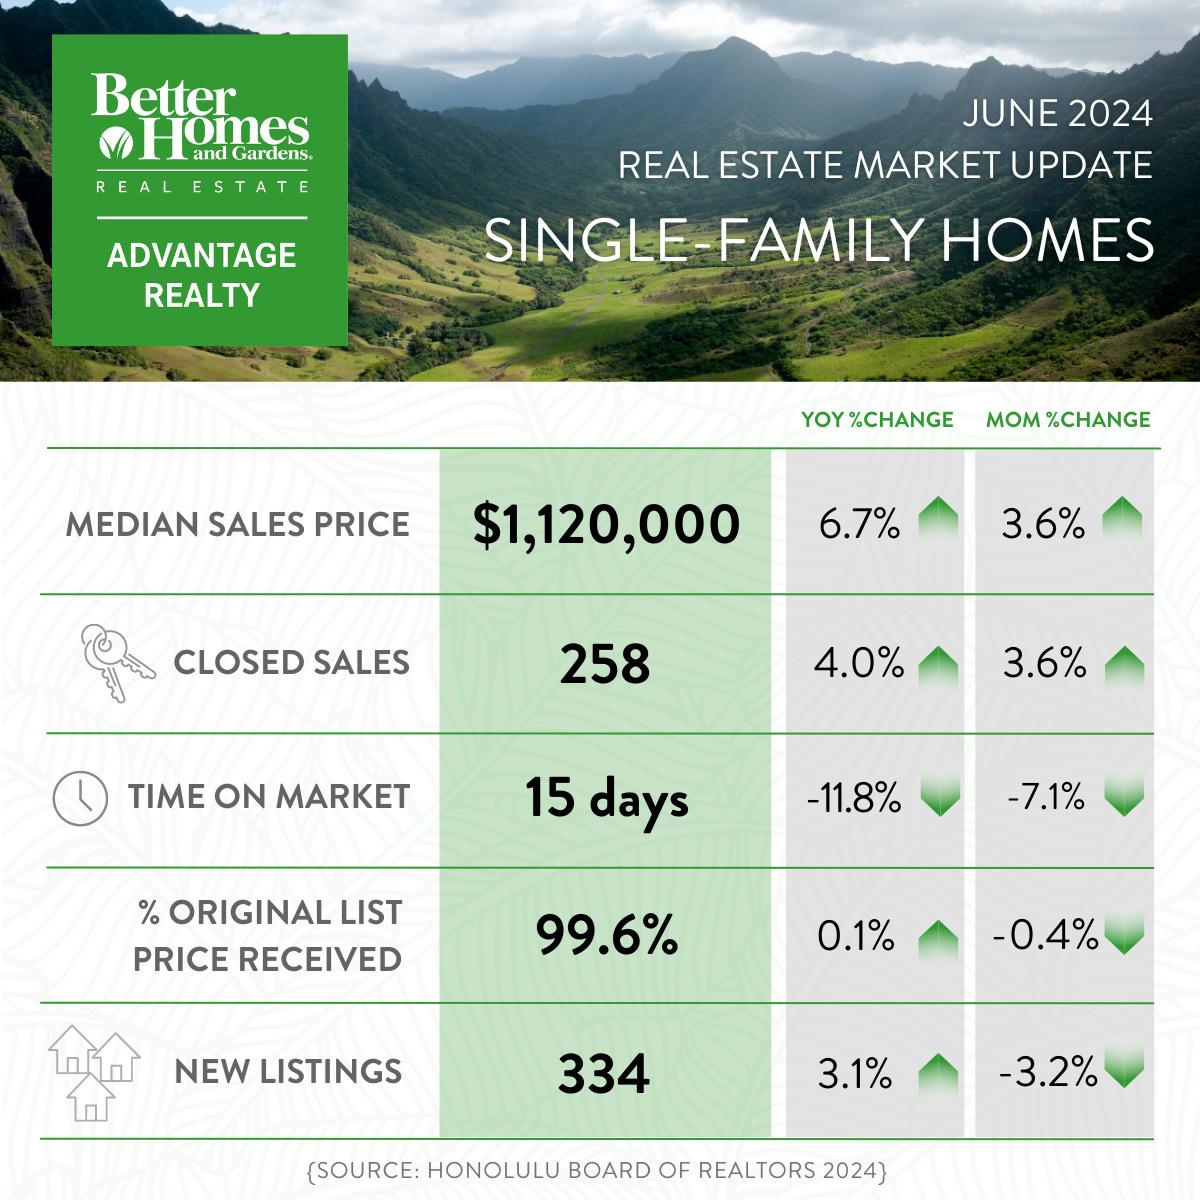
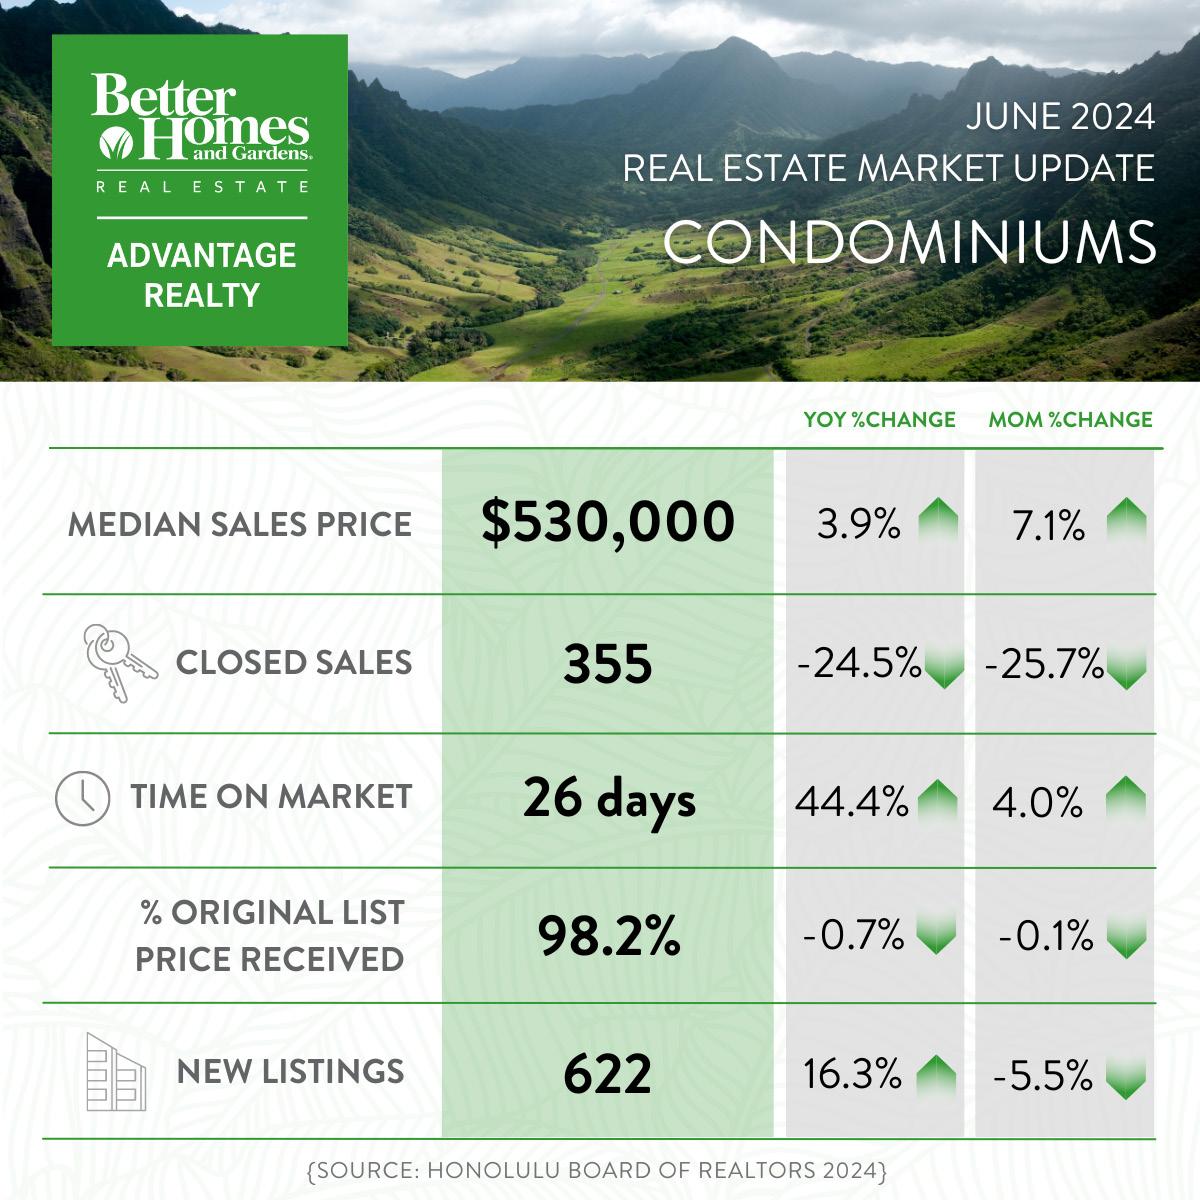
June saw a modest increase in single-family home sales, up by 4% year-over-year, totaling 258 transactions. However, June condo sales experienced the largest year-over-year decline this year, dropping 24.5% from last year, with 355 units sold. In the first half of the year, single-family home sales grew 6.7% compared to the same period in 2023, while condo sales declined by 5.8%.
Median sale prices for single-family homes and condos increased modestly year-over-year, with single family homes reaching $1,120,000 and condos ending June at $530,000, up by 6.7% and 3.9%, respectively. Year-to-date, median sales prices saw moderate changes from a year ago. The single-family home year-to-date median price rose by 3.3% to $1,085,000, while condos experienced 2.0% uptick to $510,000 compared to the previous year.
“While O’ahu’s residential real estate market has remained relatively stable through the first half of the year, we saw a significant drop in condo sales last month, which the threat of rising insurance costs may have influenced,” said the president of the Honolulu Board of Realtors. “As our community seeks opportunities to increase inventory, affordability and housing opportunities for all, buyers and sellers can benefit from working with a trusted REALTOR who can guide them through the complexities of the real estate market.”
Single-family homes moved swiftly, marked by a median of 15 days on the market, compared to 17 days in June 2023. In contrast, condos took longer to sell, with a median days on market of 26 days, up from 18 days last year.
There were 334 new single-family home listings and 622 new listings in the condos market, marking 3.1% and 16.3% year-over-year increases, respectively. Year-to-date, both markets saw new listings rise by 10.5% for single-family homes and 16.8% for condos compared to last year.
Source: Honolulu Board of Realtors
Source: Honolulu Board of Realtors
Oahu Monthly Housing Statistics *seefootnotesonpages9-12regardingmethodologyupdatesYoY%chg=year-over-yearpercentchangecomparingcurrentmonthtothesamemonthlastyear. MoM%chg=month-over-monthpercentchangecomparingcurrentmonthtothepreviousmonth.
*seefootnotesonpages9-12regardingmethodologyupdates1-yr%chg=percentchangecomparingthecurrentYTDtimeperiodtothesameYTDtimeperiodoneyearago. 2-yr%chg=percentchangecomparingthecurrentYTDtimeperiodtothesameYTDtimeperiodtwoyearsago.
Single-Family Homes
Condos
Single-Family Homes
Condos
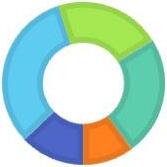
Single-Family Homes Sold June 2024
OAHU, HAWAII
(Acountofpropertiesthathaveclosedinagivenmonth)
Mo-Yr
Single-Family HomesCondosTotal
Jun-214517301,181
Jul-214046711,075
Aug-214256751,100
Sep-214246151,039
Oct-21381611992
Nov-21371601972
Dec-21378593971
Jan-22326552878
Feb-22241486727
Mar-22321672993
Apr-223656721,037
May-223446881,032
Jun-22357626983
Jul-22312518830
Aug-22314508822
Sep-22278496774
Oct-22222435657
Nov-22192340532
Dec-22202360562
Jan-23150275425
Feb-23173325498
Mar-23236444680
Apr-23208420628
May-23262438700JuneSFHYoY%chgCNDYoY%chgJuneYTDSFHYoY%chgYTDCNDYoY%chg
Jun-232484707182022357-20.8%626-14.2%20221,954-8.8%3,6967.5% Jul-232244226462023248-30.5%470-24.9%20231,277-34.6%2,372-35.8% Aug-23252422674
Sep-23232376608
Oct-23213399612
Nov-23180310490
Dec-23182272454
Jan-24184292476
Feb-24179334513
Mar-24230344574
Apr-24262431693
June 2024 OAHU, HAWAII (Themediansalespriceofallclosedpropertiesinagivenmonth)
Mo/Yr Single-Family HomesCondos
Jun-21$979,000$460,000
Jul-21$992,500$475,000
Aug-21$1,050,000$500,000
Sep-21$1,050,000$478,000
Oct-21$1,000,000$500,000
Nov-21$1,050,000$500,000
Dec-21$1,050,000$485,000
Jan-22$1,050,000$510,000
Feb-22$1,125,000$497,000
Mar-22$1,150,000$515,500
Apr-22$1,105,000$510,000
May-22$1,153,500$516,500
Jun-22$1,100,000$534,000
Jul-22$1,107,944$500,000
Aug-22$1,125,500$498,500
Sep-22$1,100,000$502,500
Oct-22$1,050,000$520,000
Nov-22$1,149,500$480,000
Dec-22$1,049,500$502,500
Jan-23$970,000$495,000
Feb-23$987,000$480,000
Mar-23$1,083,750$536,000
Apr-23$999,995$500,000
May-23$1,109,000$505,000JuneSFHYoY%chgCNDYoY%chgJuneYTDSFHYoY%chgYTDCNDYoY%chg
Jun-23$1,050,000$510,0002022$1,100,00012.4%$534,00016.1%2022$1,111,21117.0%$515,00013.2%
Jul-23$1,090,000$500,0002023$1,050,000-4.5%$510,000-4.5%2023$1,050,000-5.5%$500,000-2.9%
Aug-23$1,110,000$515,000
Sep-23$1,050,000$532,500
Oct-23$1,100,000$515,000
Nov-23$1,100,055$516,179
Dec-23$996,500$510,000
Jan-24$1,021,016$502,500
Feb-24$1,075,000$512,500
Mar-24$1,100,000$500,000
Apr-24$1,100,000$528,000
May-24$1,085,000$495,000
Jun-24$1,120,000$530,000
Median Sales Price
Single-Family Homes Condos
June 2024
OAHU, HAWAII (Theaveragesalespriceofallclosedpropertiesinagivenmonth)
Mo/Yr Single-Family HomesCondos
Jun-21$1,225,011$557,302
Jul-21$1,265,382$544,064
Aug-21$1,316,681$618,612
Sep-21$1,289,510$558,002
Oct-21$1,335,171$582,509
Nov-21$1,296,551$559,007
Dec-21$1,303,481$604,749
Jan-22$1,277,309$623,928
Feb-22$1,486,088$583,367
Mar-22$1,570,668$623,684
Apr-22$1,404,481$613,189
May-22$1,450,008$625,327
Jun-22$1,382,559$631,822
Jul-22$1,329,023$590,934
Aug-22$1,341,958$547,319
Sep-22$1,307,249$607,502
Oct-22$1,243,960$676,988
Nov-22$1,387,685$594,444
Dec-22$1,325,156$576,689
Jan-23$1,139,294$633,441
Feb-23$1,427,864$592,131
Mar-23$1,391,538$651,630
Apr-23$1,223,383$603,795 Monthly Average Sales Price
Average Sales Price
Year-to-Date
May-23$1,355,804$623,748JuneSFHYoY%chgCNDYoY%chgJuneYTDSFHYoY%chgYTDCNDYoY%chg
Jun-23$1,300,456$589,5972022$1,382,55912.9%$631,82213.4%2022$1,429,89119.9%$618,08215.2%
Jul-23$1,270,421$617,6832023$1,300,456-5.9%$589,597-6.7%2023$1,315,465-8.0%$614,681-0.6%
Aug-23$1,427,996$628,127 2024$1,282,503-1.4%$690,80317.2%
Sep-23$1,357,981$608,222
Oct-23$1,304,757$670,805
Nov-23$1,434,999$676,625
Dec-23$1,207,793$602,535
Jan-24$1,323,172$593,630
Feb-24$1,437,693$580,274
Mar-24$1,380,838$579,500
Apr-24$1,408,991$617,664
May-24$1,419,039$592,964
Jun-24$1,282,503$690,803
Single-Family Homes Condos
Median Days on Market June 2024
OAHU, HAWAII
(DaysonMarketrepresentsthenumberofdaysfromwhenapropertyisfirstlistedtowhenanofferisaccepted;theMedianDaysonMarketrepresentsthemedianofallsalesinagivenmonth)
Mo/Yr Single-Family HomesCondos
Jun-21811
Jul-21911
Aug-21912
Sep-21911
Oct-211011
Nov-21119
Dec-211113
Jan-221214
Feb-221314
Mar-2299
Apr-221012
May-221010
Jun-221011
Jul-221112
Aug-221313
Sep-221814
Oct-221919
Nov-221818
Dec-222521
Jan-232424
Feb-234728
Mar-233624
Apr-232420
Median Days on Market
Single-Family Homes Condos
Percent of Original List Price Received
June 2024
OAHU, HAWAII
(Thepercentagefoundwhendividingaproperty'ssalespricebytheoriginallistprice;reportedpercentageisthemedianofallsalesfortheperiodindicated)
Mo/Yr Single-Family HomesCondos
Jun-21104.2%100.0%
Jul-21103.9%100.0%
Aug-21103.0%100.0%
Sep-21103.1%100.0%
Oct-21102.2%100.0%
Nov-21102.2%100.0%
Dec-21102.1%100.0%
Jan-22101.6%100.0%
Feb-22100.8%100.0%
Mar-22102.0%100.0%
Apr-22102.6%100.0%
May-22102.2%100.0%
Jun-22102.0%100.0%
Jul-22100.0%100.0%
Aug-22100.0%100.0%
Sep-2299.2%100.0%
Oct-2299.8%99.0%
Nov-2298.4%98.8%
Dec-2296.7%98.5%
Jan-2395.9%98.4%
Feb-2396.0%98.0%
Mar-2396.7%98.5%
Apr-2398.3%98.7%
Percent of Original List Price Received
May-2398.7%99.0%JuneSFHYoY%chgCNDYoY%chgJuneYTDSFHYoY%chgYTDCNDYoY%chg
Jun-2399.5%98.9%2022102.0%-2.1%100.0%0.0%2022101.9%0.6%100.0%0.0% Jul-23100.0%98.8%202399.5%-2.5%98.9%-1.1%202397.9%-3.9%98.6%-1.4%
Aug-2399.1%99.6%
Sep-2399.0%98.8%
Oct-2398.0%98.7% Nov-2397.1%98.0%
Single-Family Homes Condos
New Listings June 2024
OAHU, HAWAII
(Acountofpropertiesthathavebeennewlylistedonthemarketinagivenmonth)
Mo-Yr
Single-Family HomesCondosTotal
Jun-214827841,266
Jul-214696641,133
Aug-214607211,181
Sep-214127381,150
Oct-213767171,093
Nov-21358639997
Dec-21245527772
Jan-22320666986
Feb-223677391,106
Mar-224127141,126
Apr-224247221,146
May-224456871,132
Jun-223916861,077
Jul-223866161,002
Aug-22381608989
Sep-22304601905
Oct-22285532817
Nov-22289526815
Dec-22164371535
Jan-23268523791
Feb-23233463696
Mar-23293530823
Apr-23292532824
May-23309582891JuneSFHYoY%chgCNDYoY%chgJuneYTDSFHYoY%chgYTDCNDYoY%chg Jun-233245358592022391-18.9%686-12.5%20222,359-5.5%4,2141.1% Jul-232755217962023324-17.1%535-22.0%20231,719-27.1%3,165-24.9% Aug-23330549879
Oct-23272566838
Nov-23267457724
Dec-23180349529
Jan-24285581866
Feb-24295533828
Mar-24291647938
Apr-243496561,005 May-243456581,003 Jun-24334
Pending Sales* June 2024
OAHU, HAWAII
(Ameasureofcontractactivityrepresentedbyacountofpropertiesthathavehadoffersacceptedonthemduringagivenmonth)
Mo/Yr
Single-Family HomesCondosTotal
Jun-214226661,088
Jul-214336581,091
Aug-214156171,032
Sep-213986291,027
Oct-214006301,030
Nov-21367573940
Dec-21287511798
Jan-22315574889
Feb-22316643959
Mar-223846911,075
Apr-223666631,029
May-22356601957
Jun-22305501806
Jul-22297484781
Aug-22312475787
Sep-22224436660
Oct-22198342540
Nov-22198359557
Dec-22168289457
Jan-23267378645
Feb-23217399616
Mar-23258444702
Apr-23271438709
May-23258507765JuneSFHYoY%chgCNDYoY%chgJuneYTDSFHYoY%chgYTDCNDYoY%chg Jun-232314156462022305-27.7%501-24.8%20222,042-13.7%3,673-4.7% Jul-232474216682023231-24.3%415-17.2%20231,502-26.4%2,581-29.7%
Aug-23267425692
Nov-23174308482
Dec-23182290472
*Methodologyupdatedasof2021toreflectacountofpropertiesthatenteredcontractwithinthegivenmonthandremaininesc
PendingSales,inreportspriorto2021,reflectacountofalllistingsthatheldaPending(P)statusthroughoutthegivenmonth.
Active Inventory* June 2024
OAHU, HAWAII
(ThenumberofpropertiesinActive(A)statusattheendofthegivenmonth)
Mo/Yr
Single-Family HomesCondosTotal
Jun-213771,0251,402
Jul-214159691,384 Aug-214169501,366 Sep-214371,0301,467 Oct-214011,0391,440 Nov-213661,0331,399 Dec-213099461,255 Jan-223119671,278 Feb-223489891,337 Mar-223609191,279 Apr-223959171,312 May-224719391,410 Jun-225279981,525 Jul-225761,0501,626 Aug-225961,0731,669 Sep-226291,1411,770 Oct-226561,1941,850 Nov-226821,2441,926
Dec-225971,1701,767 Active Inventory
Jan-235511,1961,747JuneSFHYoY%chgCNDYoY%chg
Feb-235471,1771,724202252739.8%998-2.6% Mar-235411,1521,693202360514.8%1,15916.1% Apr-235351,1441,679
May-235431,1181,661 Jun-236051,1591,764 Jul-235911,1541,745 Aug-235981,1461,744 Sep-235921,1941,786 Oct-236261,3061,932 Nov-236721,3372,009 Dec-236001,2341,834 Jan-246071,3481,955 Feb-245991,3881,987
Mar-245811,4932,074 Apr-246181,5762,194 May-246401,6512,291 Jun-24653 1,729 2,382
*Indicatormodifiedasof2021toreflectActivestatuslistingsonlyandappliedtohistoricalmonthlydatashownabove.Prev
Active Inventory
Homes + Condos
Homes Condos
June 2024
OAHU, HAWAII
(Thenumberofpropertiesundercontractattheendofthegivenmonth/combinedlistingsinCandPstatus)
Mo/Yr
Single-Family HomesCondosTotal
Jun-217541,0681,822
Jul-217351,0261,761
Aug-217279791,706
Sep-216609511,611
Oct-216639351,598
Nov-216378991,536
Dec-215287841,312
Jan-224987971,295
Feb-225449461,490
Mar-226039801,583
Apr-225929561,548
May-225838561,439
Jun-225097281,237
Jul-224796761,155
Aug-224626541,116
Sep-22388590978
Oct-22345506851
Nov-22319512831
Dec-22278430708
Jan-23376523899JuneSFHYoY%chgCNDYoY%chg
Feb-233865929782022509-32.5%728-31.8%
Mar-233936029952023370-27.3%612-15.9%
Apr-234356231,058
May-234186861,104
Jun-23370612982
Jul-23383586969
Aug-23391590981
Sep-23383569952
Oct-23333475808
Nov-23312473785
Dec-23305468773
Jan-24334532866
Feb-244165861,002
Mar-244486471,095
Apr-244456471,092
May-244405931,033
Jun-24433 607 1,040 *Newindicatoraddedtoreportsasof2021,includingapplicablehistoricaldata.
Total Inventory In Escrow
Single-Family Homes Condos
Total Inventory In Escrow Single-Family Homes + Condos
Single-Family Homes Condos
Months Supply of Active Inventory*
June 2024
OAHU, HAWAII
(Comparesactiveinventorytoarolling12-monthaverageclosedsales)
Mo/Yr
Single-Family HomesCondos
Jun-211.02.0
Jul-211.11.8
Aug-211.11.7
Sep-211.21.8
Oct-211.11.8
Nov-211.01.7
Dec-210.81.6
Jan-220.81.6
Feb-220.91.6
Mar-221.01.5
Apr-221.11.5
May-221.31.5
Jun-221.51.6
Jul-221.61.7
Aug-221.71.8
Sep-221.92.0
Oct-222.12.1
Nov-222.22.3
Dec-222.12.2
Jan-232.02.4JuneSFHYoY%chgCNDYoY%chg
Feb-232.02.420221.550.0%1.6-20.0%
May-232.22.6
Jun-232.62.8
Jul-232.62.8
Aug-232.72.8
Sep-232.73.0
Oct-232.93.3
Nov-233.13.4
Dec-232.83.2
Jan-242.83.5
Feb-242.83.6
Mar-242.74.0
Apr-242.84.2
May-242.94.4
Jun-243.0 4.7
*Methodologyupdatedasof2021(alsoappliedtohistoricaldatashownonthischart). MonthsofInventory,inreportspriorto2021,reflectacomparisonofactivelistingstoaveragependingsales.
Months Supply of Active Inventory
Single-Family Homes Condos
$700,000 - $799,999 1821-14.3%23230.0%98.9%99.7%-0.8%1719-10.5%232015.0%44424.8%38358.6%2.32.19.5%
$800,000 - $899,999 3144-29.5%2123-8.7%98.8%99.1%-0.3%3052-42.3%2435-31.4%5869-15.9%5255-5.5%1.92.1-9.5%
$900,000 - $999,999 3234-5.9%1122-50.0%100.0%98.5%1.5%443622.2%333010.0%5461-11.5%49458.9%2.02.00.0%
$1,000,000 - $1,499,999 1067149.3%1417-17.6%100.0%99.5%0.5%12210615.1%857513.3%17315511.6%14411426.3%2.31.921.1%
$1,500,000 - 1,999,999 2537-32.4%11110.0%100.0%100.0%0.0%504219.0%382835.7%1088527.1%544617.4%4.03.129.0%
$2,000,000 - $2,999,999 1819-5.3%1719-10.5%99.0%93.0%6.5%21210.0%1217-29.4%725044.0%2228-21.4%4.83.154.8% $3,000,000 and above 9728.6%141040.0%100.0%96.1%4.1%342254.5%11922.2%1111019.9%241471.4%12.311.29.8% All Single-Family Homes2582484.0%1517-11.8%99.6%99.5%0.1%3343243.1%2532319.5%6536057.9%43337017.0%3.02.615.4%
$300,000 - $399,999 5479-31.6%3814171.4%97.4%98.6%-1.2%1068327.7%6272-13.9%266122118.0%101992.0%4.51.7164.7%
$400,000 - $499,999 6282-24.4%251478.6%98.1%100.0%-1.9%1078328.9%736512.3%29015192.1%1069412.8%4.72.1123.8%
$500,000 - $599,999 4470-37.1%2912141.7%99.8%100.0%-0.2%99918.8%5963-6.3%23113669.9%94878.0%4.32.295.5%
$600,000 - $699,999 3567-47.8%22220.0%99.2%98.4%0.8%5573-24.7%4163-34.9%13311614.7%6581-19.8%3.12.429.2%
$700,000 - $999,999 6869-1.4%1922-13.6%99.4%99.0%0.4%1038127.2%55525.8%25019329.5%8891-3.3%4.02.937.9%
$1,000,000 - $1,499,999 302615.4%403129.0%95.7%95.5%0.2%38365.6%231735.3%16211639.7%402560.0%8.15.839.7%
$1,500,000 - $1,999,999 880.0%3654-33.3%96.3%95.0%1.4%211190.9%10666.7%815839.7%16977.8%11.68.339.8%
Closed Sales by Price Range: Single-Family Homes June 2024 OAHU, HAWAII
(Acountofpropertiesthathaveclosedinagivenmonth)
$450,000-$599,999103233.3%696113.1%
$600,000-$699,9999812.5%1171106.4% $700,000-$799,9991821-14.3%226237-4.6%
$800,000-$899,9993144-29.5%376400-6.0%
$900,000-$999,9993234-5.9%326366-10.9%
$1,000,000-$1,499,9991067149.3%892975-8.5%
$1,500,000-1,999,9992537-32.4%323324-0.3%
$2,000,000-$2,999,9991819-5.3%179187-4.3%
$3,000,000andabove9728.6%1101063.8%
Sales by Price Range 12-mth Period: Single-Family
Closed Sales by Price Range: Condos June 2024 OAHU, HAWAII
(Acountofpropertiesthathaveclosedinagivenmonth)
$149,999andbelow121020.0%156165-5.5%
$150,000-$299,9993455-38.2%504612-17.6%
$300,000-$399,9995479-31.6%707841-15.9% $400,000-$499,9996282-24.4%744868-14.3%
$500,000-$599,9994470-37.1%650740-12.2%
$600,000-$699,9993567-47.8%519587-11.6%
$700,000-$999,9996869-1.4%746794-6.0%
$1,000,000-$1,499,999302615.4%2452450.0%
$1,500,000-$1,999,999880.0%7987-9.2%
$2,000,000andabove84100.0%8590-5.6% All Condos
Median Days on Market by Price Range: Single-Family Homes
June 2024
OAHU, HAWAII (Themediannumberofdaysfromwhenapropertyisfirstlistedtowhenanofferisaccepted)
$449,999andbelow-32-2612116.7%
$450,000-$599,9992124-12.5%352825.0% $600,000-$699,999392095.0%342630.8%
Median Days on Market by Price Range
$900,000-$999,9991122-50.0%191711.8%
$1,000,000-$1,499,9991417-17.6%1517-11.8%
$1,500,000-1,999,99911110.0%191346.2% $2,000,000-$2,999,9991719-10.5%1216-25.0%
$3,000,000andabove141040.0%3242-23.8%
Median Days on Market by Price Range 12-mth Period: Single-Family Homes
Median Days on Market by Price Range: Condos June 2024
OAHU, HAWAII (Themediannumberofdaysfromwhenapropertyisfirstlistedtowhenanofferisaccepted)
$150,000-$299,999281855.6%271942.1%
$700,000-$999,9991922-13.6%20200.0%
$1,000,000-$1,499,999403129.0%32313.2%
Median Percent of Original List Price Received by Price Range: Single-Family Homes June 2024
OAHU, HAWAII (Thepercentagefoundwhendividingaproperty'ssalespricebytheoriginallistprice;reportedpercentageisthemedianofallsalesfortheperiodandpricerangeindicated)
Median Percent of Original List Price Received by Price Range 1-mth Period: Single-Family
$449,999andbelow-95.6%-93.3%100.0%-6.7%
$700,000-$799,99998.9%99.7%-0.8%98.2%98.2%0.0%
$800,000-$899,99998.8%99.1%-0.3%98.8%98.8%0.0%
$1,000,000-$1,499,999100.0%99.
Median Percent of Original List Price Received by Price Range 12-mth Period: Single-Family Homes
Median Percent of Original List Price Received by Price Range: Condos June 2024
OAHU, HAWAII (Thepercentagefoundwhendividingaproperty'ssalespricebytheoriginallistprice;reportedpercentageisthemedianofallsalesfortheperiodandpricerangeindicated)
Median Percent of Original List Price Received by Price Range 1-mth Period: Condos Jun-24 Jun-23
$149,999andbelow95.0%89.
$400,000-$499,99998.1%100.0%-1
$500,000-$599,99999.8%100.0%-0
$700,000-$999,99999.4%99.0%0.4%98.9%98.9%0.0%
$1,000,000-$1,499,99995.7%95.5%0.2%96.3%96.2%0.1%
Median Percent of Original List Price Received by Price Range 12-mth Period: Condos
This12-monthperiodreflectstheconsecutive12-monthperiodupthroughthecurrentmonth,whilelastperiod reflectsthesame12-monthperiodoneyearprior.
New Listings by Price Range: Single-Family Homes June 2024
OAHU, HAWAII (Acountofpropertiesthathavebeennewlylistedonthemarketinagivenmonth)
$450,000-$599,999210-80.0%837116.9%
New Listings by Price Range 12-mth Period: Single-Family Homes 12-mth Total This Period 12-mth Total Last Period
$1,000,000-$1,499,99912210615.1%1,1091,1000.8%
New Listings by Price Range: Condos OAHU, HAWAII (Acountofpropertiesthathavebeennewlylistedonthemarketinagivenmonth)
$150,000-$299,999675326.4%695737-5.7%
$700,000-$999,9991038127.2%1,0951,0682.5% $1,000,000-$1,499,99938365.6%44939613.4%
Pending Sales by Price Range: Single-Family Homes June 2024
OAHU, HAWAII (Ameasureofcontractactivity/acountofpropertiesthathavehadoffersacceptedontheminagivenmonth)
$449,999andbelow31200.0%352825.0%
$450,000-$599,999103233.3%916540.0%
$900,000-$999,999333010.0%359380-5.5%
$1,000,000-$1,499,999857513.3%935966-3.2%
$1,500,000-1,999,999382835.7%35031212.2%
$2,000,000-$2,999,9991217-29.4%169190-11.1%
$3,000,000andabove11922.2%117121-3.3%
Pending Sales by Price Range 12-mth Period: Single-Family Homes
Pending Sales by Price Range: Condos June 2024
OAHU, HAWAII (Ameasureofcontractactivity/acountofpropertiesthathavehadoffersacceptedontheminagivenmonth)
$149,999andbelow918-50.0%146166-12.0%
$150,000-$299,99949490.0%515605-14.9%
$300,000-$399,9996272-13.9%754850-11.3%
$400,000-$499,999736512.3%794869-8.6%
$500,000-$599,9995963-6.3%7096952.0%
$600,000-$699,9994163-34.9%530606-12.5%
$700,000-$999,99955525.8%747754-0.9%
$1,000,000-$1,499,999231735.3%2402304.3%
$1,500,000-$1,999,99910666.7%8396-13.5%
$2,000,000andabove410-60.0%7795-18.9%
List Price Pending Sales by Price Range 12-mth Period: Condos
Inventory by Price Range
$449,999andbelow35-40.0%
$450,000-$599,999813-38.5%
$600,000-$699,9992224-8.3%
$700,000-$799,99944424.8%
$800,000-$899,9995869-15.9%
$900,000-$999,9995461-11.5%
$1,000,000-$1,499,99917315511.6%
$1,500,000-1,999,9991088527.1%
$2,000,000-$2,999,999725044.0%
$3,000,000andabove1111019.9%
and above
List Price
status.
$599,999 and below
$600,000 to $799,999
$800,000 to $999,999
$1,000,000 to $1,999,999
$2,000,000 and above
JUN-23
$599,999 and below
$600,000 to $799,999
$800,000 to $999,999
$1,000,000 to $1,999,999
$2,000,000 and above
$149,999andbelow4345-4.4%
$150,000-$299,99918013236.4%
$300,000-$399,999266122118.0%
$400,000-$499,99929015192.1%
$1,500,000-$1,999,999815839.7%
$2,000,000andabove93903.3%
status.
$299,999 and below
$300,000 to $499,999
$500,000 to $699,999
$700,000 to $1,499,999
$1,500,000 and above
JUN-23
$299,999 and below
$300,000 to $499,999
$500,000 to $699,999
$700,000 to $1,499,999
$1,500,000 and above
$599,999
$600,000 to $799,999
$800,000 to $999,999
$1,000,000 to $1,999,999
$2,000,000 and above
$299,999 and below
$300,000 to $499,999
$500,000 to $699,999
$700,000 to $1,499,999
$1,500,000 and above
$299,999 and below 199188176184183189185179185183182184177177170180196177152186185205210217223 $300,000
iousreportindicator,referredtoasActiveListings,reflectedallactivelymarketedlistingsinAandCstatus.
OAHU, HAWAII (Thenumberofpropertiesinanescrowstatusattheendofagivenmonth) Single-Family HomesJun-24Jun-23YOY chg
$449,999andbelow102400.0%
$450,000-$599,999201266.7%
$600,000-$699,99920195.3%
$700,000-$799,99938358.6%
$800,000-$899,9995255-5.5%
$900,000-$999,99949458.9%
$1,000,000-$1,499,99914411426.3%
$1,500,000-1,999,999544617.4%
$2,000,000-$2,999,9992228-21.4%
$3,000,000andabove241471.4%
Inventory In Escrow by Price Range
and above
JUN-23
$599,999 and below
$600,000 to $799,999
$800,000 to $999,999
$1,000,000 to $1,999,999
$2,000,000 and above
$599,999 and below
$600,000 to $799,999
$800,000 to $999,999
$1,000,000 to $1,999,999
$2,000,000 and above
(Thenumberofpropertiesinanescrowstatusattheendofagivenmonth)
Jun-24Jun-23YOY chg
$149,999andbelow1627-40.7%
$150,000-$299,9997381-9.9%
$300,000-$399,999101992.0%
$400,000-$499,9991069412.8%
$500,000-$599,99994878.0%
$600,000-$699,9996581-19.8%
$700,000-$999,9998891-3.3%
$1,000,000-$1,499,999402560.0%
$1,500,000-$1,999,99916977.8%
$2,000,000andabove818-55.6%
List Price Total Inventory In Escrow by Price Range Condos
$299,999 and below
$300,000 to $499,999
$500,000 to $699,999
$700,000 to $1,499,999
$1,500,000 and above
$299,999 and below
$300,000 to $499,999
$500,000 to $699,999
$700,000 to $1,499,999
$1,500,000 and above
OAHU, HAWAII (Comparesactiveinventorytoarolling12-monthaverageclosedsales) Single-Family HomesJun-24Jun-23YOY chg
$449,999andbelow1.51.7-11.8%
$450,000-$599,9991.32.6-50.0%
$600,000-$699,9992.22.7-18.5%
$1,000,000-$1,499,9992.31.921.1%
$1,500,000-1,999,9994.03.129.0%
$2,000,000-$2,999,9994.83.154.8% $3,000,000andabove12.311.29.8%
Months Supply of Inventory Single-Family Homes
$599,999 and below
$600,000 to $799,999
$800,000 to $999,999
$1,000,000 to $1,999,999
$2,000,000 and above
$150,000-$299,9994.32.665.4%
$300,000-$399,9994.51.7164.7%
$1,500,000-$1,999,99911.68.339.8%
$2,000,000andabove13.311.317.7%
$299,999 and below
$300,000 to $499,999
$500,000 to $699,999
$700,000 to $1,499,999
$1,500,000 and above
Closed Sales Single-Family Homes and Condos Median Sales Price Single-Family Homes and Condos OAHU, HAWAII: Jan 1987 to the Present
Oahu Local Market Update June LOCAL MARKETS Local Market Update Aina Haina - Kuliouou
Ala Moana - Kakaako
Local Market Update Aina Haina - Kuliouou 1-3-6 to 1-3-8
Ala Moana - Kakaako 1-2-3
Downtown - Nuuanu 1-1-8 to 1-2-2
Ewa Plain 1-9-1
Hawaii Kai 1-3-9
Kailua - Waimanalo 1-4-1 to Selected 1-4-4
Kalihi - Palama 1-1-2 to 1-1-7
Kaneohe Selected 1-4-4 to 1-4-7
Kapahulu - Diamond Head 1-3-1 to 1-3-4
Makaha - Nanakuli 1-8-1 to 1-8-9
Makakilo 1-9-2 to 1-9-3
Makiki - Moiliili 1-2-4 to 1-2-9 (except 1-2-6)
Mililani Selected 1-9-4 to 1-9-5
Moanalua - Salt Lake 1-1-1
North Shore 1-5-6 to 1-6-9
Pearl City - Aiea 1-9-6 to 1-9-9
Wahiawa 1-7-1 to 1-7-7
Waialae - Kahala 1-3-5
Local Market Update 37370%$1,965,000$1,875,0005%96.2%98.6%-2%221822%48472%39368%
220%$1,000,000$1,010,000-1%94.7%103.7%-9%384850%46-33%330%
312148%$1,200,000$1,100,0009%97.3%94.8%3%18176%473921%402560%
2542406%$882,000$899,000-2%99.1%98.1%1%2636-28%3393380%2792800%
67628%$1,675,000$1,450,00016%98.9%100.0%-1%191258%887616%72711%
127130-2%$1,707,500$1,599,0007%100.0%98.2%2%1016-38%1761638%131145-10%
3749-24%$900,000$850,0006%97.2%96.4%1%2333-30%6571-8%5464-16%
1018026%$1,150,000$1,100,0005%98.8%97.9%1%1419-26%1309537%1068426%
676110%$1,415,000$1,350,0005%97.2%94.9%2%1627-41%1028717%7981-2%
1211210%$662,500$665,0000%97.4%97.0%0%3440-15%19717811%1541447%
4151-20%$950,000$980,000-3%96.6%97.9%-1%36360%7077-9%5873-21%
49482%$1,595,000$1,432,50011%97.5%96.0%2%14140%867515%5255-5%
68680%$1,071,250$1,022,0005%99.0%98.1%1%2029-31%84831%7383-12%
281587%$1,233,500$1,050,00017%98.9%99.5%-1%141040%322339%322339%
3136-14%$1,630,000$1,578,8753%100.0%95.3%5%2042-52%704846%413711%
1149520%$1,050,000$938,00012%100.0%98.9%1%1417-18%12210220%11910414%
462677%$835,000$840,000-1%98.4%95.8%3%1929-34%513259%462677%
36360%$2,439,500$2,471,000-1%99.9%97.3%3%4259-29%49467%4849-2%
Waikiki 1-2-6 00----------00-00-
Waipahu 1-9-4
Windward Coast 1-4-8 to 1-5-5
Aina Haina - Kuliouou
1-3-6 to 1-3-8
Ala Moana - Kakaako 1-2-3
Downtown - Nuuanu
1-1-8 to 1-2-2
Ewa Plain 1-9-1
Hawaii Kai 1-3-9
Kailua - Waimanalo 1-4-1 to Selected 1-4-4
Kalihi - Palama 1-1-2 to 1-1-7
Kaneohe Selected 1-4-4 to 1-4-7
Kapahulu - Diamond Head 1-3-1 to 1-3-4
7677-1%$950,000$920,0003%99.3%98.9%0%232110%100955%95906%
292232%$995,000$1,154,500-14%97.1%100.0%-3%7420270%39383%30293%
Jun-24Jun-23ChangeJun-24Jun-23ChangeJun-24Jun-23ChangeJun-24Jun-23ChangeJun-24Jun-23ChangeJun-24Jun-23Change
110%$829,000$655,00027%103.8%87.3%19%13123-89%10-110%
249278-10%$730,000$647,50013%96.1%96.9%-1%573563%48242813%261296-12%
159166-4%$590,000$560,0005%98.3%97.6%1%2331-26%28622229%164178-8%
164195-16%$682,500$660,0003%99.7%100.0%0%221916%2692488%198218-9%
7180-11%$780,000$829,500-6%100.0%98.3%2%1224-50%94887%8089-10%
5262-16%$777,500$730,0007%99.2%99.3%0%161323%6266-6%5058-14%
58555%$391,000$400,000-2%97.6%98.1%-1%5021138%7273-1%5361-13%
78728%$757,000$648,00017%99.3%99.3%0%1622-27%1208443%91883%
382931%$613,500$637,000-4%98.4%99.0%-1%1521-29%744757%3642-14%
Makaha - Nanakuli 1-8-1 to 1-8-9 6879-14%$247,500$250,000-1%96.6%100.0%-3%392370%14511724%84805%
Makakilo 1-9-2 to 1-9-3 5363-16%$565,000$545,0004%100.0%100.0%0%222010%6364-2%6265-5%
Makiki - Moiliili 1-2-4 to 1-2-9 (except 1-2-6)
Mililani Selected 1-9-4 to 1-9-5
2302252%$405,000$415,000-2%97.2%98.7%-2%362080%41133622%258274-6%
130148-12%$515,550$509,0001%100.0%100.0%0%231644%20416821%1621545%
Moanalua - Salt Lake 1-1-1 7982-4%$430,000$440,000-2%97.9%98.6%-1%3611227%12610421%93930%
North Shore 1-5-6 to 1-6-9 242020%$1,018,750$862,50018%99.8%98.7%1%1120-45%402654%2324-4%
Pearl City - Aiea 1-9-6 to 1-9-9
1311227%$460,000$472,500-3%99.2%100.0%-1%2711145%19014432%1391335%
Wahiawa 1-7-1 to 1-7-7 111010%$345,000$332,5004%98.5%100.4%-2%12850%181429%1316-19%
Waialae - Kahala 1-3-5 1920-5%$635,000$631,2501%97.3%99.3%-2%4712292%3334-3%2425-4%
Waikiki 1-2-6 538579-7%$430,000$420,0002%96.9%97.3%0%332627%88279112%575591-3%
Waipahu 1-9-4
7074-5%$524,000$507,0003%100.0%100.0%0%181250%9196-5%7183-14%
Windward Coast 1-4-8 to 1-5-5 1112-8%$405,000$140,000189%96.7%100.0%-3%144250%3415127%171242%
Local Market Update Aina Haina - Kuliouou Closed Sales: Single-Family Homes
Local Market Update Closed Sales: Condos
Median Sales Price: Single-Family Homes
Ala Moana - Kakaako
Local Market Update Downtown-Nuuanu Median Sales Price: Single-Family Homes
Sales: Single-Family Homes
Local Market Update Median Sales Price: Single-Family Homes
Closed
Closed Sales: Condos
Local Market Update Closed Sales: Condos
Local Market Update June 2024 Kailua - Waimanalo Median Sales Price: Single-Family Homes
Closed Sales: Condos
Local Market Update Closed Sales: Condos
Kalihi - Palama
Closed Sales: Single-Family Homes
Local Market Update Closed Sales: Condos
Sales Price:
Local Market Update June 2024 Kapahulu - Diamond Head Homes
Local Market Update Makaha - Nanakuli Closed Sales: Condos
Sales Price: Condos
Local Market Update Local Market Update June 2024 Makiki - Moiliili Closed Sales: Single-Family Homes
Closed Sales: Condos
Closed Sales: Single-Family Homes
Local Market Update June Closed Sales: Condos
Median Sales Price: Single-Family Homes
Median Sales Price: Condos
Local Market Update Moanalua - Salt Lake
Closed Sales: Condos
Local Market Update North Shore Local Market Update Pearl City - Aiea Closed Sales: Single-Family Homes
Closed Sales: Condos
Median Sales Price: Single-Family Homes
Local Market Update Local Market Update Waialae - Kahala
Closed Sales: Single-Family Homes
Local Market Update June 2024 Closed Sales: Condos
Closed Sales: Single-Family Homes
Local Market Update Sales Price: Single-Family Homes
Closed Sales: Condos
Local Market Update Windward Coast Median Sales Price: Single-Family Homes
Local Market Update June 2024 Oahu - Islandwide Closed Sales: Single-Family Homes
Median Sales Price: Single-Family Homes
Closed Sales: Condos
Single Family Homes Sold - June 2024 vs 2023
(Residential resales data, based on region and neighborhood groupings as listed in MLS)
Single Family Homes Sold - June 2024 vs 2023
(Residential resales data, based on region and neighborhood groupings as listed in MLS)
Single Family Homes Sold - June 2024 vs 2023
(Residential resales data, based on region and neighborhood groupings as listed in MLS)
Single Family Homes Sold - June 2024 vs 2023
(Residential resales data, based on region and neighborhood groupings as listed in MLS)
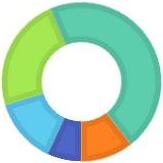
Kailua Region Single Family Homes Sold - June 2024 vs 2023
(Residential resales data, based on region and neighborhood groupings as listed in MLS)
Single Family Homes Sold - June 2024 vs 2023
(Residential resales data, based on region and neighborhood groupings as listed in MLS)
Single Family Homes Sold - June 2024 vs 2023
(Residential resales data, based on region and neighborhood groupings as listed in MLS)
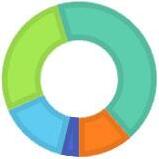
Pearl City Region
Single Family Homes Sold - June 2024 vs 2023
(Residential resales data, based on region and neighborhood groupings as listed in MLS)
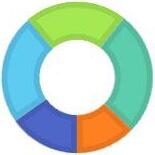
Waipahu Region Condos Sold - June 2024 vs 2023
(Residential resales data, based on region and neighborhood groupings as listed in MLS)
Central Region Ewa Plain Region Condos Sold - June 2024 vs 2023
(Residential resales data, based on region and neighborhood groupings as listed in MLS)
Kailua Region Condos Sold - June 2024 vs 2023
(Residential resales data, based on region and neighborhood groupings as listed in MLS)
Metro Region Condos Sold - June 2024 vs 2023
(Residential resales data, based on region and neighborhood groupings as listed in MLS)