O‘ahu Home and Condo Sales Slip in September Year-to-date median prices show modest gains as third-quarter mortgage rates see gradual decline
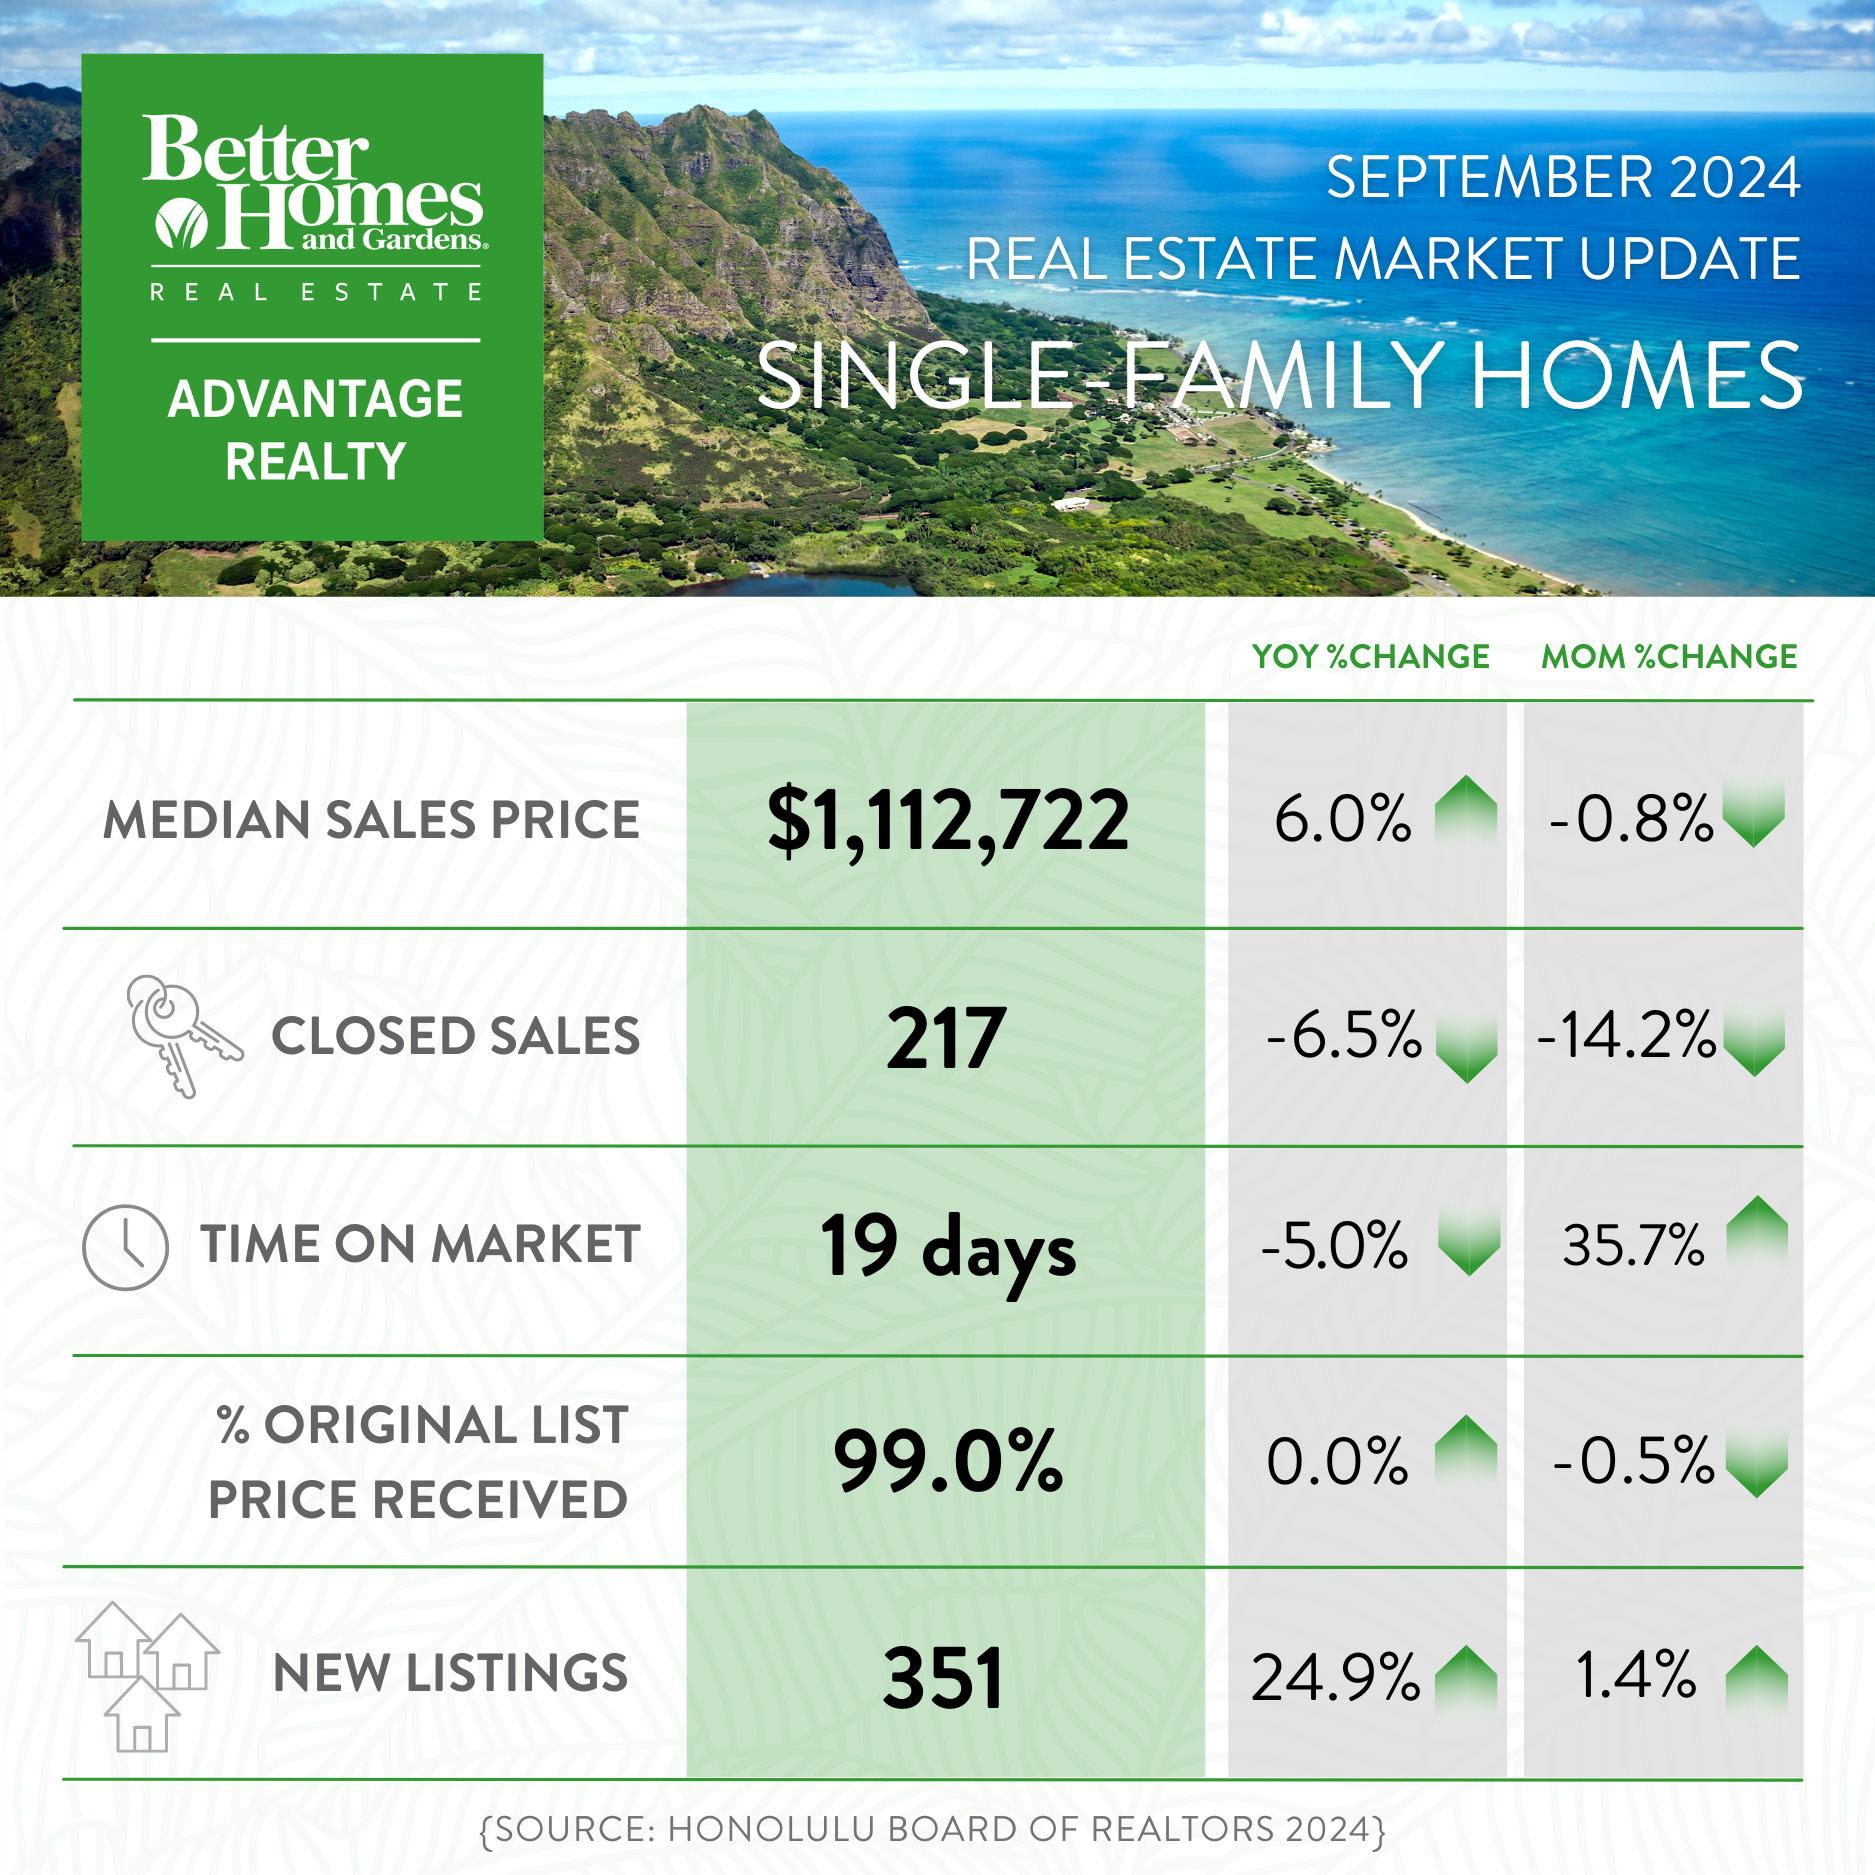
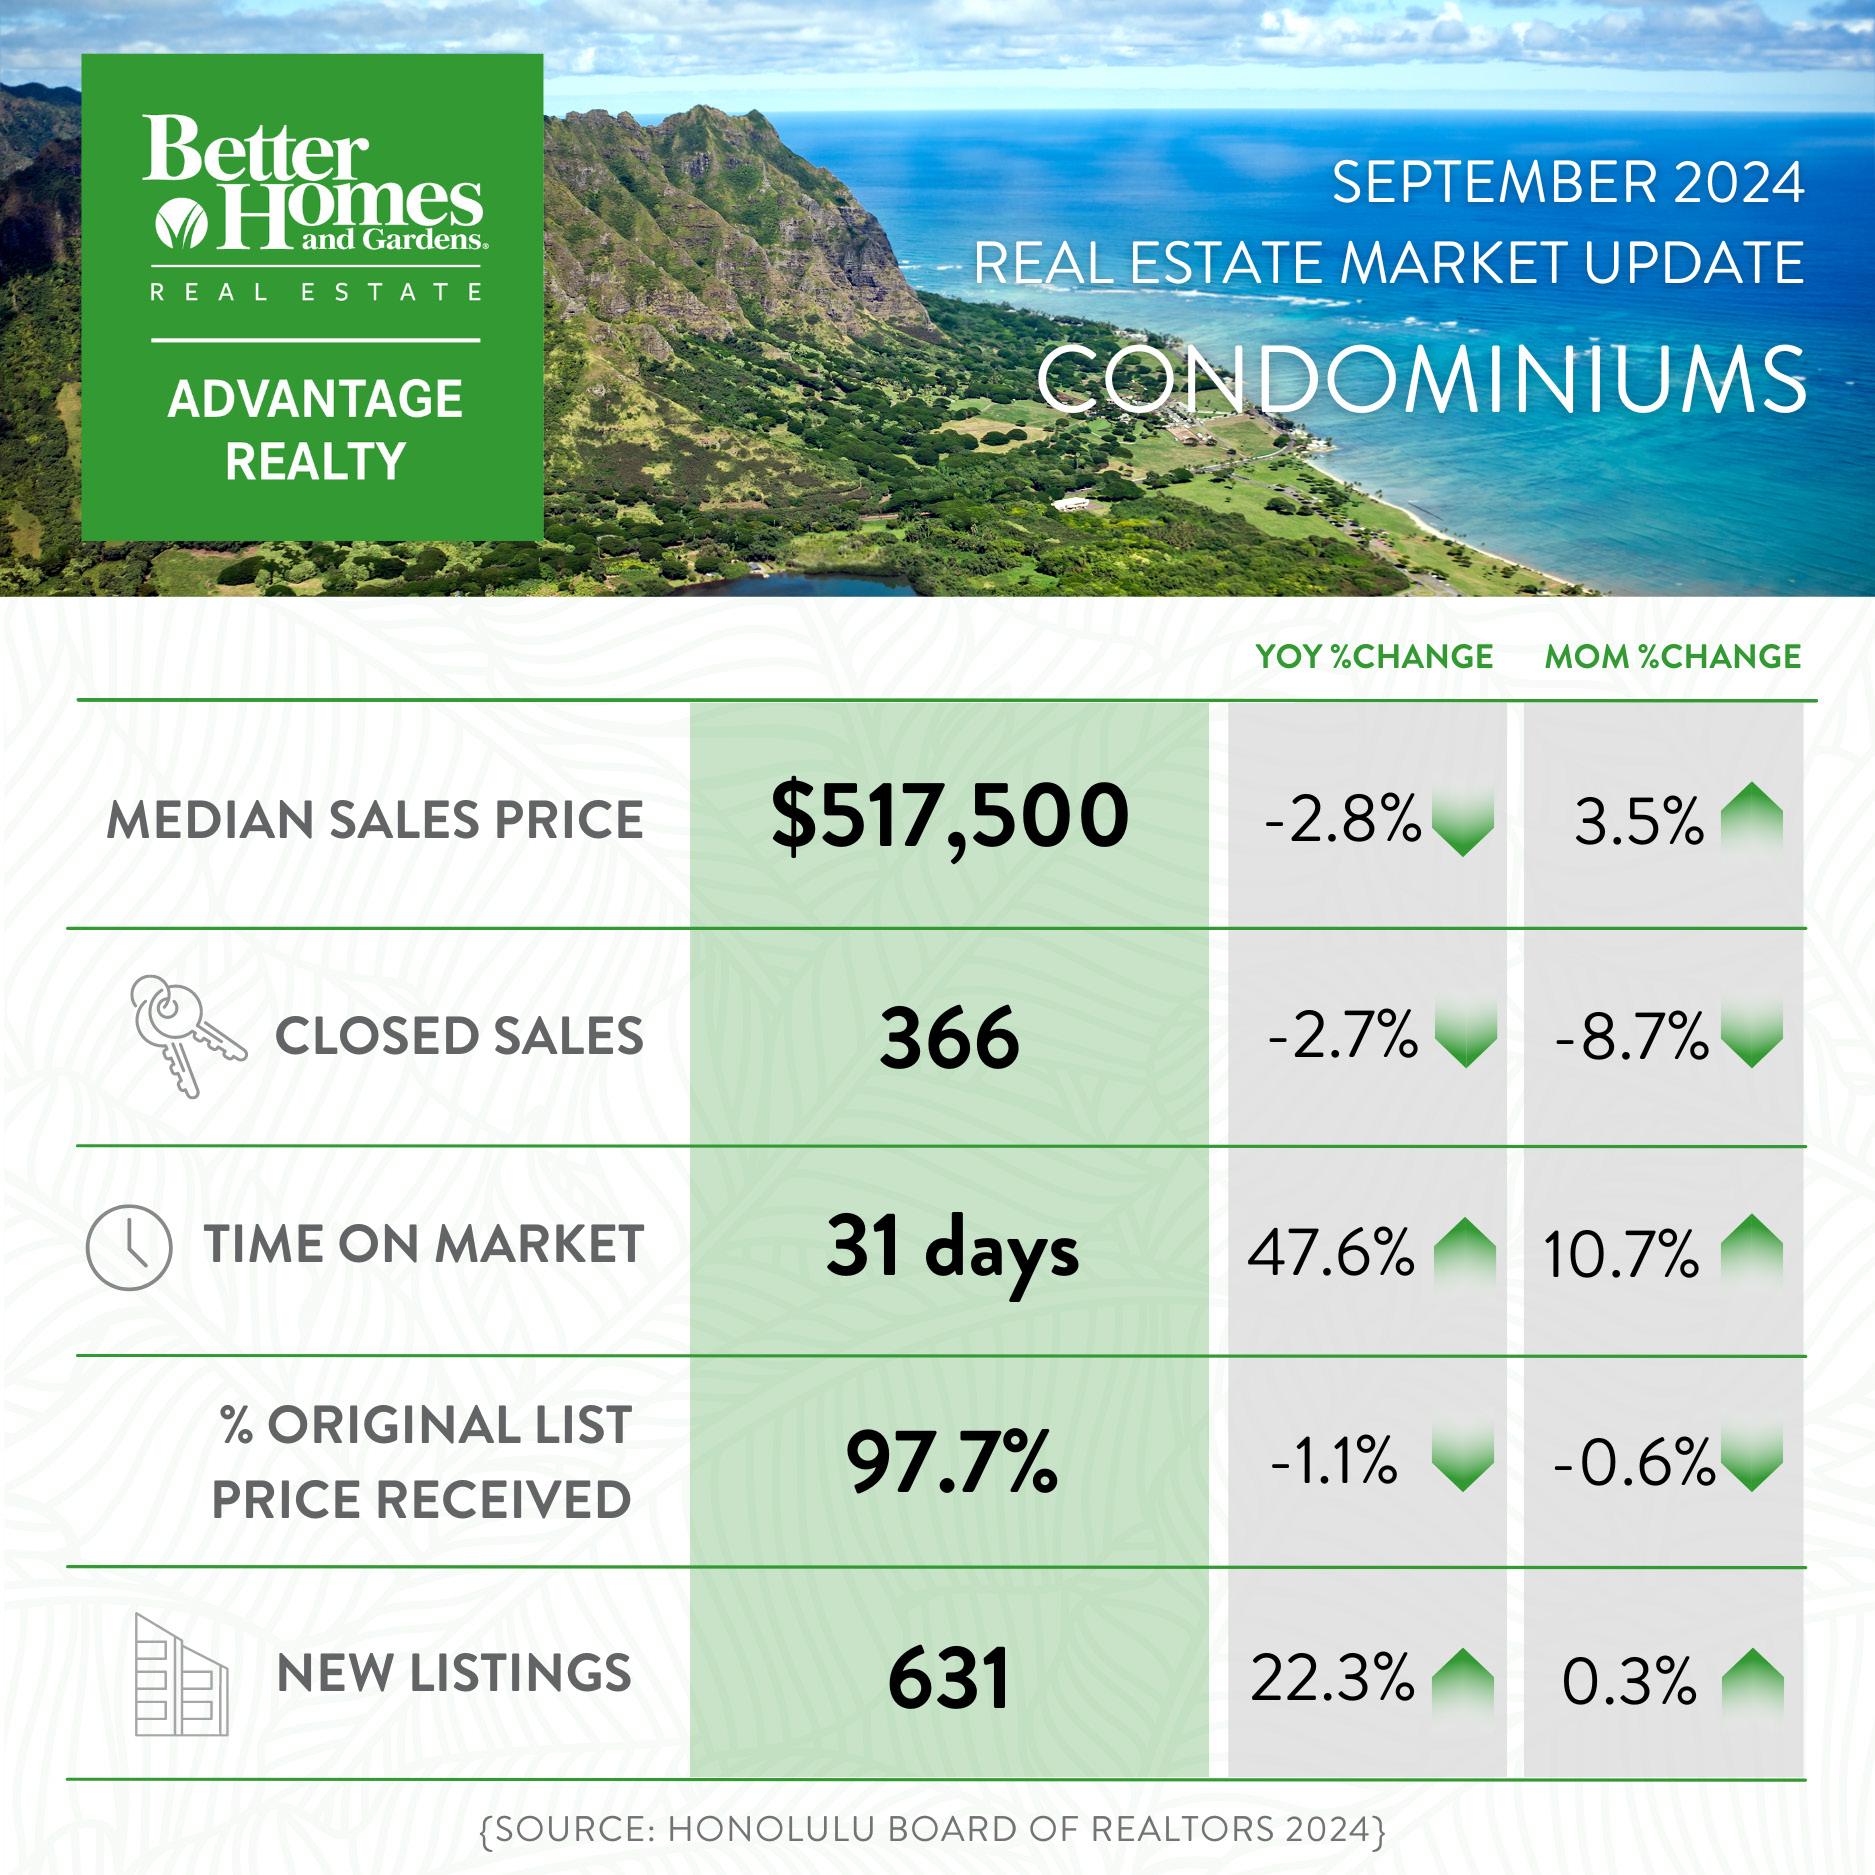
In September, the O‘ahu housing market experienced a slight dip in year-over-year sales for both single-family homes and condos. Single-family home sales declined 6.5% compared to September 2023, dropping from 232 to 217 sales, while condo sales experienced a modest 2.7% decrease, with 366 sales compared to 376 a year ago. Year-to-date, single-family home sales are up 5.8%, while condo sales are down 5.6% from last year.
Highlights:
• The single-family home median sales price rose 6% year-over-year to $1,112,722, while the condo median price fell 2.8% to $517,500.
• Mortgage rates showed a gradual delcine throughout the third quarter. Although September ended with the average 30-year fixed rate hovering above 6%, this was over a full percentage point lower than a year ago.
• Single-family homes maintained a median days on market under one month at 19 days compared to 20 days in September 2023, while condos recorded a median of 31 days, up from 21 days a year ago.
• Active listings rose year over year in both markets - 27.5% year-over-year for single-family homes with 755 listings, while condo listings skyrocketed by 58% with 1,887.
• September added 351 new listings for single-family homes and 631 for condos, up 24.9% and 22.3%, respectively, compared to last year.
According to the President of the Honolulu Board of REALTORS®, “while overall sales volume in both markets softened in September, we did see positive movement in new listings and active inventory, providing more options for prospective buyers. “Paired with the gradual decline in mortgage rates, buyers may feel encouraged to enter the housing market in the coming months.”
Source: Honolulu Board of Realtors
Source: Honolulu Board of Realtors
Oahu Monthly Housing Statistics *seefootnotesonpages9-12regardingmethodologyupdatesYoY%chg=year-over-yearpercentchangecomparingcurrentmonthtothesamemonthlastyear. MoM%chg=month-over-monthpercentchangecomparingcurrentmonthtothepreviousmonth.
*seefootnotesonpages9-12regardingmethodologyupdates1-yr%chg=percentchangecomparingthecurrentYTDtimeperiodtothesameYTDtimeperiodoneyearago. 2-yr%chg=percentchangecomparingthecurrentYTDtimeperiodtothesameYTDtimeperiodtwoyearsago.
Single-Family Homes Condos
Single-Family Homes
Condos
Single-Family Homes Sold September 2024
OAHU, HAWAII
(Acountofpropertiesthathaveclosedinagivenmonth)
Mo-Yr
Single-Family HomesCondosTotal
Sep-214246151,039
Oct-21381611992
Nov-21371601972
Dec-21378593971
Jan-22326552878
Feb-22241486727
Mar-22321672993
Apr-223656721,037
May-223446881,032
Jun-22357626983
Jul-22312518830
Aug-22314508822
Sep-22278496774
Oct-22222435657
Nov-22192340532
Dec-22202360562
Jan-23150275425
Feb-23173325498
Mar-23236444680
Apr-23208420628
May-23262438700
Jun-23248470718
Jul-23224422646
Aug-23252422674SeptemberSFHYoY%chgCNDYoY%chgSeptemberYTDSFHYoY%chgYTDCNDYoY%chg Sep-232323766082022278-34.4%496-19.3%20222,858-15.8%5,218-3.3% Oct-232133996122023232-16.5%376-24.2%20231,985-30.5%3,592-31.2% Nov-23180310490
September 2024 OAHU, HAWAII
(Themediansalespriceofallclosedpropertiesinagivenmonth)
Mo/Yr Single-Family HomesCondos
Sep-21$1,050,000$478,000
Oct-21$1,000,000$500,000
Nov-21$1,050,000$500,000
Dec-21$1,050,000$485,000
Jan-22$1,050,000$510,000
Feb-22$1,125,000$497,000
Mar-22$1,150,000$515,500
Apr-22$1,105,000$510,000
May-22$1,153,500$516,500
Jun-22$1,100,000$534,000
Jul-22$1,107,944$500,000
Aug-22$1,125,500$498,500
Sep-22$1,100,000$502,500
Oct-22$1,050,000$520,000
Nov-22$1,149,500$480,000
Dec-22$1,049,500$502,500
Jan-23$970,000$495,000
Feb-23$987,000$480,000
Mar-23$1,083,750$536,000
Apr-23$999,995$500,000
May-23$1,109,000$505,000
Jun-23$1,050,000$510,000
Jul-23$1,090,000$500,000 Monthly Median Sales Price
Year-to-Date Median Sales Price
Aug-23$1,110,000$515,000SeptemberSFHYoY%chgCNDYoY%chgSeptemberYTDSFHYoY%chgYTDCNDYoY%chg
Sep-23$1,050,000$532,5002022$1,100,0004.8%$502,5005.1%2022$1,110,50013.9%$510,0009.1%
Oct-23$1,100,000$515,0002023$1,050,000-4.5%$532,5006.0%2023$1,050,000-5.4%$505,000-1.0%
Nov-23$1,100,055$516,179
Dec-23$996,500$510,000
Jan-24$1,021,016$502,500
Feb-24$1,075,000$512,500
Mar-24$1,100,000$500,000
Apr-24$1,100,000$528,000
May-24$1,085,000$495,000
Jun-24$1,120,000$530,000
Jul-24$1,140,000$509,000
Aug-24$1,122,000$500,000
Sep-24$1,112,722$517,500
2024$1,112,7226.0%$517,500-2.8%
2024$1,100,0004.8%$510,0001.0%
Median Sales Price
Single-Family Homes Condos
Average Sales Price September 2024 OAHU, HAWAII
(Theaveragesalespriceofallclosedpropertiesinagivenmonth)
Mo/Yr
Single-Family HomesCondos
Sep-21$1,289,510$558,002
Oct-21$1,335,171$582,509
Nov-21$1,296,551$559,007
Dec-21$1,303,481$604,749
Jan-22$1,277,309$623,928
Feb-22$1,486,088$583,367
Mar-22$1,570,668$623,684
Apr-22$1,404,481$613,189
May-22$1,450,008$625,327
Jun-22$1,382,559$631,822
Jul-22$1,329,023$590,934
Aug-22$1,341,958$547,319
Sep-22$1,307,249$607,502
Oct-22$1,243,960$676,988
Nov-22$1,387,685$594,444
Dec-22$1,325,156$576,689
Jan-23$1,139,294$633,441
Feb-23$1,427,864$592,131
Mar-23$1,391,538$651,630
Apr-23$1,223,383$603,795
May-23$1,355,804$623,748
Jun-23$1,300,456$589,597
Jul-23$1,270,421$617,683 Monthly Average Sales Price
Average Sales Price
Year-to-Date Average Sales Price
Aug-23$1,427,996$628,127SeptemberSFHYoY%chgCNDYoY%chgSeptemberYTDSFHYoY%chgYTDCNDYoY%chg
Sep-23$1,357,981$608,2222022$1,307,2491.4%$607,5028.9%2022$1,396,00213.6%$607,81510.5%
Oct-23$1,304,757$670,8052023$1,357,9813.9%$608,2220.1%2023$1,329,663-4.8%$615,4271.3%
Nov-23$1,434,999$676,625 2024$1,307,833-3.7%$625,1542.8%
Dec-23$1,207,793$602,535
Jan-24$1,323,172$593,630
Feb-24$1,437,693$580,274
Mar-24$1,380,838$579,500
Apr-24$1,408,991$617,664
May-24$1,419,039$592,964
Jun-24$1,282,503$690,803
Jul-24$1,360,415$616,302
Aug-24$1,387,740$590,171
Sep-24$1,307,833$625,154
Single-Family Homes Condos
Median Days on Market September 2024
OAHU, HAWAII
(DaysonMarketrepresentsthenumberofdaysfromwhenapropertyisfirstlistedtowhenanofferisaccepted;theMedianDaysonMarketrepresentsthemedianofallsalesinagivenmonth)
Mo/Yr Single-Family HomesCondos
Sep-21911
Oct-211011
Nov-21119
Dec-211113
Jan-221214
Feb-221314
Mar-2299
Apr-221012
May-221010
Jun-221011
Nov-221818
Dec-222521
Jan-232424 Feb-234728
Jun-231718
Jul-231616
Median Days on Market
Single-Family Homes Condos
Percent of Original List Price Received September 2024 OAHU, HAWAII
(Thepercentagefoundwhendividingaproperty'ssalespricebytheoriginallistprice;reportedpercentageisthemedianofallsalesfortheperiodindicated)
Mo/Yr Single-Family HomesCondos
Sep-21103.1%100.0%
Oct-21102.2%100.0%
Nov-21102.2%100.0%
Dec-21102.1%100.0%
Jan-22101.6%100.0%
Feb-22100.8%100.0%
Mar-22102.0%100.0%
Apr-22102.6%100.0%
May-22102.2%100.0%
Jun-22102.0%100.0%
Jul-22100.0%100.0%
Aug-22100.0%100.0%
Sep-2299.2%100.0%
Oct-2299.8%99.0%
Nov-2298.4%98.8%
Dec-2296.7%98.5%
Jan-2395.9%98.4%
Feb-2396.0%98.0%
Mar-2396.7%98.5%
Apr-2398.3%98.7%
May-2398.7%99.0%
Jun-2399.5%98.9%
Jul-23100.0%98.8%
Percent of Original List Price Received
Aug-2399.1%99.6%SeptemberSFHYoY%chgCNDYoY%chgSeptemberYTDSFHYoY%chgYTDCNDYoY%chg
Sep-2399.0%98.8%202299.2%-3.8%100.0%0.0%2022100.9%-1.1%100.0%0.0% Oct-2398.0%98.7%202399.0%-0.2%98.8%-1.2%202398.4%-2.5%98.7%-1.3%
Nov-2397.1%98.0%
Dec-2398.3%97.9%
Jan-2498.3%97.5%
Single-Family Homes Condos
September 2024
OAHU, HAWAII
(Acountofpropertiesthathavebeennewlylistedonthemarketinagivenmonth)
Mo-Yr
Single-Family HomesCondosTotal
Sep-214127381,150
Oct-213767171,093
Nov-21358639997
Dec-21245527772
Jan-22320666986
Feb-223677391,106
Mar-224127141,126
Apr-224247221,146
May-224456871,132
Jun-223916861,077
Jul-223866161,002
Aug-22381608989
Sep-22304601905
Oct-22285532817
Nov-22289526815
Dec-22164371535
Jan-23268523791
Feb-23233463696
Mar-23293530823
Apr-23292532824
May-23309582891
Jun-23324535859
Jul-23275521796
Aug-23330549879SeptemberSFHYoY%chgCNDYoY%chgSeptemberYTDSFHYoY%chgYTDCNDYoY%chg Sep-232815167972022304-26.2%601-18.6%20223,430-10.6%6,039-4.0% Oct-232725668382023281-7.6%516-14.1%20232,605-24.1%4,751-21.3%
Nov-23267457724
September 2024
OAHU, HAWAII
(Ameasureofcontractactivityrepresentedbyacountofpropertiesthathavehadoffersacceptedonthemduringagivenmonth)
Mo/Yr
Single-Family HomesCondosTotal
Sep-213986291,027
Oct-214006301,030
Nov-21367573940
Dec-21287511798
Jan-22315574889
Feb-22316643959
Mar-223846911,075
Apr-223666631,029
May-22356601957
Jun-22305501806
Jul-22297484781
Aug-22312475787
Sep-22224436660
Oct-22198342540
Nov-22198359557
Dec-22168289457
Jan-23267378645
Feb-23217399616
Mar-23258444702
Apr-23271438709
May-23258507765
Jun-23231415646
Jul-23247421668
Aug-23267425692SeptemberSFHYoY%chgCNDYoY%chgSeptemberYTDSFHYoY%chgYTDCNDYoY%chg Sep-232323716032022224-43.7%436-30.7%20222,875-20.4%5,068-12.0% Oct-2319232551720232323.6%371-14.9%20232,248-21.8%3,798-25.1% Nov-23174308482 202427116.8%3997.5%
Mar-24280439719 Apr-24269443712
May-24260422682
Active Inventory* September 2024 OAHU, HAWAII (ThenumberofpropertiesinActive(A)statusattheendofthegivenmonth)
Mo/Yr
Single-Family HomesCondosTotal
Sep-214371,0301,467
Oct-214011,0391,440 Nov-213661,0331,399
Dec-213099461,255
Jan-223119671,278 Feb-223489891,337 Mar-223609191,279 Apr-223959171,312
May-224719391,410 Jun-225279981,525 Jul-225761,0501,626 Aug-225961,0731,669
Sep-226291,1411,770 Oct-226561,1941,850 Nov-226821,2441,926
Dec-225971,1701,767
Jan-235511,1961,747 Feb-235471,1771,724
Mar-235411,1521,693
Inventory
Apr-235351,1441,679SeptemberSFHYoY%chgCNDYoY%chg
May-235431,1181,661202262943.9%1,14110.8% Jun-236051,1591,7642023592-5.9%1,1944.6%
Jul-235911,1541,745
Aug-235981,1461,744 Sep-235921,1941,786 Oct-236261,3061,932
Nov-236721,3372,009 Dec-236001,2341,834
Jan-246071,3481,955 Feb-245991,3881,987
Mar-245811,4932,074 Apr-246181,5762,194 May-246401,6512,291 Jun-246531,7292,382
Jul-247221,8672,589
Aug-247601,8792,639 Sep-24755 1,8872,642
Active Inventory: Single-Family Homes + Condos
Total Inventory In Escrow* September 2024 OAHU, HAWAII
(Thenumberofpropertiesundercontractattheendofthegivenmonth/combinedlistingsinCandPstatus)
Mo/Yr
Single-Family HomesCondosTotal
Sep-216609511,611
Oct-216639351,598
Nov-216378991,536
Dec-215287841,312
Jan-224987971,295
Feb-225449461,490
Mar-226039801,583
Apr-225929561,548
May-225838561,439
Jun-225097281,237
Jul-224796761,155
Aug-224626541,116
Sep-22388590978
Oct-22345506851
Nov-22319512831
Dec-22278430708
Jan-23376523899
Feb-23386592978
Mar-23393602995
Apr-234356231,058SeptemberSFHYoY%chgCNDYoY%chg
May-234186861,1042022388-41.2%590-38.0%
Jun-233706129822023383-1.3%569-3.6%
Jul-23383586969
Aug-23391590981
Sep-23383569952
Oct-23333475808
Nov-23312473785
Dec-23305468773
Jan-24334532866
Feb-244165861,002
Mar-244486471,095
Apr-244456471,092
May-244405931,033
Jun-244336071,040
Jul-24409580989
Months September 2024 OAHU, HAWAII
(Comparesactiveinventorytoarolling12-monthaverageclosedsales)
Mo/Yr
Single-Family HomesCondos
Sep-211.21.8
Oct-211.11.8
Nov-211.01.7
Dec-210.81.6
Jan-220.81.6
Feb-220.91.6
Mar-221.01.5
Apr-221.11.5
May-221.31.5
Jun-221.51.6
Jul-221.61.7
Aug-221.71.8
Sep-221.92.0
Oct-222.12.1
Nov-222.22.3
Dec-222.12.2
Jan-232.02.4
Feb-232.02.4
Mar-232.12.4
Jul-232.62.8
Aug-232.72.8
Sep-232.73.0
Oct-232.93.3
Nov-233.13.4
Dec-232.83.2
Jan-242.83.5
Feb-242.83.6
Mar-242.74.0
Apr-242.84.2
May-242.94.4
Jun-243.04.7
Jul-243.25.1
Single-Family Homes Condos
$700,000 - $799,999 1622-27.3%925-64.0%98.7%97.7%1.0%1621-23.8%2022-9.1%484214.3%4041-2.4%2.52.213.6%
$800,000 - $899,999 2139-46.2%916-43.8%100.0%100.0%0.0%32320.0%31310.0%726510.8%50492.0%2.42.020.0%
$900,000 - $999,999 262313.0%232015.0%100.0%97.9%2.1%493732.4%403129.0%665617.9%564816.7%2.52.025.0%
$1,000,000 - $1,499,999 87808.8%201717.6%98.5%100.0%-1.5%1128827.3%937917.7%19414236.6%13812312.2%2.52.025.0%
$1,500,000 - 1,999,999 332157.1%191090.0%97.2%100.6%-3.4%50484.2%353112.9%1179128.6%54508.0%4.23.810.5%
$2,000,000 - $2,999,999 14137.7%151136.4%98.5%100.3%-1.8%301776.5%16977.8%835940.7%241926.3%5.54.231.0%
$3,000,000 and above 513-61.5%2226-15.4%95.1%94.6%0.5%312055.0%13785.7%1179325.8%181520.0%13.010.326.2%
All Single-Family Homes217232-6.5%1920-5.0%99.0%99.0%0.0%35128124.9%27123216.8%75559227.5%4213839.9%3.42.725.9%
$149,999 and below 10666.7%2071-71.8%100.0%94.7%5.6%151315.4%9728.6%554522.2%1219-36.8%4.23.520.0%
$300,000 - $399,999 60567.1%312240.9%97.3%98.8%-1.5%91839.6%716018.3%28915388.9%988712.6%4.82.4100.0%
$400,000 - $499,999 756025.0%291952.6%97.9%98.9%-1.0%1158338.6%746710.4%30816191.3%1089612.5%5.02.4108.3% $500,000 -
$600,000 - $699,999 3947-17.0%362171.4%98.4%100.0%-1.6%795738.6%504413.6%16110750.5%736021.7%4.02.281.8%
$700,000 - $999,999 65650.0%251656.3%97.9%100.0%-2.1%1068426.2%676011.7%29920645.1%101929.8%4.83.441.2%
$1,000,000 - $1,499,999
Closed Sales by Price Range: Single-Family Homes September 2024 OAHU, HAWAII (Acountofpropertiesthathaveclosedinagivenmonth)
$450,000-$599,999412-66.7%68646.3%
$1,000,000-$1,499,99987808.8%9438659.0% $1,500,000-1,999,999332157.1%33828917.0%
Closed Sales by Price Range: Condos September 2024 OAHU, HAWAII
(Acountofpropertiesthathaveclosedinagivenmonth)
$150,000-$299,9993146-32.6%489566-13.6% $300,000-$399,99960567.1%714773-7.6%
$700,000-$999,99965650.0%7477312.2%
$1,000,000-$1,499,999282512.0%2602408.3%
Median Days on Market by Price Range: Single-Family Homes September 2024
OAHU, HAWAII (Themediannumberofdaysfromwhenapropertyisfirstlistedtowhenanofferisaccepted)
$449,999andbelow9611772.7%432665.4%
$450,000-$599,9992229-24.1%3046-34.8%
Median Days on Market by Price Range 1-mth Period: Single-Family
$1,000,000-$1,499,999201717.6%1618-11.1% $1,500,000-1,999,999191090.0%171513.3%
Median Days on Market by Price Range 12-mth Period: Single-Family Homes 12-mth Median This Period 12-mth Median Last Period
Median Days on Market by Price Range: Condos September 2024 OAHU, HAWAII (Themediannumberofdaysfromwhenapropertyisfirstlistedtowhenanofferisaccepted)
$150,000-$299,9995618211.1%352075.0%
Median Percent of Original List Price Received by Price Range: Single-Family Homes September 2024
OAHU, HAWAII (Thepercentagefoundwhendividingaproperty'ssalespricebytheoriginallistprice;reportedpercentageisthemedianofallsalesfortheperiodandpricerangeindicated)
Median Percent of Original List Price Received by Price Range 1-mth Period: Single-Family Homes Sep-24 Sep-23
$449,999andbelow78.8%103.8%-24.1%92.0%96.6%-4.8%
$700,000-$799,99998.7%97.7%1.0%98.4%97.7%0.7%
Median Percent of Original List Price Received by Price Range 12-mth Period: Single-Family Homes 12-mth Median This Period 12-mth Median Last Period
Median Percent of Original List Price Received by Price Range: Condos OAHU, HAWAII (Thepercentagefoundwhendividingaproperty'ssalespricebytheoriginallistprice;reportedpercentageisthemedianofallsalesfortheperiodandpricerangeindicated)
Median Percent of Original List Price Received by Price Range 1-mth Period: Condos Sep-24 Sep-23
$400,000-$499,99997.9%98.9%-1
Median Percent of Original List Price Received by Price Range 12-mth Period: Condos
reflectsthesame12-monthperiodoneyearprior.
$1,000,000-$1,499,9991128827.3%1,1911,00119.0%
New Listings by Price Range: Condos (Acountofpropertiesthathavebeennewlylistedonthemarketinagivenmonth)
$150,000-$299,9995459-8.5%678709-4.4%
$700,000-$999,9991068426.2%1,20597823.2% $1,000,000-$1,499,999422755.6%48937729.7%
Pending Sales by Price Range: Single-Family Homes September 2024
OAHU, HAWAII (Ameasureofcontractactivity/acountofpropertiesthathavehadoffersacceptedontheminagivenmonth)
$449,999andbelow21100.0%333010.0%
$450,000-$599,99913785.7%947525.3%
Pending Sales by Price Range
$1,000,000-$1,499,999937917.7%9589016.3% $1,500,000-1,999,999353112.9%36131713.9%
Pending Sales by Price Range 12-mth Period: Single-Family Homes 12-mth Total This Period 12-mth Total Last Period
Current List Price
Pending Sales by Price Range: Condos September 2024 OAHU, HAWAII (Ameasureofcontractactivity/acountofpropertiesthathavehadoffersacceptedontheminagivenmonth)
$149,999andbelow9728.6%145153-5.2%
$150,000-$299,9993443-20.9%481580-17.1%
$300,000-$399,999716018.3%786794-1.0%
$400,000-$499,999746710.4%795825-3.6%
$500,000-$599,99963621.6%673720-6.5%
$600,000-$699,999504413.6%518597-13.2%
$700,000-$999,999676011.7%7467114.9%
$2,000,000andabove8560.0%7589-15.7%
$450,000-$599,999181250.0%
$600,000-$699,999322910.3%
$2,000,000-$2,999,999835940.7%
$3,000,000andabove1179325.8%
$599,999 and below
$600,000 to $799,999
$800,000 to $999,999
$1,000,000 to $1,999,999
$2,000,000 and above
$599,999 and below
$600,000 to $799,999
$800,000 to $999,999
$1,000,000 to $1,999,999
$2,000,000 and above
$150,000-$299,99918913540.0%
$300,000-$399,99928915388.9%
$400,000-$499,99930816191.3% $500,000-$599,999259127103.9%
$1,500,000-$1,999,999736217.7%
$2,000,000andabove90100-10.0%
$299,999 and below
$300,000 to $499,999
$500,000 to $699,999
$700,000 to $1,499,999
$1,500,000 and above
$299,999 and below
$300,000 to $499,999
$500,000 to $699,999
$700,000 to $1,499,999
$1,500,000 and above
$599,999 and below
$600,000 to $799,999
$800,000 to $999,999
$1,000,000 to $1,999,999
$2,000,000 and above
$599,999 and below 10141615122418151318211715132126252522292511212526 $600,000 to $799,999 64809467656269556066687071718261585463637166768180 $800,000 to $999,999 133157148143121115127117117130121127121143138114119134113105103112132135138
$1,000,000 to $1,999,999 251243251216207204191201209240229238233247260234235230225253269281305325311
$299,999 and
$300,000 to $499,999
$500,000 to $699,999
$700,000 to $1,499,999
$1,500,000 and above
$2,000,000 and above 171162173156146142136147144151152146152152171165170156158168172183188194200 Total 629656682597551547541535543605591598592626672600607599581618640653722760755 Condos S-22O-22N-22D-22J-23F-23M-23A-23M-23J-23J-23A-23S-23O-23N-23D-23J-24F-24M-24A-24M-24J-24J-24A-24S-24
$299,999 and below 184183189185179185183182184177177170180196177152186185205210217223245253244
$300,000 to $499,999 263267292261277282251251252273272287314352363349386431464497517556593597597
$500,000 to $699,999 250274272245243229251244236252233243234266296264273266280310343364391399420
$700,000 to $1,499,999 317325340318329322308307289309323301304333337315343343364377396412473468463
$1,500,000 and above 127145151161168159159160157148149145162159164154160163180182178174165162163 Total 1,1411,1941,2441,1701,1961,1771,1521,1441,1181,1591,1541,1461,1941,3061,3371,2341,3481,3881,4931,5761,6511,7291,8671,8791,887
Inventory In Escrow* by Price Range: Single-Family Homes September 2024 OAHU, HAWAII (Thenumberofpropertiesinanescrowstatusattheendofagivenmonth)
$449,999andbelow4333.3%
$450,000-$599,999211361.5%
$600,000-$699,9991622-27.3% $700,000-$799,9994041-2.4%
$2,999,999 $3,000,000 and above
$1,500,000-1,999,99954508.0%
$2,000,000-$2,999,999241926.3%
$3,000,000andabove181520.0%
$599,999 and below
$600,000 to $799,999
$800,000 to $999,999
$1,000,000 to $1,999,999
$2,000,000 and above
$599,999 and below
$600,000 to $799,999
$800,000 to $999,999
$1,000,000 to $1,999,999
$2,000,000 and above
$149,999andbelow1219-36.8%
$150,000-$299,9996073-17.8%
$300,000-$399,999988712.6%
$400,000-$499,9991089612.5%
$700,000-$999,999101929.8%
$1,000,000-$1,499,99934319.7%
$1,500,000-$1,999,9997475.0%
$2,000,000andabove12933.3%
$299,999 and below
$300,000 to $499,999
$500,000 to $699,999
$700,000 to $1,499,999
$1,500,000 and above
$299,999 and below
$300,000 to $499,999
$500,000 to $699,999
$700,000 to $1,499,999
$1,500,000 and above
(Comparesactiveinventorytoarolling12-monthaverageclosedsales)
$599,999 and below
$600,000 to $799,999
$800,000 to $999,999
$1,000,000 to $1,999,999
$2,000,000 and above
OAHU, HAWAII (Comparesactiveinventorytoarolling12-monthaverageclosedsales)
$150,000-$299,9994.62.958.6%
$300,000-$399,9994.82.4100.0%
$2,000,000andabove15.012.520.0%
$299,999 and below
$300,000 to $499,999
$500,000 to $699,999
$700,000 to $1,499,999
$1,500,000 and above
Closed Sales Single-Family Homes and Condos OAHU, HAWAII: Jan 1987 to the Present
Median Sales Price Single-Family Homes and Condos OAHU, HAWAII: Jan 1987 to the Present
Oahu Local Market Update LOCAL MARKETS Local Market Update Local Market Update Aina Haina - Kuliouou
Local Market Update Aina Haina - Kuliouou 1-3-6 to 1-3-8
Ala Moana - Kakaako 1-2-3
Downtown - Nuuanu 1-1-8 to 1-2-2
Ewa Plain 1-9-1
Hawaii Kai 1-3-9
Kailua - Waimanalo 1-4-1 to Selected 1-4-4
Kalihi - Palama 1-1-2 to 1-1-7
Kaneohe Selected 1-4-4 to 1-4-7
Kapahulu - Diamond Head 1-3-1 to 1-3-4
Makaha - Nanakuli 1-8-1 to 1-8-9
Makakilo 1-9-2 to 1-9-3
Sep-24Sep-23ChangeSep-24Sep-23ChangeSep-24Sep-23ChangeSep-24Sep-23ChangeSep-24Sep-23ChangeSep-24Sep-23Change
5254-4%$1,950,000$1,600,00022%97.5%100.0%-3%171331%746710%585114%
56-17%$1,100,000$1,243,750-12%93.0%92.1%1%3716131%11757%6450%
513834%$1,200,000$1,123,5007%98.8%95.5%3%1417-18%796522%645028%
3863782%$892,000$890,0000%99.4%98.3%1%2234-35%5074845%401438-8%
1059511%$1,675,000$1,450,00016%99.2%100.0%-1%151136%14412416%11210210%
193194-1%$1,656,000$1,600,0004%99.2%100.0%-1%14140%2622457%195208-6%
6772-7%$925,000$900,0003%98.6%96.4%2%2033-39%103104-1%8890-2%
14612121%$1,200,000$1,150,0004%98.7%100.0%-1%14138%20315630%16412729%
11310013%$1,400,000$1,355,0003%96.7%96.1%1%1623-30%16914517%1281280%
183190-4%$665,000$667,5000%97.3%97.2%0%3439-13%29726711%2172170%
6575-13%$1,012,500$1,020,000-1%97.2%98.3%-1%232110%109112-3%7592-18%
Makiki - Moiliili 1-2-4 to 1-2-9 (except 1-2-6) 796914%$1,628,000$1,510,0008%96.6%97.3%-1%191619%1271169%8485-1%
Mililani Selected 1-9-4 to 1-9-5 1081080%$1,073,250$1,067,5001%100.0%99.5%1%1416-13%13512211%1191153%
Moanalua - Salt Lake 1-1-1
North Shore 1-5-6 to 1-6-9
382646%$1,230,000$1,272,500-3%100.0%99.7%0%141127%463724%403611%
54532%$1,437,500$1,400,0003%100.0%96.0%4%2325-8%1036851%55550%
Pearl City - Aiea 1-9-6 to 1-9-9 16314016%$1,065,000$965,50010%100.0%99.1%1%1317-24%20716426%18516313%
Wahiawa 1-7-1 to 1-7-7
Waialae - Kahala 1-3-5
604630%$825,000$840,000-2%98.6%98.8%0%1517-12%815450%624538%
645810%$2,400,000$2,471,000-3%99.0%97.3%2%2833-15%797111%69681%
Waikiki 1-2-6 00----------00-00-
Waipahu 1-9-4
Windward Coast 1-4-8 to 1-5-5
Aina Haina - Kuliouou
1-3-6 to 1-3-8
Ala Moana - Kakaako 1-2-3
Downtown - Nuuanu
1-1-8 to 1-2-2
Ewa Plain 1-9-1
Hawaii Kai 1-3-9
Kailua - Waimanalo 1-4-1 to Selected 1-4-4
Kalihi - Palama 1-1-2 to 1-1-7
Kaneohe Selected 1-4-4 to 1-4-7
Kapahulu - Diamond Head 1-3-1 to 1-3-4
Makaha - Nanakuli 1-8-1 to 1-8-9
127131-3%$950,000$910,0004%100.0%98.9%1%1621-24%16113916%1431328%
423135%$960,000$1,150,000-17%97.4%97.8%0%412471%62587%474212%
Sep-24Sep-23ChangeSep-24Sep-23ChangeSep-24Sep-23ChangeSep-24Sep-23ChangeSep-24Sep-23ChangeSep-24Sep-23Change
110%$829,000$655,00027%103.8%87.3%19%13123-89%41300%21100%
372412-10%$747,000$690,0008%96.1%96.8%-1%533551%72966010%380433-12%
232250-7%$568,000$562,5001%98.0%98.0%0%292612%43333430%243257-5%
256310-17%$690,000$675,0002%99.3%100.0%-1%251839%41137310%295336-12%
110119-8%$814,500$849,000-4%100.0%98.4%2%1321-38%16612533%116124-6%
7587-14%$787,500$754,5004%99.4%100.0%-1%161060%1011001%7380-9%
85841%$400,000$400,0000%98.2%98.5%0%372085%115131-12%83104-20%
12611015%$706,500$670,0005%99.1%100.0%-1%17166%16012231%1291226%
584821%$672,000$895,000-25%98.0%99.2%-1%16160%1156772%5658-3%
105125-16%$245,000$250,000-2%96.6%100.0%-3%452673%20417020%1271252%
Makakilo 1-9-2 to 1-9-3 7886-9%$565,000$551,0003%99.7%100.0%0%292045%92911%8793-6%
Makiki - Moiliili
1-2-4 to 1-2-9 (except 1-2-6)
357378-6%$400,000$409,000-2%97.4%98.8%-1%311694%62451920%395418-6%
Mililani Selected 1-9-4 to 1-9-5 216228-5%$515,000$510,0001%100.0%100.0%0%241650%32025725%25922814%
Moanalua - Salt Lake 1-1-1
114120-5%$428,250$440,000-3%98.3%98.8%-1%2711145%20316225%128134-4%
North Shore 1-5-6 to 1-6-9 33316%$1,000,000$810,00023%98.6%98.9%0%1316-19%593855%34326%
Pearl City - Aiea 1-9-6 to 1-9-9
Wahiawa 1-7-1 to 1-7-7
Waialae - Kahala
1-3-5
Waikiki 1-2-6
Waipahu 1-9-4
Windward Coast 1-4-8 to 1-5-5
2101986%$472,500$470,0001%99.1%100.0%-1%2512108%30122037%2162027%
221822%$347,500$327,0006%97.8%100.4%-3%249167%262313%2224-8%
33323%$625,000$631,250-1%97.6%98.3%-1%389322%564719%383219%
775818-5%$435,000$420,0004%96.6%97.2%-1%352730%1,3231,13816%819849-4%
112118-5%$515,000$499,0003%99.9%100.0%0%191619%146148-1%119127-6%
20195%$354,950$155,000129%96.5%100.0%-4%161145%452580%231921%
Local Market Update Aina Haina - Kuliouou Closed Sales: Condos
Closed Sales: Single-Family Homes
Local Market Update Closed Sales: Condos
Ala Moana - Kakaako
Median Sales Price: Single-Family Homes
Local Market Update Downtown-Nuuanu Median Sales Price: Single-Family Homes
Local Market Update Closed Sales: Condos
Local Market Update Sales: Condos
Median Sales Price: Condos
Closed
Local Market Update September 2024 Kailua - Waimanalo Median Sales Price: Single-Family Homes
Closed Sales: Condos
Local Market Update Kalihi - Palama
Local Market Update Closed Sales: Condos
Sales Price: Condos
Local Market Update Kapahulu - Diamond Head Local Market Update Makaha - Nanakuli Closed Sales: Single-Family Homes
Sales: Condos
Closed
Closed Sales: Single-Family Homes
Local Market Update Closed Sales: Condos
Local Market Update September 2024 Makiki - Moiliili Closed Sales: Single-Family Homes
Closed Sales: Condos
Closed Sales: Single-Family Homes
Local Market Update Closed Sales: Condos
Closed Sales: Single-Family Homes
Local Market Update Closed Sales: Condos
Moanalua - Salt Lake
Local Market Update North Shore Local Market Update Pearl City - Aiea Median Sales Price: Single-Family Homes
Closed Sales: Single-Family Homes
Closed Sales: Condos
Local Market Update Local Market Update Waialae - Kahala
Closed Sales: Single-Family Homes
Local Market Update September 2024 Closed Sales: Condos
Median Sales Price: Single-Family Homes
Closed Sales: Single-Family Homes
Local Market Update Sales: Condos
Closed
Median Sales Price: Single-Family Homes
Local Market Update Local Market Update Oahu - Islandwide Closed Sales: Single-Family Homes
63151622%5,6334,75119%
Sales: Condos
Sales Price: Single-Family Homes
Closed
Single Family Homes Sold - September 2024 vs 2023
(Residential resales data, based on region and neighborhood groupings as listed in MLS)
Central Region Single Family Homes Sold - September 2024 vs 2023
(Residential resales data, based on region and neighborhood groupings as listed in MLS)
Ewa Plain Region Single Family Homes Sold - September 2024 vs 2023
(Residential resales data, based on region and neighborhood groupings as listed in MLS)
Single Family Homes Sold - September 2024 vs 2023
(Residential resales data, based on region and neighborhood groupings as listed in MLS)
Kailua Region Single Family Homes Sold - September 2024 vs 2023
(Residential resales data, based on region and neighborhood groupings as listed in MLS)
Single Family Homes Sold - September 2024 vs 2023
(Residential resales data, based on region and neighborhood groupings as listed in MLS)
Metro Region Single Family Homes Sold - September 2024 vs 2023
(Residential resales data, based on region and neighborhood groupings as listed in MLS)
Single Family Homes Sold - September 2024 vs 2023
(Residential resales data, based on region and neighborhood groupings as listed in MLS)
Waipahu Region Condos Sold - September 2024 vs 2023
(Residential resales data, based on region and neighborhood groupings as listed in MLS)
Central Region Head Region Ewa Plain Region Condos Sold - September 2024 vs 2023
(Residential resales data, based on region and neighborhood groupings as listed in MLS)
Condos Sold - September 2024 vs 2023
(Residential resales data, based on region and neighborhood groupings as listed in MLS)
Makakilo Region Condos Sold - September 2024 vs 2023
(Residential resales data, based on region and neighborhood groupings as listed in MLS)
Condos Sold - September 2024 vs 2023
(Residential resales data, based on region and neighborhood groupings as listed in MLS)