LIDAR PRODUCT CATALOGUE

Last updated September 2023

CONTENTS
INTRODUCTION
POINT CLOUD DATA

ELEVATION & TOPOGRAPHY DATA
VEGETATION DATA
BUILT INFRASTRUCTURE DATA
AERIAL IMAGERY
CUSTOM SOLUTION

Last updated September 2023
INTRODUCTION
POINT CLOUD DATA
ELEVATION & TOPOGRAPHY DATA
VEGETATION DATA
BUILT INFRASTRUCTURE DATA
AERIAL IMAGERY
CUSTOM SOLUTION
LiDAR stands for Light Detection and Ranging and is a remote sensing technology that uses laser light to measure distances and create high-accuracy three-dimensional models of the earth’s surface and above-ground features.
Airborne LiDAR works by emitting millions of laser pulses per second from a sensor mounted in an aircraft and then measuring the time it takes for the laser light to travel to the earth’s surface and to be reflected back to the sensor. This allows Airborne LiDAR to create a high-resolution, threedimensional point cloud model of the earth’s surface, as well as above-ground features such as vegetation, buildings, and other infrastructure.
The point cloud can be fully classified making it possible to produce large-scale derived datasets that accurately describe the elevation and topography of the landscape, as well as the location, height and structure of buildings and vegetation. Airborne LiDAR technology has the ability to penetrate through the tree canopy and measure the ground surface and buildings below, thus creating highly accurate elevation datasets and a holistic three-dimensional model of the environment.
Aerometrex is one of Australia’s leading Airborne LiDAR data providers and currently operates its own fleet of fixed-wing aircraft and LiDAR sensors, capturing data across the entire country. We pride ourselves on providing high-accuracy, spatially consistent LiDAR data across large areas of interest.

The power of accurate, spatially consistent aerialImage: Classified Point Cloud of managed forestry in New South Wales
Our airborne LiDAR sensors can produce multiple elevation measurements resulting in large-scale, high-density, high-accuracy 3D point cloud models of the landscape. These point clouds can be colourised and classified to identify, measure, and visualise a wide range of features.
Large-scale, high-accuracy, classified LiDAR data is the ideal technology for applications within engineering, asset management, construction, environmental consulting, and natural hazard/emergency management.
Aerometrex’s fleet of airborne LiDAR sensors can emit up to two million laser pulses per second and the collected data can be processed and classified to one of our three proprietary standards.

LiDAR technology has revolutionised data analysis across various industries. By capturing and analyzing aerial LiDAR data, valuable insights can be obtained, benefiting multiple internal departments and stakeholders.

Point cloud classification plays a pivotal role in unlocking the potential of LiDAR data across diverse applications. This segmentation and classification process allows for detailed analysis of specific features, enabling accurate and targeted decision-making.
Aerometrex's comprehensive approach to classification, combining automatic methodologies with rigorous manual quality assurance and quality control (QA/QC) processes, ensures highly accurate point cloud classifications.
By tailoring our classification types to specific use cases and adhering to ICSM (Intergovernmental Committee on Surveying and Mapping) standards, we provide customers with cost-effective and customised solutions for their classification needs. Whether it's obtaining accurate topographical data, detailed information about the built environment and vegetation, or a holistic 3D model for specialised projects, Aerometrex's classification types cater to a wide range of requirements.
Understanding the classification of LiDAR point clouds is essential for leveraging the full potential of this powerful analytical tool. By segmenting and classifying the points within the point cloud, valuable insights can be extracted for applications such as surface water management, flood modelling, asset management, and engineering projects.
With Aerometrex's expertise in point cloud classification and adherence to ICSM standards, customers can confidently utilise LiDAR data for their specific needs, ensuring accuracy, efficiency, and informed decision-making.
Image: Classified LiDAR Point Cloud, Victoria Square Tarntanyangga, AdelaideThe ICSM (Intergovernmental Committee on Surveying and Mapping) has established widely adopted LiDAR point cloud classification standards. These guidelines define the classes used and the associated levels of quality assurance.

All Aerometrex classification types are built upon ICSM standards. The table below summarises the ICSM classification levels applied to each class within our classification types, further guaranteeing the accuracy and integrity of the resulting data.
* Aerometrex applies classification algorithms to all points within the point cloud, and therefore, no points remain unclassified. ** Model Key Point: Only provided upon request at additional cost.
While Aerometrex has developed the above-listed three key classification types for our LiDAR Point Cloud deliveries, we can custom-deliver classified point clouds to other combinations of ICSM classes and levels. This can be done in consultation with clients depending on their end-use.
Type 1 Classification
Accurate Topographical and Ground Surface Elevation

Aerometrex's Type 1 classification is designed for use cases that prioritise accurate topographical and ground surface elevation data. It includes a fully automatic classification of the point cloud, along with targeted manual improvements to Ground, Noise (High & Low), Water, Bridges, and Culverts.

This classification type offers a cost-effective solution for deriving Digital Terrain Models and Contours. It finds applications in surface water management, flood modelling, erosion monitoring, and mining operations.
Type 2 Classification
Detailed Information of Built Environment and Vegetation
Aerometrex’s Type 2 classification builds upon Type 1 and is tailored for projects requiring detailed information on built environment, vegetation, and ground surface data. In addition to the automatic classification, Type 2 incorporates targeted manual improvements to High Vegetation, Buildings, and Default Infrastructure.

This classification type enables the derivation of datasets such as Building Height Models, Canopy Height Models, Building Footprints, and Tree Canopy Coverages. It proves valuable in urban planning, infrastructure development, and environmental monitoring projects.
Type 3 Classification
Holistic 3D Models for Specialised Projects
Aerometrex's Type 3 classification, although costlier, offers a holistic, classified 3D model of the environment, tailored for bespoke projects. Type 3 incorporates both Type 1 & 2 classifications but involves additional manual improvements to Default Infrastructure, Medium Vegetation, High Vegetation, Buildings, and Noise.
This comprehensive dataset is ideal for specialised asset management and engineering projects that require more detailed information on small-scale urban features like powerlines, street furniture, and fences.

Model Key Points
Hydro Flattening
Hydro-flattening is an important enhancement needed for any job where a Digital Terrain Model (DTM) is to be generated in an area with major water bodies, for example, to model the flow of surface water. This enhancement ensures that contours are coherent at the edges of water bodies and that lakes and flat rivers have a gradual downflow slope within the resulting DTM.


Aerial LiDAR has been the technology of choice for generating high-accuracy elevation datasets such as Digital Terrain Models (DTM) and Digital Surface Models (DSM) since it can penetrate vegetation.
The vertical component of each point within a LiDAR point cloud can be analysed to produce a wide range of elevation datasets, both raster and vector, which symbolise the elevation of the landscape in two dimensions, making it much easier to use them in standard GIS platforms. Elevation datasets can also be combined and analysed in various ways to generate additional insights beyond just elevation.
Quantitative elevation datasets (e.g. DTM/DSM/Contour) have a wide range of uses across the planning of local engineering works, tracking mining operations, city-wide urban planning, groundwater management, and flood mitigation planning. Qualitative datasets such as Hillshade applied to DTM/DSM are ideal for visualisation purposes and useful base maps.

Two of the most commonly used elevation products derived from Aerial LiDAR - Digital Terrain Model (DTM) and Contours - both describe the elevation of the ground surface and are extracted from points classified as ground, ideally requiring at least Aerometrex’s Type 1 point cloud classification.

These products are made possible as LiDAR has the ability to penetrate through vegetation and measure the ground surface below, thus providing an accurate measurement of ground surface elevation even below the tree canopy and revealing the regional topography of the landscape.
A Digital Terrain Model, also known as a Digital Elevation Model (DEM) or Bare Earth Model is a raster dataset where each cell (pixel) shows the ground elevation relative to sea level, derived directly from the points classified as ground within the point cloud. Key applications for DTMs include surface water modelling or precision agriculture, flood hazard modelling, engineering and construction design, urban planning and mining. They can be generated at a range of resolutions, however, the LiDAR survey must be planned accordingly.
Contours are a vector dataset comprised of polylines that join points of equal ground elevation, revealing landforms and slopes, derived from an initial DTM. Contours are a very useful way of visualising the topography of the land in two dimensions. They are produced with a fixed spacing, i.e. each contour represents a fixed increase or decrease in elevation. The shape of the contours can be used to identify the morphology of the landscape (i.e. peaks and valleys) and how close the contours are to each other defines the slope (i.e. closely packed contours mean steep slopes and widely spaced contours mean flat ground).
Elevation raster datasets can be generated incorporating all above-ground features (as well as ground) to make a Digital Surface Model (DSM). DSMs are also continuous raster datasets, which describe the elevation (above sea level) of all features across the landscape, generated by defining each pixel’s elevation value as the highest elevation within that cell (known as binning). The resulting DSM includes buildings, trees, other infrastructure, and the ground surface where it is visible from above.
By combining DSMs with Digital Terrain Models, the underlying LiDAR point cloud can be normalised to convert the point coordinates to the height above ground rather than sea level. This essentially removes the effect of topography to produce a Digital Height Model (DHM).

A DSM and/or DHM can be highly valuable datasets for understanding the urban landscape for planning and environmental management.
By utilising Type 2 classified point clouds, we can also supply tailored elevation datasets that describe the structure of specific features in the environment such as tree canopy, buildings, etc. [see sections 3 & 4 for more details]
Although powerful quantitative datasets, elevation rasters such as DTMs, DSMs and DHMs can be very hard to visually interpret to identify specific features across the landscape. One way to increase visual interpretation of elevation datasets is to apply a Hillshade or shaded relief algorithm. These algorithms apply virtual lighting effects to the elevation surface in order to simulate the shadows generated by the sun illuminating the environment to reveal the topography. A coloured hillshade map can be generated by placing the hillshade raster over the elevation raster and applying limited transparency. This makes it far easier to identify certain features within the dataset, while still providing the underlying quantitate height data which can be queried using a GIS platform.


Elevation rasters generated from two separate LiDAR surveys can be used to map changes in elevation to track erosion, landslides, tree canopy loss or earthworks.
Large-scale slope maps can be derived from DTMs for use in agricultural land development applications or engineering projects in the planning stage.
In collaboration with partners, using LiDAR, we can help predict locations of Malleefowl Mounds, required for compliance reporting by various mining and other operations.
 Image DTM + Contour
LiDAR has become an industry standard to accurately map the distribution and 3D structure of vegetation across both urban and rural landscapes.

We provide a wide range of vegetation management datasets including Canopy Height Models (CHM), Foliage Coverage Maps (FCM), Tree Canopy Coverage, and more.
These datasets are ideal for understanding the coverage, density, and three-dimensional structure of vegetation to generate informed management plans and insights relevant to commercial forestry, urban forestry, mine-site rehabilitation, and natural capital monitoring, among others.


Canopy Height Model (CHM) or Digital Canopy Model (DCM)
This dataset describes the precise height (above ground) of the top of tree canopies. It provides valuable information and clear visualisation helping to locate tall/significant trees, track the growth
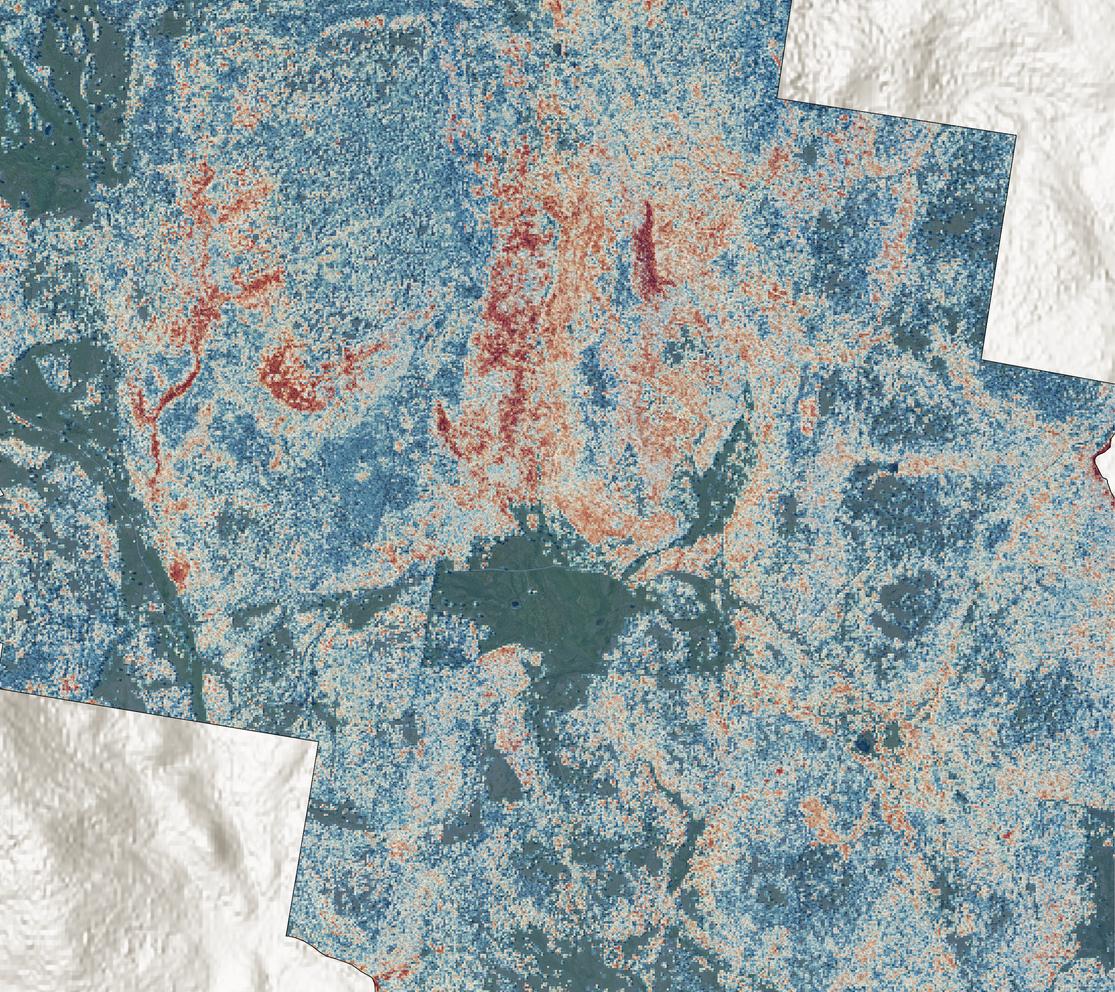
These maps show how continuous vegetation is from ground level to the top of the canopy. This can be useful to understand the stage of growth for managed forests and precision agriculture. In the image here, blue represents low connectivity and red is high connectivity.

This vector map shows the precise boundaries of tree canopies making it possible to extract their total area and the precise percentage of tree canopy coverage within an area of interest.
Tree Canopy Coverage datasets can also be combined with cadastral, land use or land ownership datasets to provide statistical breakdowns of the distribution of tree canopy across the community. This can be used to develop targeted management policies and help local governments reach greening initiative targets.


These maps show the distribution of canopy coverage across predefined height intervals.
ata can help guide tree asset management by revealing the vertical distribution of tree canopy and quantifying the contribution of
Alongside the Vegetation datasets, Aerometrex also offers the service of supplied analytical statistics describing the distribution of vegetation across an area of interest using client-supplied vector boundaries.
Common analyses include tree canopy cover breakdowns (by land use type or land ownership type), tree canopy change statistics and graphical reports.
These can be especially useful for organisations developing tree canopy management strategies or managing trees across large/multiple areas.
Derivation of vegetation metrics from LiDAR is accurate, cost-effective, and repeatable. It is also free of errors associated with perspective effects which are common to other technologies such as aerial imagery. Comparison of these datasets across time can help understand the degree to which tree canopy is changing across the urban landscape. This is critical to assess the effectiveness of tree canopy management and in adapting them to future challenges. Detailed statistics can be generated that summarise the extent and location of tree canopy gain or loss. Building construction and demolition can also be spatially linked to tree canopy changes.


This analysis can be useful for the identification of the approximate location and size of individual trees directly from the LiDAR point cloud using a fully automated workflow.
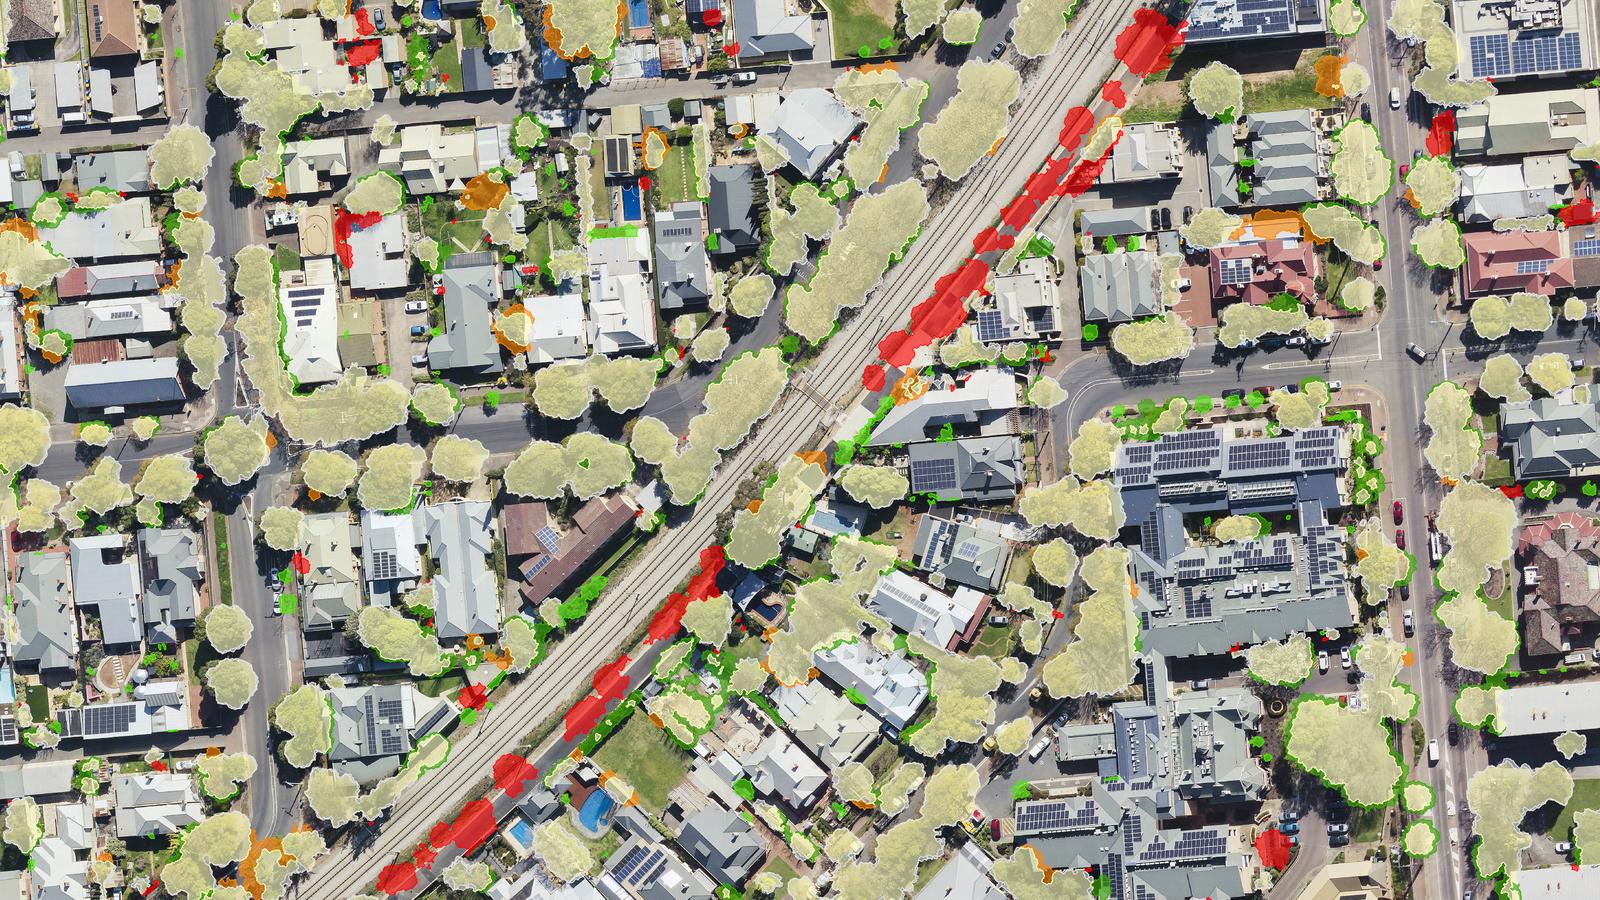
Aerometrex LiDAR can help generate quantitative datasets that describe and provide insights for built infrastructure automatically mapped in our surveys, such as buildings.
These datasets can help inform urban planning initiatives and prove useful within applications such as flood modelling and bushfire hazard mapping as they are used to understand the hazard/risk relative to built assets.

combined with cadastral information to add address information and split continuous footprints by property.
2D Building Footprints can be generated from the classified LiDAR point cloud. Further, they can be manually digitised to provide a higher degree of accuracy. Building Footprints can be generated at a range of resolutions and for additional costs can be regularised across smaller areas of interest.

This product consists of a vector dataset that describes the horizontal extent of structures and can be combined with a Digital Height Model (DHM) to provide roof height attributes. They can be of great use within applications such as flood modelling and bushfire hazard mapping to understand the risk relative to built assets.


Aerometrex's LiDAR sensors are dual-mounted with imagery (camera) sensors, enabling us to capture simultaneous aerial imagery during a LiDAR survey.
While flight paths are optimised for the LiDAR capture, having this additional dataset offers a valuable visual aid to help interpret features within the 3D LiDAR Point Cloud.
All Aerometrex LiDAR sensors are dual-mounted with a Phase One optical camera sensor, meaning that Aerial Imagery can be collected simultaneously with the LiDAR data.
While imagery collected alongside LiDAR data may sometimes be of lower quality (due to the optimisation of flight plans for LiDAR), it can act as a valuable visual aid to help interpret features within the 3D point cloud. This means that the resulting imagery may have some distortions, colour imbalances and/or cloud shows.


If required, Aerometrex can provide additional post-processing in order to effectively colour balance, and remove distortions and cloud shadows, but only where possible.
With both photogrammetry and LiDAR processing teams in-house at Aerometrex, you can be assured you're receiving the best possible outcomes for your project. Having these two complimentary datasets captured simultaneously ensures that you can access the benefits of each and also keep costs under control.
While this catalogue highlights some of our common products & solutions, our team can work with you to customise a range of capture requirements, classification needs, and deliverables.
Custom capture
Design a bespoke survey with tailored parameters including flight paths, heights, overlaps and sensor settings.

Custom classification
Pursue your own classification levels that are fit for your project use case & budget.
Custom deliverables
Analyse, digitise and map features that are your priority, delivered with tailored specifications & formats.
