BARRIERS TO AGRICULTURAL FINANCE IN ETHIOPIA

FIELD STUDY - JANUARY 2022
AUTHORS:DROLIVERSCHMIDT&CHRISTOPHERENGELHARDT
Barriers to agricultural finance in Ethiopia 2021
Published by: Deutsche Gesellschaft für Internationale Zusammenarbeit (GIZ) GmbH
Registered offices: Bonn and Eschborn, Germany
Friedrich Ebert Allee 40 53113 Bonn, Germany
T + 49 228 44 60 0 F + 49 228 44 60 17 66
Dag Hammarskjöld Weg 1 5 65760 Eschborn, Germany
T + 49 6196 79 0 F + 49 6196 79 11 15
E info@giz.de I www.giz.de
Author: Dr Oliver Schmidt & Christopher Engelhardt (Agriculture & Finance Consultants, AFC)
Responsible: Dr Andrea Ruediger & Lara Anna Chhatwal (GIZ)
Special thanks to: Kenno Itana
Photographs: © GIZ
Addis Ababa, August 2022
List
Figures 1 List of Boxes
Executive Summary......................................................................................................................4 1 Introduction 5 1.1 Background 5 1.2 Context of the study ......................................................................................................5 1.3 Relevance.....................................................................................................................6 1.4 Outline 7 2 Approach and methods 8 2.1 Research questions.......................................................................................................8 2.1.1 Demand side survey (main focus of the field study) 8 2.1.2 Supply side survey (complementary focus of the field study) 9 2.2 Field research 10 2.2.1 Demand side 10 2.2.2 Supply side 10 2.3 Definition of key concepts 12 3 Demand side barriers.........................................................................................................14 3.1 The chapter in brief 14 3.2 Status of agri SME’s access to finance 14 3.3 Access to finance and other key challenges of agri SMEs...........................................15 3.4 Findings on demand side barriers ...............................................................................16 3.4.1 Introduction 16 3.4.2 Financial management as a barrier 17 3.4.3 The application for formal loans as a barrier.........................................................22 4 Supply side barriers 24 4.1 The chapter in brief 24 4.2 Brief overview of status and conditions of FI’s offers to agri SMEs..............................25 4.3 Major findings 26 4.3.1 Collateral is the main barrier for SMEs’ access to credit 26 4.3.2 FIs’ agrifinance capacity 28 4.3.3 FIs’ credit funding constraints...............................................................................30 5 Summary of recommendations and proposed interventions 32 1. Capacity building and mentoring support measure for agri SMEs (Business/entrepreneurship skills development) 32 2. Institutional change management process (Agricultural finance).....................................34 3. Agricultural Value Chain Finance (AVCF) Sector wide awareness creation/ sensibilisation 37 6 Annexure............................................................................................................................39 Annex 1: Profile of agri SMEs interviewed 39 Annex 2: Status of access to finance 41 Annex 3: Other Findings on demand side barriers .................................................................48 Annex 4: SMEs without loans 49 Annex 5: Curriculum of RENEW (Investment Funds) SME management training 52
Table of Contents
List of Tables.................................................................................................................................1
of
.................................................................................................................................2 Abbreviations................................................................................................................................3
List of Tables
Table 1 : Financial Institutions interviewed 11
Table 2 : SME classification..........................................................................................................12
Table 3 : Main findings on demand side barriers 14
Table 4 : Main findings on supply-side barriers 24
Table 5 : Financing of activities along VC stages..........................................................................25
Table 6 : Requirements of selected Ethiopian banks, as reported by SMEs 26
Table 7 : Loan product features agri SMEs would like to see........................................................28
Table 8 : Main challenges, private and public banks and MFIs 30
Table 9 : Source and response rate of SMEs 39
Table 10: Gender distribution 39
Table 11: Respondent’s role 39
Table 12: Legal form of organisation.............................................................................................39
Table 13: Number of respondents per value chain 39
Table 14: Number of staff per category and per value chain .........................................................40
Table 15: Number of staff per respondent, per category and per value chain 40
Table 16: Business turnover (our respondents) per value chain 40
Table 17: Turnover physical volume and money by VCs and VC stages.................................41
Table 18: Phone and network availability among SMEs 42
Table 19: Distance to bank branch or banking agent ....................................................................43
Table 20: Insurance of SMEs, by location 45
Table 21: Agricultural insurances available in Ethiopia 46
Table 22: Sources of semi formal/ informal finance 50
LIST OF FIGURES
Figure 1 : Map of Ethiopia showing the geographical distribution of respondents 10
Figure 2 : Challenges faced by agri-SMEs 16
Figure 3 : Challenges (other than market linkages and inflation) by value chain actor...................16
Figure 4 : Record keeping practice self assessment 18
Figure 5 : Perception of strengths and weaknesses of accounting systems..................................20
Figure 6 : SME weaknesses as perceived by FIs 21
Figure 7 : SMEs’ satisfaction with loans 27
Figure 8 : Proposed TA activities by intervention level 32
Figure 9 : Types of accounts 42
Figure 10: CBE Checklist for Agricultural Machinery Financing for Smallholder Farmers............44
Figure 11 : Example of livestock insurance policy 46
Figure 12 : Accounting practices...................................................................................................49
1
LIST OF BOXES
Box 1: Desk study...........................................................................................................................6
Box 2 : A note on survey and questioning techniques 18
Box 3 : What is overconfidence?...................................................................................................19
2 Figure 13 : Sources of semi formal credit......................................................................................51
3 Abbreviations AACCSA Addis Ababa Chamber of Commerce and Sectoral Associations ATA Agricultural Transformation Agency (A)VC (Agricultural) Value Chains CBE Commercial Bank of Ethiopia DBE Development Bank of Ethiopia ECX Ethiopia Commodity Exchange EDC Entrepreneurship Development Centre ETB Ethiopian Birr FAO Food and Agricultural Organisation FEMSEDA Federal Micro and Small Enterprise Development Agency FI Financial Institution (incl. Micro Financial Institutions) GoE Government of Ethiopia HR Human Resources IFC International Finance Corporation IFRS International Financial Reporting Standards ICMP Institutional change management process JCC Ethiopia’s Job Creation Commission LLC Limited liability company MFI Micro Financial Institution NBE National Bank of Ethiopia NIB Nib International Bank OIB Oromia International Bank OIC Oromia Insurance Company OLP Outstanding Loan Portfolio PLC Private Limited Company ROSCA Rotating Savings and Credit Association SME Small and medium sized enterprises SNNPR Southern Nations, Nationalities, and Peoples' Region TA Technical Assistance TNA Training Needs Assessment UNDP United Nations Development Programme USAID United States Agency for International Development WEDP Women Entrepreneurship Development Programme WB World Bank
Small and medium enterprises (SMEs) have difficulties accessing credit to grow their operations. Regularly, SMEs operating in agricultural value chains (AVC) face even bigger difficulties, because (micro)financial institutions (FIs) preconceive agriculture as excessively risky and do not make efforts to understand business models of agri SMEs.
So far, the experiences of agricultural SMEs in Ethiopia have hardly been studied. Yet, within the reform agenda of economic and financial sector policies of the Government of Ethiopia (GoE), SMEs in general and agricultural SMEs in particular, will be increasingly important. They contribute to innovation and modernisation along AVC and the creation of jobs.
Therefore a study on ‘barriers to access to finance for agricultural SMEs in Ethiopia’ was conducted. The field study stands out by its carefully stratified sample of agri SMEs, not micro enterprises as in most other studies. The 61 SMEs interviewed are active across all stages of several AVC, most of them in cereals, dairy, and vegetables/ fruits. Furthermore, the field study surveyed 15 financial institutions: banks, microfinance institutions, insurers, leasing companies, and an investment fund.
The SMEs affirmed that access to finance is an important challenge for them. Interestingly, it is one among four main challenges, which are: 1) market linkages; 2) technology; 3) access to finance; and 4) inflation.
The GoE has recently established a legal framework for leasing operations, which is the first segment of the financial sector opening for foreign direct investment. Still, the respondents from (public) leasing companies related that the shortage of foreign currencies is the main constraint for their services. This is a macro economic constraint that negatively affects the credit markets as well. Most tangibly, it takes away incentives for financial institutions to build capacity in agri-finance, because of the existence of sufficient easier and less costly to assess credit applications from other economic sectors to choose from. This allows them to apply exorbitant collateral to loan ratios, reflected in substantially below market valuation of built property pledged as collateral. This in turn fuels fears of SMEs to lose their property unfairly when loan schedules ill align with their business models which lead to repayment irregularities.
The conducted field study is the first to reflect in detail the demand side barriers of Ethiopia’s agri SMEs. It confirms the literaturefocussing on SMEs that financial management practices and systems are often weak and thus do not generate the reports required by lenders or investors. Different from much of the literature, AFC’s study argues that overconfidence of entrepreneurs about their financial management (skills) are key to these weaknesses. This results in the recommendation that capacity building should be designed differently than common training concepts; in particular by focussing on specific management practices and not broadly on entrepreneurship; and by integrating a mentoring approach.
In line with the desk study, the field study affirms that collateral and non transparent procedures are major supply side barriers. SMEs therefore often prefer semi and informal finance, often from suppliers. This points out the potential for AVC finance; a concept for which Ethiopia’s FIs still lack capacity.
The study findings and recommendations are being shared with interested stakeholders to inform Ethiopia’s reform processes and eventually strengthen agri SMEs to contribute effectively to Ethiopia’s development.
4 Executive Summary
1.1 Background
The “missing middle phenomenon” is common in many developing countries with many micro and some large enterprises, but few small and medium-sized enterprises (SMEs) (World Bank, 2015). It describes lack of financial services targeted at SMEs. Since the 1970s, the microfinance movement has contributed worldwide to the expansion of formal credit to micro and very small enterprises. The range of banks and financial products serving large enterprises has also expanded in many lowincome countries.
Most African countries are strongly dependent on the production of agricultural products, which are in many cases their main export goods. Therefore, increasing productivity in the agricultural sector by strengthening downstream value chain activities is an important objective of economic policy.
The SMEs are important actors in these agricultural value chains (AVCs), among others, because they:
increase efficiency and effectiveness of producing, delivering agricultural inputs, processing, transporting, and aggregating of harvest; contribute to closing the investment gap for modernising the agricultural sector; and Create on and off farm agricultural jobs (for Ethiopian youth). Hence, the “missing middle phenomenon” and agricultural SMEs converge.
In Ethiopia, SME finance is a relatively recent development, informed by a fresh perspective of the Government of Ethiopia (GoE) on SME development in the second decade of this century. However, with a credit constrained financial sector, most credit channelled to SMEs has come from international development partners. Moreover, these partners drew on experiences in various other countries to build capacity of FIs to develop and deliver credit to SMEs.
Agricultural SMEs have rarely been addressed, though. This may be attributed partly to sectoral priorities, e. g. the GoE rather emphasised the role of and support for farmer cooperatives. It may also be attributed partly to development partners’ focus on building principal SME-finance capacity and directing less attention to the perspective of the agricultural sector.
1.2 Context of the study
In this context, the Deutsche Gesellschaft für Internationale Zusammenarbeit GmbH (GIZ) has drawn on the Innovation Fund to study ‘barriers to access to finance for agricultural SMEs in Ethiopia’. The Innovation Fund for Reform Partnerships was created by the Federal Ministry for Economic Cooperation and Development (BMZ) to foster exploration and innovation in countries like Ethiopia with which Germany has entered a reform partnership. It funded the project with the objective to build a context-specific and evidence-based understanding among all relevant stakeholders about the barriers to agricultural finance for SMEs in Ethiopia and subsequently to develop effective strategies to overcome these barriers through targeted interventions. This is part of the cooperation between Germany and Ethiopia in ‘Employment and Private Sector Development’, one of the three main sectors of cooperation between the two countries. The portfolio spans 180 million Euros, 10 projects, including 4 agricultural projects.
The first phase of the study project was a thorough literature review which clearly defined demand side barriers, supply side barriers, and policy barriers that affect agri SMEs’ access to finance. It identified key gaps in the existing literature concerning barriers to agricultural finance for SMEs in the Ethiopian agricultural sector The findings of the desk study (see Box 1) were shared in a stakeholder workshop, which determined the research questions for the second phase: the field study presented in this report.
5 1 Introduction
Purpose: The desk study presents a thorough literature review of both academic and non academic papers (56 out of 130) that discuss enabling and constraining determinants of SME finance. The purpose of the study was to identify key gaps in the existing literature concerning barriers to agricultural finance for SMEs in the Ethiopian agricultural sector. Two research questions have emerged from this study which were further revised and are presented in the following chapter.
Findings on barriers: On the supply-side, which receives most of the attention in the literature, the main barriers are: i) Lack of skills to appraise loan applications and to build risk management systems, so that a variety of collateral forms are accepted; and ii) Lack of skills to develop a range of agricultural finance products that serve agricultural SMEs as well, and to market them successfully. On the demand side, the main barriers are: i) Limited business management and investment planning skills, which is interlinked with lack of choice of financial products tailored to the business models of agricultural SMEs; and ii) Limited financial management and record keeping (skills) The main policy barriers are: i) Prohibition of foreign direct investment in the financial sector; ii) Infrastructure internet connectivity is poor and IT competency costly; and iii) The credit information system in Ethiopia is operating sub optimal.
Selection of findings on research gaps:
• The few studies that focus on agricultural SMEs in Ethiopia hardly discuss measures on the demand side; i.e., overcoming skills and capacity weaknesses of the entrepreneurs.
• The literature on VC finance does not specifically consider agri SMEs. Yet, value chain finance is a good approach to reach agri SMEs as well as other actors in a given value chain, e.g., finance mechanisms could be either through the buyer or from the bank to the farmer directly with the security of a tripartite agreement among bank, buyer, and farmer.
• Agricultural insurance has hardly been explored in the literature reviewed; though a few studies note it as an area of need, e.g. the “Study On Crop and Seed Insurance In Ethiopia” by GIZ (2019)
• Few of the “standard agricultural finance products”, like inventory and trade finance or tripartite arrangements, have been explored.
• Credit scoring is at very early stages, with just one FI having piloted such an approach.
• The literature has focused on smallholder farmers and cooperatives and rather neglected the role of more established agricultural entrepreneurs.
• There is no (nationally) representative survey of agricultural SMEs (only WB 2015).
• There is no SME panel to track developments over time.
• There is no study (for Ethiopia) with a control group (except for the evaluation of the WB female entrepreneurship program).
1.3 Relevance
In terms of methodology, this study presents a unique sample of Ethiopian SMEs, all of them operate at various stages of agricultural value chains: production, processing, and trade; a few of them with export experiences. We do not know of any other Ethiopian study that has captured insights and voices from this economic segment. Moreover, the SMEs have been selected based on a carefully formulated definition: the minimum number of staff is 5 and both SMEs with and without access to formal credit are represented.
The study is also relevant because it offers an insight into agri SMEs access not only to credit but also to savings, payments, and insurance
Furthermore, our study’s supply-side survey is the first we know of to include leasing companies and an investment fund.
In terms of knowledge generated, the study is relevant because it coincides with financial sector and economic policy reforms in Ethiopia. Specifically, the National Bank of Ethiopia (NBE) in 2021 directed MFIs to disburse at least 5% of their loan portfolios against movable (‘non-traditional’) collateral. Reflecting strategies for agrifinance is hence a timely conversation for FIs.
The study shows that experiences of the SMEs affirm findings from the literature: Ethiopia’s FIs lack purposely designed agrifinance products. The SMEs would like to see grace periods and
6 Box 1: Overview of the desk study
repayment schedules aligned with their (seasonal) cash flows, at least quarterly instead of monthly repayments. Noteworthy, the insurance sector appears to be more advanced, with a choice of agricultural insurance products available.
Finally, the study argues that some of these predicaments could be addressed by banks easily. For a comprehensive response and harnessing opportunities, the FIs need to create dedicated strategies for agrifinance and SME-finance. Hardly any of them have done so, though there are nuanced differences between public and private FIs.
1.4 Outline
The field study presented here is organised as follows: Chapter 2 explains the approach. Section 2.1 presents the research questions that the study seeks to answer, and theresearch design applied. Section 2.2 shows how the design was realised, i. e. who was interviewed when and (in case of SMEs) where. Section 2.3 defines the key concepts applied in this study.
Chapters 3 and 4 and present the findings from the field. We show the status of SMEs’ access to finance, and of agrifinance related products offered by FIs. Then we qualify the demand and supply side barriers through the data and information collected from agricultural SMEs on the demand side and FIs on the supply side. We highlight feedback on a few policy barriers, though they are not the focus of this study.
Chapter 5 presents recommendations and proposed interventions to showcase opportunities to tackle identified barriers to access to finance of agri SMEs in Ethiopia.
7
Approach and methods
2.1 Research questions
The research questions for the field study were developed in two stages:
a) the desk study identified research gaps and suggested two research questions on that basis. b) the research questions were presented and discussed in a multi stakeholder validation workshop with representatives from financial institutions, SMEs, research institutes, development partners, and others.
The authors, in collaboration with GIZ (commissioning party), developed a detailed methodology for a flexible design that focuses on qualitative perspectives of multi-faceted relationships.
The methodology defines how to collect primary data from agri SMEs (demand side) as well as from financial institutions (supply side).
2.1.1 Demand-side survey (main focus of the field study)
One finding of the desk study was that the existing literature focuses overwhelmingly on the supply side, while the perspectives of SMEs are relatively less prominent; agricultural SMEs have rarely been studied, let alone systematically. Therefore, the field study focuses mainly on the demand side.
Research question
What specific self imposed barriers have agri SMEs experienced when seeking for finance from (a) banks, MFIs, other financial institutions; (b) informal sources such as friends and family?
Design objectives
Primary: To understand how barriers exert constraints on agri SMEs’ access to finance.
Secondary: To explore relative weight of different barriers, or variables that compose the barriers.
Tertiary: To formulate recommendations for action.
Identification strategy
I. Access to finance from banks or MFIs. The sample contains: a) Agri SMEs that have accessed finance; and b) Agri SMEs that have failed to access finance (either tried but were rejected [particularly loans], or did not try accessing at all).
II. Stage of agricultural value chains: The sample would ideally contain agri SMEs with and without access at the same stages of the same value chains, across all AVC stages (production, processing, trade, etc.). This identifier was applied pragmatically, because it depends on the sources of agri SME contacts, if both the ones with access to finance and the ones without are active in the same value chain. a) populated all generic value chain stages, and b) are active within the same value chains
Sampling methods
Agri SMEs were sampled purposively from the following sources:
8 2
Unit of observation Agricultural SMEs [respondents: Owner-managers]
• Banks, investments funds, and MFIs who shared contacts of agri SME customers. In addition SMEFP borrower database as well as DBE lease customers (exiting and new applicants) list were used. (corresponds to I.a above)
• GIZ programs and SEQUA1 who shared agri SME contacts (corresponds largely with I.b above, often upper small and medium size enterprises)
• FEMSEDA and Chamber of Commerce (corresponds largely with I.b above, often small size enterprises)
In addition, we used snowball sampling, i.e., we elicited contacts to other agri SMEs that current respondents work with or know of (corresponds to II.b above).
Population Approx. 300,000 SMEs (according to the Entrepreneurship Development Center [EDC]).
Target Population Agri SMEs
Number unknown (e. g. WEDP had about 5% agri enterprises among its SME borrowers; according to local AFC expert).
50 70 agri SMEs [structured questionnaire with closed and open ended questions].
Sample size and primary data collection method
Realised sample:
2.1.2
Ideal Sample: 4 agri SMEs (w/ and w/o access to finance) for each AVC stage (abt. 5 [excluding retail to end users]) of 2 selected agri value chains = 40 SMEs.
Heterogeneity across value chains and gaps across stages (e. g. SMEs with access to finance may not be on all stages) counter balanced by additional respondents.
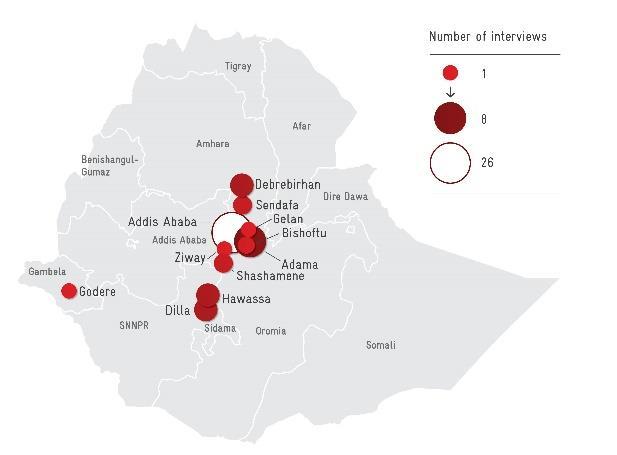
61 SMEs (Details on distribution across value chains and geographically see Annex 1 and Figure 1, respectively)
Supply-side survey (complementary focus of the field study)
Research hypothesis
Strategies of FIs regarding SME agrifinance have only been developed in response to (the chance to access and/or allocating earmarked) donor /investor funding tied to that topic. Else, FIs have neither interest nor incentives to engage into the topic, i.e., no strategy has been formulated.
Unit of observation Formal Financial Institutions
Design objectives
Primary: Spot any indication that might falsify the research hypothesis
Secondary: Identify potential partners for piloting an intervention for finance to agri SMEs
Identification strategy
I. Business model / legal form drives the framework of strategic choices of any institution
II. Public and private ownership correlates to different incentives and thus strategic choices
Sampling method
Financial institutions are purposively sampled to include selected strata (i.e., banks, MFIs, leasing companies, investment funds) and to include public and private ownership as applicable.
Donor agencies (including but not limited to those that give financial assistance, see population) are selected based on their engagement in SME finance and/or in Agriculture.
1 A German consultancy company whose shareholders are Germany’s private sector / industry associations.
9
Population
Target Population
Approx. 90 NBE licensed financial institutions (incl. banks, MFIs, leasing companies, investment funds, and financial assistance agencies, e. g. KfW, World Bank).
70 financial institutions:
• 18 banks (according to NBE website)
• 18 insurers (according to NBE website)
• 34 MFIs (according to NBE website) 6 Leasing companies (according to local AFC expert [excluding DBE, counted as bank)
Target Sample size 10 12 financial institutions
Interviewees Senior FI and fund managers
Primary data collection method
Individual semi structured (FIs) and open (donors) interviews
Realised sample 15 financial institutions (see table 1 for details)
2.2 Field research
2.2.1 Demand side
Field research was conducted in September and October 2021. A unique set of 61 respondents of agricultural SMEs with 25 full time employees on average (the map on the right shows their geographical distribution).
They are spread over all stages of their respective value chains (VCs). About two third of respondents are active in the VCs of cereals, dairy, and fruits and vegetables.
Figure 1 : Map of Ethiopia showing the geographical distribution of respondents
Details about the profile of the agri SMEs surveyed (male/ female ownership, legal form, employment, spread over VC stages) are given in annex 1.
2.2.2 Supply side
We collected information from 15 financial institutions. All categories (see column 2 of Erreur ! Source du renvoi introuvable. below) of the target sample were covered. In addition, we conversed with one investment fund and reached out to a second one. The latter did not serve SMEs and was thus not interviewed.
10
Name of FI Category Owner ship3 (majority)
Founding year No. of branches Loan portfolio* Savings portfolio*
Number of SME clients
Development Bank of Ethiopia (DBE) Bank Public 1901 32 5b (leasing portfolio only) / 950 (leasing portfolio only)
Commercial Bank of Ethiopia (CBE) Bank Public 1963 644 172.7b (1.5b mechanisati on loans) 451.9b <10% of loan portfolio
Awash Bank Private 1994 535 87.5b 108b n.a.
Nyala Insurance company Private 1995 31 n.a. / n.a.
Oromia Savings and Credit MFI Public 1997 194 12.8m 6.2m
200,000 (most of them are rather micro)
Wasawa MFI Private 1997 29 0.4b (2017) 0.16b (2017) n.a.
VisionFund MFI Private 1998 37 3.3b n.a. 1.3b OLP (through WEDP)
Hibret (United) Bank Private 1998 385 n.a. n.a. 800m OLP to SMEs
Addis Savings and Credit MFI Public 2000 5.2b 2.13b >7,000
Cooperative Bank of Oromia Bank Private 2004 420 54.5b 71.12b n.a.
Oromia Insurance Company (OIC) Insurance company Public 2009 48 n.a. (non life premium ETB 80m) / n.a.
Renew Strategies Investment fund Private 2012 1 n.a. / 12
Addis capital goods financing Leasing company Public 2014 10 0.6b / 14
Oromia capital goods financing Leasing company Public 2017 15 n.a. / 700
Metemanen MFI Private n.a. 14 n.a. n.a. n.a.
The realised target has only one categorical gap: Ethio Lease, the only private leasing company in Ethiopia, did not grant us an interview.
5
Different from previous studies, this survey of the supply side is cursory, because the focus is the perspective of the agri SMEs. However, AFC’s is probably the first study that systematically covers
2 We collated this information from the interviews as well as search of FIs’ websites and reports as accessible; however there is a high degree of uncertainty (i. e. current figures may well differ.
3 In terms of legal form, all of them are shareholding companies except Renew Strategies, which is a limited liability company (LLC).
4 No branches indicated on NBE website, only HO/ region of operation.
5 The intended interview date could not be realised, because on that day, most of Addis’ main roads were closed due to inauguration of central government. Different from other respondents, Ethio Lease did not offer an alternative date for a visit or call.
11 Table 1 : Financial Institutions interviewed2
the leasing companies. The GoE has recently created a legal framework for leasing, as part of the financial sector reforms to overcome the credit constraint.
Further, we interviewed the Director of Microfinance Supervision of the National Bank of Ethiopia (NBE). The NBE is the regulator of all financial institutions in Ethiopia. We also had dialogues with GIZ Special Initiative Jobs Programme, SEQUA, USAID, and FAO. Lastly, we conversed with Ethiopia’s Job Creation Commission (JCC), Addis Ababa Chamber of Commerce and Sectoral Associations (AACCSA), and Entrepreneurship Development Centre (EDC).
Interviews and conversations occurred between September and November 2021.
2.3 Definition of key concepts
SMEs
Small and medium sized enterprises are defined as indicated in Table 2, according to the classification by FEMSEDA (2011).
Table 2 : SME classification
Barriers
The term “barrier” is rarely used in the literature on agri-SMEs’ access to finance. We define barriers as conditions that: (i) largely on their own constitute an obstacle; and (ii) fall exclusively within the agency of either class of actors in the financial sector, i.e., we differentiate between public policy barriers, demand side barriers, and supply side barriers. Hence, policy barriers are induced by policymakers; demand side barriers are induced by the agri SMEs themselves; and supply-side barriers are induced by the financial service providers. For example, collateral is a barrier that FIs create deliberately, collateral is therefore a supply side barrier.
Demand/ supply side
The demand side of the financial sector are those who buy and use financial services and products and these are private households and companies; the focus of our study is on a sub section of the latter.
The supply side consists of regulated providers of financial services and products. Accordingly, we have surveyed different types of financial institutions, both privately and publicly owned, that operate under regulation of the NBE: banks, microfinance institutions, leasing companies, and insurance companies. The term FIs cuts across some or all of them.
Semi formal or informal financial services or products come from other providers (see annex 4) were also probed into the use of these services but we have not surveyed any of their providers in this study.
Whereas the main interest is on credit, we have covered other financial products as well, namely payments, savings and insurance.
12
Small
Medium
Economic sector Services Industry Services Industry
Enterprises
Enterprises
Employees 6 30 6 30 31 100 31 100 Capital (ETB) 50,001 500,000 100,001 1,500,000 500,001 7,500,000 1,500,001 7,500,000
Equity investment is an important form of finance which is provided through capital markets, but not through financial markets. This is irrelevant to the focus of our study, though. Therefore, we skip over this specification by using the term financial sector more broadly and include the equity investor we interviewed in the supply side data.
13
Demand side barriers
3.1 The chapter in brief
Section 3.2 opens the chapter with a concise overview of SME’s access to finance payments and savings, credit, and insurance of the agri-SMEs. We explore both formal and semi-formal/ informal financial services. These findings are presented in elaborate detail in annexes 2 and 3.
Section 3.3 discusses the challenges that agri SMEs face. Access to finance is one of the major challenges, alongside market-linkages, technology, and inflation. Further challenges are related to policy and other broader context factors, such as security and climate change.
Table 3 summarises the findings on the demand side barriers which are discussed in section 3.4. This section represents the ‘core of the chapter’, discussing the forms demand side barriers take, and how they are shaped by a behavioural factor, i.e., overconfidence.
Table 3 : Main findings on demand-side barriers
Field study finding Confirms desk study?
SMEs have weaknesses in their financial management practices and systems yes
SMEs may not have gathered information about the (opportunities to meet) requirements of the banks n/a
Agri SMEs can profit from training to change their financial management (and other business) practices yes
New insight
The owners/ managers of these agri SMEs are overconfident about their financial management practices despite factual shortcomings.
There are some indications that agri SMEs:
• do not apply for loans because of prejudices about collateral and procedures
• over value the convenience of semi and informal finance
Capacity building that is well defined (business not entrepreneurship training) and uses attractive methods can empower SMEs to manage their challenges and access more finance
3.2 Status of agri-SME’s access to finance
All 61 agri-SMEs who responded to the survey hold accounts with formal FIs, most of them operate more than one account. Forty eight Agri SMEs have at least one current or checking account, and 41 have at least one savings account. Out of the latter, 14 save also informally through an iquub (akin to Rotating Savings and Credit Association [ROSCA]).
The motivation to open accounts with more than one financial institution is two fold: On the one hand, business partners or donors may have an account at that bank. On the other hand, privately owned banks regularly offer faster services and better online banking facilities than publicly owned CBE, where most of them have their first (longest) operating account.
However, access to credit is constrained: only about a third of respondents (22) had an active formal loan at the time of survey. Thirty three SMEs said they had ever received a loan. Another 18 agri SMEs access informal credit, mostly from suppliers and buyers. They often report that semi and informal credit is more convenient as they come with much less documentation and collateral requirements and much lower risk to lose collateral pledged.
Most SMEs complained that financial institutions do not treat them as partners, and even if they have long operating current or savings accounts with a bank, the loan application process and loan conditions are the same (i.e., as tedious, and costly) as for anybody else.
Many SME respondents expressed hopes into the new leasing sector and particularly the upcoming leasing operations at DBE, but few have already accessed them.
14
3
Twenty seven SMEs said they have taken any type of insurance, in most cases obligatory such as third party car insurance. A variety of agricultural insurance products are available, e. g. some of our respondents had taken out livestock insurance. Awareness about insurance products is limited. For instance, a dairy farmer from the outskirts of Addis shared how he lost his first 10 cows to disease. Only afterwards did he learn, from a peer, about the option of livestock insurance which he has since used
Further details are provided in in annexes 2 and 3.
3.3 Access to finance and other key challenges of agri-SMEs
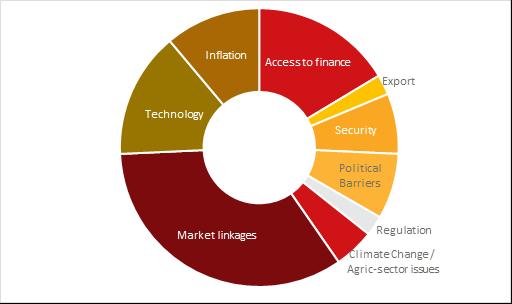
SMEs discussed various challenges hindering the growth of their enterprises, which we cluster as follows:
• (Lack of) Access to finance: This refers particularly to credit, both the requirements, particularly collateral, by the banks and the application process for a loan facility.
• Export: Includes processes at banks or government agencies, requirements by buyers, as well as access to forex.
• Security: All aspects of political and religious stability, particularly the civil war in the Northern region(s).
• Regulation: Required documentation, licenses etc. to produce, process or trade, except export, which is covered in the category “Export” above.
• Political barriers: Subsumes government related factors other than sector specific regulations, i.e., corruption, infrastructure especially electricity supply and access to land.
• Climate change/ agri sector characteristics: These challenges are combined because most of the mentions are related to weather and climate-change risks; seasonality is also included.
• Market linkages: Clusters issues of accessing inputs and finding demand for outputs (excluding export), both in terms of quantities and prices (i. e. there is probably an overlap with those naming inflation as a challenge), as well as logistical concerns.
• Technology: Encompasses availability of machinery and its maintenance, management systems (particularly HR) and quality management the latter with a vague link to market linkages.
Note: Proportions are based on number of mentions of the respective challenges. More than one mention per SME allowed.
15
Challenges faced by agri SMEs
“I used lease financing to acquire a tractor and vehicle. Due to political unrest the business couldn’t repay the loan. Unfortunately, the bank doesn’t reschedule or try to understand the nature of the situation.” (SME from Adama)
The main three challenges (weighing combined over 60% of all mentions) are the lack of market linkages, access to finance, and technology. A follow up question on challenges ‘in terms of input supply as well as finding market for your products’ brought out answers along the same clusters. However, it also pointed to price inflation as an important constraining factor. This did not come out in the initial question.
Broken down by value chain stages, there are no substantial differences regarding two of the most important challenges mentioned in Figure 2 above, i.e., market linkages and inflation. They take up about 3 and 1 in 10 mentions respectively.
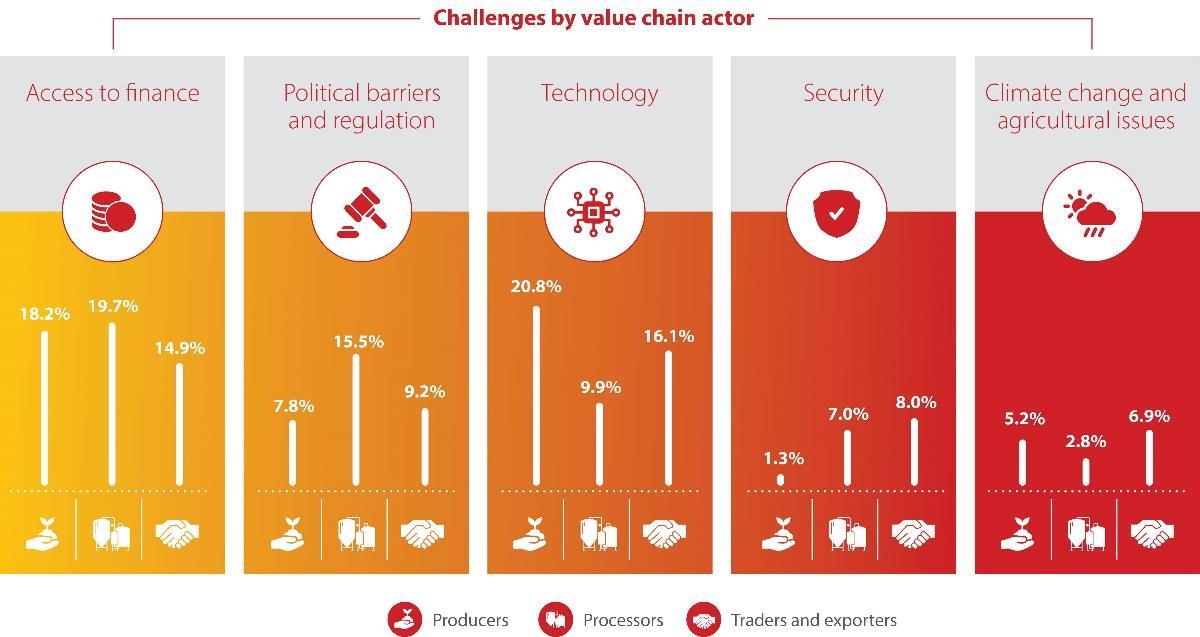
Figure 3 shows that there are modest but noteworthy differences across value chains in other areas. Processors name access to finance as their main challenge, while producers and traders/ exporters are more concerned about technology. They both name access to finance as their second-most challenge. The largest differences are between producers and processors regarding political barriers/ regulation and to technology. Processors are substantially more likely to mention policy barriers as a challenge than producers and traders. Also, processors, traders and exporters are about 6 times more concerned about security than producers.
There are no substantial differences by value chain actors for market linkages and inflation. 3.4
Findings on demand side barriers 3.4.1 Introduction
16
Figure 2 :
Figure 3 : Challenges (other than market linkages and inflation) by value chain actor
Often, SMEs do not utilize of all their options to access finance. In that sense, they impose barriers on themselves. They may not make the right efforts or may not direct the efforts to the point of best impact. These are the demand side barriers.
The literature on demand side barriers to SME finance in Ethiopia is rather thin. On the one hand, almost all authors we reviewed, as well as most development partners we talked to agree that the dominant challenge of Ethiopia’s SME finance is the macroeconomic credit constraint. Our field research does not contradict this analysis. It merely suggests that it is not the complete picture. This will become apparent if the macroeconomic credit constraint is relaxed as planned by Ethiopia’s government by way of liberalizing investment into the financial sector.6
On the other hand, demand side barriers in the form of weak financial management practices have been stipulated in the literature, but overwhelmingly by respondents from the supply side, i.e., the financial institutions. Our study offers a discussion of observations versus perceptions both by respondents on the supply side and on the demand side. It thus adds depths to the existing perspectives, which are mostly from the supply side, but not always qualified as such.
In this background, we discuss two types of demand side barriers: Financial management practices, and initiative to submit credit applications.
3.4.2 Financial management as a barrier
Financial management practices
It is a stylised fact of the SME finance literature that record keeping practices of small and medium entrepreneurs leave a lot to be desired. Accordingly, the desk study found the same weakness. Therefore, we probed into the record keeping practices of the agri-SMEs by collecting data about their record keeping / accounting and/or financial management practices.
We asked how their record keeping practice is best described; descriptions represented a range of record keeping practices, akin to ‘state of the art’ on one end, and ‘no records at all’ on the other end.7
Among the sound practices of record keeping are:8 a well maintained cashbook; separation of private and business accounts, i.e., expenditures; and deployment of a professionally trained accountant.
6 Opening the financial sector for foreign direct investment (FDI) is a policy target for 2024. The segment of mobile money services has already been opened for FDI.
7 Respondents were given the following descriptions: (a) All financial and operational records (including purchases/ inventories) organised well and kept by professional staff/ accountant, financial statements are prepared, cash registers and receipts are utilised (Labelled ‘state of the art’ in Erreur ! Source du renvoi introuvable.). (b) Financial records handled by full time/ part time accountant; financial statement produced. No formal system for controlling purchases and inventories (Labelled ‘fairly professional’ in Erreur ! Source du renvoi introuvable.). (c) Daily sales and expenses recorded in a book, no financial statements prepared (Labelled ‘basic, limited’ in Figure 3). (d) No record is maintained at all. (Not displayed in Erreur ! Source du renvoi introuvable.).
8 The first two are referred in the literature, e. g. McKenzie/ Woodruff (2016). The third one is often a requirement of lenders; in Ethiopia it is being promoted by GIZ’s SI Jobs programme.
17
We were not in position to probe SMEs’ books directly, because they would understandably not open them to strangers.
Instead, we asked them first how their record keeping practices are best described and followed up with questions about sound practices. If the record keeping practice is characterised as strong and sound, the respondent should adhere to the sound practices as well.
Questions about cash are sensitive and may negatively affect the overall atmosphere of the interview and constrain openness to share. Hence, the team directed the follow up question about record keeping on the separation of private and business accounts.
Most respondents (72.1%) stated that their record keeping practice is fully or nearly up to professional standards, while about a quarter (27.9%) stated that their record keeping practice is incomplete or even non existent at all (Figure 4).
Record keeping / accounting practices have gaps or weaknesses 28%
Record keeping / accounting practices are fully or nearly up to professional standards 72%
Figure 4 : Record keeping practice self-assessment
When it comes to sound practices, more than half of all respondents who answered the question (57.3%) stated that they separate private and business accounts, while the others (42.7%) stated that they only sometimes or never separate accounts. Thirty five SMES (57.4%) deploy a professionally trained accountant, either full or part time while 26 SMEs (42.6%) do not do so
Further analysis reveals a significant dissonance. Those who say their record keeping and accounting practices are fully or nearly up to professional standards should adhere to the sound practices; but a significant number (i.e., more than 1 in 4) of them does not: 26% do not or not always separate private and business accounts. 28% have not hired a professional accountant. Moreover, many SMEs fail more than one sound practice.
‘Lengthy procedures of banks’ might be a placeholder for record keeping practices. This is because banks do not proceed until they have the documents and reports they need. If the SME has difficulty producing them, then the procedure would be experienced as lengthy, yet the cause of delay is the poor record keeping / financial reporting practice.
Indeed, we found that dissatisfaction about ‘lengthy procedures’ was among the critiques of SMEs with loans from formal FIs. Also, SMEs without loans gave lengthy procedures as an important
18 Box 2 : A note on survey and questioning techniques
reason for not applying for a formal FI loan. To some degree, this dissatisfaction is likely a reflection of weak record keeping practices or systems.
Discussion of SME perceptions
The findings of the previous section could have different explanations. The conventional view is that SMEs lack skills or experience. This view is amply reflected in the desk study. Our analysis suggests that another reason contributes substantially to unsound financial management practices and behaviours: many of the interviewed entrepreneurs are overconfident about their professional standards. Their high opinion of their own record keeping and financial management system is not supported by the facts.
Box 3 : What is overconfidence?
Overconfidence is a form of optimism that is not justified by objective facts. It underlies several behavioural biases that affect decision making towards taking on excessive risk. ‘Excessive’ means that the actual risk is bigger than the intended risk appetite. Indeed, the adage ‘biting off more than one can chew’ illustrates it well.
These are common types of the overconfidence bias:
• Over Ranking refers to someone rating his or her own personal performance as higher than it actually is. The reality is that most people think of their own ability as above average. This leads entrepreneurs to taking on too much risk.
• Relatedly, the desirability effect refers to someone overestimating the odds of an event simply because the outcome is desirable; commonly also known as “wishful thinking”.
• Illusion of control bias occurs when people think they have control over a situation when in fact they do not. On average,people believe they have more control than they really do. Entrepreneurs who do not accurately assess their risks fail to put the required risk management in place.
• Timing optimism refers to someone overestimating how quickly he or she can do work and underestimate how long it takes to get things done. Especially for complicated tasks, entrepreneurs constantly underestimate how long a project will take to complete; and this affects their customer and supplier relations as well as their finances (when an investment takes longer than anticipated to pay off).
Illusion of control and timing optimism particularly affect entrepreneurs when their enterprise has been growing and they increasingly depend on delegated management. ‘Founder’s syndrome’ is fed by overconfidence. Governance rules are among others meant to mitigate these risks.9
We asked the entrepreneurs: which strengths and weaknesses they see in their record keeping system; and what they ’would like to do better/ be better at when it comes to the financial side of your business.
Combining the answers to these two questions, almost half (30 out of 61) of all SMEs interviewed believe that they do not have any weaknesses nor any need for improvement at all.
However, out of these SMEs: 14 (46.7%) said that they do not or not always separate business and private accounts; 10 had not hired a professional accountant; and 18 characterized their record keeping system as only partly professional or only very basic.
9 Behavioral biases can also affect team decisions, see example Kahneman et al 2013, pp. 21 40.
19
Fifty seven (93.4%) of the SMEs interviewed pointed to strengths or weaknesses of their record keeping system. Out of these, 43 saw strengths and 18 saw weaknesses while only few indicated both. Few of the strengths are specific (Figure 5), most simply mention that ‘it is working well’.
Unspecific strengths Specific strengths Weak record keeping system Lack of professional accountant
Other weaknesses
Figure 5 : Perception of strengths and weaknesses of accounting systems
In Figure 5, “specific strengths” include professional accountant/ system in place and vouchers and cash registered are used. The category “Other weaknesses” includes opening separate business accounts; training for petty cash handling skills; and implementing International Financial Reporting Standards (IFRS)
More than 2 out of 3 (67.4%) SMEs that recognized strengths in their record keeping systems do not see any weaknesses nor any need for improvement of their financial management/ record keeping system.
These contradictions indicate a significant degree of overconfidence among these respondents. In risk management terminology, these entrepreneurs ‘do not know what they do not know’ and therefore do not safeguard as well as they might (or should) have done if they knew.
Let us reflect two potential caveats, which were indeed raised and discussed in the stakeholder workshop. The representative of ATA shared the experience that SMEs always ask for training in financial management and record keeping first. This could indicate that they are not overconfident (at least not about their financial management). Of course, although well stratified, our sample of respondents is not representative. The same is true for the SMEs that affiliate with ATA. Hence, both observations could be true, but for different clusters of SMEs. Notably, our sample took care to exclude micro enterprises which form the bulk of most studies in the literature and could also be a relevant proportion of the ATA affiliated SMEs
It was noted and affirmed in the workshop that the professional accountant is mainly required (statutorily) for the preparation of financial reports for the tax authorities.10 For that reason, some SMEs, and even other stakeholders, questioned if having a professional accountant full time is really indicated, because supposedly an accountant is only ‘needed’ for a short time in the year. This indeed suggests that the financial reports are neither prepared at least quarterly, as would be sound practice, and moreover are not used to inform management decisions.
In line with this conversation, the data shows that respondents almost fully equate ‘having a financial management system in place’ with deploying a professionally trained accountant. All but one said they have no financial management system in place (financial records are not kept) do not deploy a
10 Whereas we did not ask if they are externally audited, we infer from this discussion that most of them are.
20
15% 30% 45% 60%
0%
professional accountant. All but two said they do have a financial management system in place do deploy a professional accountant.
Discussion of FI perceptions
FIs see weaknesses of the entrepreneurial mind set as well as lack of important business skills, but do not question adequate sector knowledge ( Figure 6)
see Figure 6).
Business Skills
Figure 6 : SME weaknesses as perceived by FIs
The entrepreneurial mindset includes a separation of the enterprise from the family, the search for opportunity to grow the enterprise, and the durability of the enterprise; as in ‘sticking with it’ rather than giving it up quickly. The latter is often observed (by some of our FI respondents) when another economic activity, or in the case of female entrepreneurs, pressing demands of the household come up.
Some respondents explicitly referred to youth group enterprises that a programme of the Ethiopian Government supports and at times, apparently, creates. These youth group enterprises have a bad reputation. One respondent said that this programme damaged the credit culture in urban Ethiopia. This is mirrored by feedback of at least one SME operator who observed that these groups receive many resources but do not work for them, nor intend to.11
The largest proportion of SME weaknesses12 is taken up by business skills. Here, financial institutions including the investment funds see gaps in the accounting systems and set up of financial departments in the SMEs. For instance, if an SME applies for a loan to finance an investment plan, it cannot convince the lender without producing financial reports that show profits and profitability in past periods of operation, as well as showing how these profits relate to using its current equipment to full capacity.
Business skills also include the understanding of how to work with investors/ lenders, i.e., to comprehend the difference between a loan (or investment) and a grant. FIs also see the need of SMEs to improve marketing and planning (for growth) skills.
11 The authors did a quick follow up research on development programs that target youth entrepreneurship in Ethiopia. Several have been or are operating, funded by various donors, but we can not specify to which of these our respondents refer.
12 By mentions. In total 6 FIs gave feedback on this question.
21
Entrepreneurial Mindset
Sector knowledge Marketing/ market linkage
Planning (for growth) Financial department/ accounting system
Several respondents from the supply-side, as well as from development partners, expressed the same opinion that is prevalent in the literature. They see these weaknesses as manifestation of lack of skills and experiences that can be built and model-created respectively through training.
Some of them said that the SMEs do not know the right accounting and financial reporting practices, and that they look for ways to provide such training. The requirement of a trained accountant also corresponds, as it introduces the formal skills and (hopefully) experience with the subject matter. One GIZ program subsidises hiring such a trained accountant as part of their partnership package for SMEs.
The investment fund insists on control of the financial management processes, culminating in setting up the financial department according to investor’s requirements.
Accordingly, some of thefinancial institutions offer respective training programs for SMEs, e.g., Coop Bank and Renew Investment Fund. The latter’s program covers, over about 45 teaching hours delivered in 2 3 months, a focus on execution across the enterprise (strategy, finance, marketing, etc.) with financial, governance, and leadership topics (see Annex 5).13
However, in the stakeholder workshop SMEs questioned if the quality of their records is a decisive factor in accessing finance, more notably credit. They shared negative experience about non transparent requests and ‘shifting goalposts’ when it comes to the loan application requirements communicated by the financial institutions. This argument is supported by our data which shows that the relationship between access to loans and quality of financial management practices is very weak indeed (details see annex 3).
3.4.3 The application for formal loans as a barrier
We also asked agri SMEs why they did not apply for loans at FI. Most respondents affirmed that the FIs lacked suitable products meeting their needs and had too lengthy procedures or that they had applied but were rejected.
Moreover, we found that many respondents thought that FIs only accepted built property as collateral, while they did not have such collateral. Some feared to lose the collateral in case of repayment difficulties. Therefore, they did not apply for FI loans in the first place “[Private banks are] rushing to sell collateral due to missed payments. They shouldn’t run for such options, but first attempt to support the borrower to change his situation in all possible ways grace period, refinancing, etc.” (SME from Adama)
These reservations are further solidified by the perception that informal sources of credit are much more convenient in terms of requirements, speed of access and presumably pressure with repayment schedules Iquub loans were characterized as simple and collateral free (details on semi and informal finance are given in annexes 3 and 4).
It might be hypothesised that SMEs deliberately do not produce adequate reports because they are not willing to share (financial) performance information. The conversation about the use of financial reports for taxation purposes purely (see 3.4.2) might be seen as an indication in that regard.
Our field research instrument did not probe into (lack of) willingness of SMEs to share information, or decisions, with lenders or investors. However, supply side feedback, particularly from the investment fund interviewed, suggests it plays a role As an equity investor, the fund engages more intensively with the governance and financial management systems of its (potential) investees than a lender does In several cases, they did not enter, or did not continue, investment with agri SMEs
13 These trainings are ‘priced in’ for investees of the fund; at the same time, they offer them when development agencies make funding available, e. g. USAID. Others who mentioned plans for training where vague about the financing side, leaving the impression that they are looking for government or development agencies to ‘foot the bill’.
22
because the owner managers were not willing to change their financial management structures and decision making processes, meaning that they were not ready to overcome ‘founder syndrome’.
23
Supply side barriers
4.1 The chapter in brief
Section 4.2 gives a brief overview of agricultural finance activities of our responding FIs.
The demand side survey affirmed that agri SMEs find it difficult to provide the collateral required, which is the central element of the supply side barriers to agricultural finance. Table 4 gives an overview of the findings on supply side barriers.
In section 4.3 on major findings, we start with the discussion of collateral in section 4.3.1. Relatedly, Ethiopia’s FIs have hardly developed any agrifinance products; those that exist are ill aligned to the operations of SMEs. Collateral is one of the features of a loan product. Designing a loan product that fits the demand of agri SMEs would inherently address the issue of collateral. Conversely, FIs cannot just relax their collateral requirements in an isolated move. They must revisit their risk management approach and techniques.
In other words, for an FI to venture into agri-SME finance, it must adopt a strategy that is driven from the leadership of the organisation. Unfortunately, the majority of the interviewed FIs have not established either an agrifinance and/or an SME strategy. We discuss these financial product perspectives in section 4.3.2.
Ethiopia’s credit market is over collateralised, as compared to other credit markets, because it is credit constraint. The desk study explains this macroeconomic condition, and the initiatives of Ethiopia’s government to overcome them. We briefly review this challenge in section 4.3.3.
Table 4 : Main findings on supply side barriers
Field research finding Affirms desk study? New insight
Type and valuation of collateral are inadequate
Lengthy (and non transparent) processes
yes
• ‘Valuation’ is the mechanism to reach the required collateral to loan amount ratio14
• Curtails the loan amount and hence its usefulness to the business
• Adds to suspicion / fear and thus keeps SMEs from applying for loans (rather go for semi/ informal sources)15
yes
Inflexible handling of customer relationship partly yes
No dedicated agricultural loan products
partly yes
• Some SMEs reported attempts to extort bribes for processing their loan application
• Many SMEs shared that they access (short term) loans from suppliers or buyers
• Some SME customers are more satisfied with their banks than others
• SMEs want at least quarterly instead of monthly repayment
• Lack of loans that assess risk and loan amount based on business performance and value chain links, hence accept non traditional collateral
• Lack of liquidity finance (e.g. overdraft)
• Lack of investment finance (3 5 years tenure)
• Banks and SMEs lack agri a/o SME finance strategies!
14 This complaint was recorded in some of the interviews and solidified in the 2nd validation workshops: SMEs said that banks deliberately give much below market valuation to the collateral pledged. This has two practical effects: On the one hand, in case of foreclosure, the FI can conveniently sell off the collateral and cover its loan. On the other hand, the FI can use this as a mechanism to determine the (lower than asked for) loan amount in line with its own concerns (credit constraint, as explained in the desk study).
15 Expressed in more technical terms, the FI has an incentive to move delinquent loans (i. e. those with repayment over dues) to default loans (i. e. those that are deemed inacceptable over due and thus the entire loan amount is declared due).
24 4
4.2 Brief overview of status and conditions of FI’s offers to agri SMEs
From the interviews with FIs, they have been financing various activities by farmers, cooperatives, and SMEs as well as larger enterprises. The strongest engagement appears to come from the (public) leasing companies. Leasing companies have been financing production equipment about a range of agricultural value chains (Table 5). Noteworthy, while banks and DBE have been financing tractors and combine harvesters, only one of the leasing companies has recently ventured into that.
Table 5 : Financing of activities along VC stages
Financing
Four out of ‘our’ MFIs and banks (VF, Addis MFI, Awash, Coop bank) provide loans to agri-SMEs with funding from international donors. An overview of the agri credit, leasing, and insurance products that the surveyed FIs mentioned to be used by agricultural SMEs are given in annex 2
Several of the SMEs who had previously accessed FI credit said that they plan to apply for a bigger loan. They seek working capital to expand the volume of their current operations, and they pursue investment plans to expand and diversify their current operations.
A few of them shared details, i.e., had specific plans and collected information about the lenders’ requirements. Most plan to apply at DBE or at banks; specifically mentioned were CBE, Coop Bank, and Hibret Bank (Table 1Table 6). Noteworthy that none of those who mentioned specific banks was a current borrower of the same FI.
We did not systematically check all the requirements of the lenders we interviewed, but figure 10 (in annex 2) shows exemplarily the documents required by one of them.
16 Respectively insuring. 17 Milling, bakery, pasta making.
25 • Agri insurance (crop, livestock) however is available
of16 MFIs Banks DBE Leasing companies Insurance companies
✓ ✓ ✓ Crop
✓ ✓
✓ ✓
17 ✓ ✓
✓ ✓
✓
✓ ✓
Production Tractors a/o combineharvesters
farming
Animal husbandry
Processing Cereals
Meat
Honey
Dairy
Coffee ✓ Export Cereals (Sesame) ✓ Coffee ✓
FI Loan amount (ETB) targeted
DBE
Bank
one each mentioned Hibret Bank, CBE, Coop Bank four mentioned a bank generally
MFI
One mentioned Addis MFI One mentioned MFI generally
4.3 Major findings
4.3.1
Requirements
from 3m to 65m
from 0.5m to 40m
15m 2m
30% of project cost as own capital
Number of respondents (SMEs)
Increase capital (from 4.5 to 7.5m birr for 3m loan) 6
Physical collateral, e. g. vehicle Feasibility study Audit report 7
Physical collateral Expects alternative collateral options 2
Collateral is the main barrier for SMEs’ access to credit
Limited range of collateral accepted
SMEs who did access loans and SMEs who did not were united in their criticism of the collateral requirements of the banks. They perceive these collateral demands as rigid and excessive18: 46% of the interviewed SMEs did not manage to access a loan, either because their application was rejected or because they did not apply in the first place. Interestingly, a sizeable number (10 SMEs) said they did not need a loan. The reason for rejection was almost always type, quality or valuation of collateral. Accordingly, over half of those SMEs who did access a loan had complaints about the collateral that banks were accepting and the valuation at which they did accept it. For instance, a coffee processor said that the banks only give loans when registered buildings are pledged as collateral, but even then, they give smaller loans than applied for. Noteworthy, there is no systematic relationship between the agricultural value chains in which SMEs operate, and the constraints or approval of the loan application.
Figure 7 shows the reasons for dissatisfaction of respondents who have accessed loans. More than half of those who aired dissatisfaction have based it on collateral or repayment schedules being misaligned with their cash flows (see 4.3.2 below). Both are loan product features and point to gaps in terms of services and/or capacity on the side of the FIs.
18 This is affirmed by the desk study which indicated collateralization of up to 200%. Most of our respondents were not specific about the proportion of collateral to loan amount, though.
26
Table 6 : Requirements of selected Ethiopian banks, as reported by SMEs
Disatisfaction with loans 77%
Figure 7 : SMEs’ satisfaction with loans
19
Valuation of collateral pledged
“They [banks] are the ones who cripple our business [by giving smaller loans than needed].” (SME in Hawassa)
The low valuation is an expression of over collateralising loans. For instance, if a building is ‘valuated’ at one third of its market value (as SMEs see it), that is roughly equivalent to collateral of 300% of the loan amount.
From the vantage point of the bank, it can liquidate such collateral easily, because the bank would offer it below market price and still recover its loan and interest completely. From the vantage point of the SMEs, this is an additional barrier, as one coffee processor explained: “The bank sold [my] father’s property at below market price. Their policy doesn’t cover borrowers, private sector is not protected. In case of problems banks run to sell.”
Semi-formal alternative: supplier/ buyer credit
SMEs therefore prefer to borrow from buyers or suppliers because these do not ask for collateral. Suppliers or buyers basetheir advances on the business scope and performance of the SME. Twelve SMEs (42.9% of those without access to bank loans) shared that they access credit from suppliers (10) or buyers (2) (see annex 4). The amounts range between 50,000 and 200,000 ETB (in 2 cases substantially higher, up to 3m ETB) and are usually given for 1 to 3 months. This is pure bridge financing to support the operations / cash flow.
Movable (non traditional) collateral
Only 5 SMEs said that the FI had shown flexibility regarding type of collateral, accepting sales contracts and/or vehicles. This was regularly related to export. Generally, those engaging in export found the banks more attentive, also offering specific products, e.g., a pre shipment loan by Dashen Bank. The flexibility was also related to the source of the funding, e.g., World Bank.
Early in 2021, the National Bank of Ethiopia (NBE) introduced a movable asset registry. Later in the same year, NBE obligated all banks to allocate 5% of their loan portfolio to loans against movable
19 It means that the bank accepts 30% of the market value as collateral. ‘Valuation’ seems to imply that the bank disputes the market price. Whereas establishing market prices of buildings can be a source of dispute as well, that is not the main issue at hand here.
27
no issues 23% collateral 26% repayment disaligned from cashflow 19% Cost 11% Loan amount too small 15% Corruption 6%
collateral. The intention of this regulation is to increase lending to players in the agricultural sector (SMEs as well as individuals or coops). Some conversation partners, particularly from NBE, were concerned that banks are circumventing this rule instead of expanding agricultural lending.20 Yet, others expressed interest to explore options to meet the intention.
It is noteworthy in this context that Ethiopia’s insurance companies offer both crop and livestock insurance, as well as fire and other asset insurance. About half of the responding SMEs indicated that they had insured some of their assets or livestock (see annex 2). Hence, the techniques that insurance companies use to identify and locate movable assets should offer a feasible entry point for lenders to do the same for the purpose of movable collateral.
Collateral-based versus cash-flow-based lending
On a broader note, collateral based lending is the simplest form of lending. However, collateral relates at best loosely to the activities and hence financial needs of an enterprise. Cash flows represent these activities and financial needs, and they should therefore be the reference point of lending. However, cash flow based lending is more complicated, and therefore requires investment in staff skills and in processes to document, assess risks, and monitor loans.
“[Banks should] understand the business nature and avail funding when needed and also align repayment periods to the seed marketing season. For instance, I require finance before December and March/April/May are sales months. Hence repayment could be made then. Monthly repayments are not suitable.” [SME that produces seeds in Bishoftu]
4.3.2 FIs’ agrifinance capacity
Opportunities unexplored: agrifinance products that SMEs need
We asked SMEs what they look for in the agrifinance products that Ethiopia’s FIs offer. The SMEs that have experiences with bank loans clearly described what they need. First of all, they want that loan amounts are determined based on their business operations, and not “arbitrary [...] without analysis of need for working capital”, as one of them put it. They want these larger loan amounts with repayment schedules that are aligned to their cash flows (though not all of them use that technical term). They also want loans that cover both investment and working capital and have longer tenures of 3 5 years (Table 7)
On an additional note, many also think that the costs of the loans are too high.21 “Repayment is quarterly, but our cash flow only allows to make repayment every six months. The nature of the business is that we buy and store required inventory for the year, or at least buy to fulfil six months’ demand, not to fail on orders. Once we miss order, it will result in cancellation and it is difficult to get the customer back.” [SME from Oromia]
20 Some FI respondents related that (unnamed) banks are reporting their existing vehicle loans under the new requirement. Moreover, the regulation allows banks to wholesale lend to MFIs. It is uncertain, probably unlikely that MFIs will offer these funds through loan products (which they do not have right now) for SMEs; i. e. missing middle, see chapter on background. The NBE is aware of the implementation
21 Reference from the authors’ expertise: The average lending rate by MFIs for MSMEs is about 19% p. a., while for banks it is a bit lower at about 14.3%
28
Table 7 : Loan product features agri SMEs would like to see Loan Product Feature What agri-SMEs need / would like to see Tenure ➢ 3 5 years Grace Period ➢ 6 months Repayment Rhythm ➢ Minimum: Quarterly ➢ Ideal: Aligned to cash flows of the enterprise
challenges of this regulation and considers tightening it.
Appraisal process and loan structuring
Other loan purposes
➢ Analyse the nature and performance of the SME operations
➢ Approve loan amount adequate to the operation
➢ Loan amount to cover working capital and investment
➢ Loans for vehicles to cover full cost
➢ Overdraft facility to smoothen liquidity flows
➢ Intermediate liquidity facility to smoothen operations over deferred payments (or ‘factoring’)
Some of these demands should be fairly easy to meet, i. e. the requirements on systems and HR capacities of the FIs are not very specific, for instance quarterly repayment or an overdraft facility.
This is further supported by conversations with the respondents in which they explained how the banks fail to provide them with working capital finance:
Several respondents noted that there is no overdraft facility, for instance to pay salaries at the end of every month; even if the bank knows that the account has a substantial turn-over for many years.
One SME narrated: “We would like to sell our product [peanut butter] through supermarkets but they only want to buy on credit. We cannot afford to wait for the payment for 90 days, because we have to pay our suppliers as well. Therefore, until we grow enough, we have created another strategy to sell through our own agents in the local markets.” (SME from Addis Ababa). Factoring would be a fairly simple instrument to cover this demand.
Agricultural risk management
However, not all these features can be changed at once without affecting the income flows and risk position of the FI. Therefore, there is a trade off between introducing some of these features and the costs of the loan. Beyond ‘tinkering’ with one or two features, agricultural loan products will require a specific risk management framework. That means staff have to gain capacity to appraise agricultural risks and to structure loans accordingly. For instance, agricultural risks vary with seasons, agronomic practices and locations, available risk mitigation measures (such as crop insurance), and other factors.
The FIs also need to introduce systems to process according to information and use it in loan decision, disbursement, and monitoring.
Strategy and
agri SME finance
In summary, the conversations with the FIs as well as with the agri SMEs showed that the former have not developed a strategy to serve the latter. This is, on the surface, contradicting the finding that almost all of them have SME departments (as well as one of the leasing companies, while the other did not have one). However, particularly the public FIs were very vague at best about the definition of small and medium enterprises, and sometimes used the term confusingly, e.g., Addis MFI considers SMEs as groups of (up to 5) youth that are formed and trained under a government programme. Both Addis MFI and CBE have an SME department as well as a business loan department; it seems the latter covers SMEs as they are conventionally understood. Thus, the problem of the SME definition that was identified in the desk study is an important aspect. It is not only a reference point for reports and statistics but also the basis for thinking clearly and strategically about this market segment, which is of outstanding importance to the economic development of Ethiopia.
The prioritisation of challenges that prevent banks and MFIs from serving (agricultural) SMEs differ by private and public financial institutions (Table 8): Private financial institutions are mainly constrained by lack of loanable funds (see also 4.3.3), by the collateral SMEs are capable to pledge, and also by lack of ID to track borrowers.22
22 None of the SMEs mentioned issues with ID as a challenge. ID is part of ‘Know your customer’ requirements which are set by the NBE.
29
Public financial institutions lack SME strategies and the capacity to organise and deliver agricultural finance. Some of the respondents pointed to their participation in the World Bank’s WEDP programme which built their capacity to develop and deliver SME products.
Both private and public microfinance institutions (MFIs) lack agrifinance strategies. Nonetheless, those operating in rural areas do finance farmers, regularly through group loans.
Hibret Bank, a private FI, on the other hand, considers SMEs an important target group, due to interesting cross selling opportunities. They have SME lending tools, policies, procedures and processes, and capacity in place and plan to expand mid term to up to ETB 6.5billion disbursements to SMEs. Most of their SME customers are urban based manufacturers though.
Awash Bank the largest private FI stated that they see no incentives to go to the agricultural sector, except if funding is made available for this sector. Such funding may come either from development partners or from direct deposits from the target group. For instance, traders and off takers in coffee and sesame (VC) are financed by external funds.
The capacity gap of serving SMEs, let alone agricultural SMEs, is also reflected in the last column of Table 5 above. Most financial institutions are not able to give reliable answers about the number and types of SMEs they reach. Furthermore, none of the financial institutions, except for the insurance companies, have agricultural departments or divisions.
Table 8 : Main challenges, private and public banks, and MFIs
Challenge Banks MFIs
Private Public Private Public Strategy
Lack of SME strategy X X
Lack of agrifinance strategy X X Agri risks/ climate change X X Finance Loanable fund X X Operational Agrifinance capacity X X Collateral X X Lack of ID X X Client attitude X X
4.3.3 FIs’ credit funding constraints
Financial products for SMEs on the one hand, and for the agricultural sector on the other hand, pose challenges to financial institutions and financial sectors everywhere. Concepts and techniques of lending to SMEs have to be applied skilfully, and success a dedicated strategic alignment by the leadership of the financial institution. For full effect, regulation has to mirror these strategies. Legal frameworks for leasing and for movable assets are examples.
However, in Ethiopia the challenge is magnified by macroeconomic conditions that create an overall credit constraint. For instance, when this study was written, the NBE had instructed banks to stop lending, because it added to the imbalances in the forex market.
Accordingly, leasing companies said insufficient availability of forex is their main constraint. They related that annually half of their customers are ‘stuck’ in the procurement process; and that delivery of the leased asset is regularly delayed by six months and more, because of forex shortage. This overshadowing issue is also reflected in the feedback from most FIs as well as development partners that interest to embark on SME lending is linked to availing dedicated funds. The issue of collateral is rooted in this credit constraint. It is a rational way for FIs to allocate the scarce loan funds.
Finally, high costs of loans are caused by low competition, which is caused by constrained access of foreign investors to the financial sector. Several donor programs, e. g. by the World Bank, USAID,
30
have provided FIs with loan fund on condition that they lend it to MSMEs. These programs regularly provide technical assistance for the FIs to build the required capacity. However, international experience suggests caution many FIs do not continue lending to SMEs when the donor funding comes to an end.
31
5 Summary of recommendations and proposed interventions
The recommendations are informed by the validated desk study as well as by the results of the recently conducted field survey and its numerous interactions with stakeholders from the supply- and demand side. The recommendations are designed to address and alleviate key barriers to agricultural finance for agri SMEs in Ethiopia. They are designed to take advantage of lessons learned from international best practices while also considering local specifics and past local experiences. All three proposed interventions are closely interlinked and shall not be understood as individual measures. According to GIZ multi level approach to agricultural finance, the interventions are proposed with the objective to follow a holistic approach impacting various levels of the country’s Agfin ecosystem.
It is suggested, in a first step, to present the derived recommendations for potential interventions analyse and discuss them in detail with GIZ, assess and validate their relevance for GIZ’s and other donor’s and organisation’s objectives, before comprehensive options for pilot interventions including expected results (e.g. milestones), outputs, complete activities and cost estimations shall be drafted. If feasible, it might be useful to organise a short workshop with relevant other stakeholders active in the space of agricultural finance in Ethiopia to further elaborate, fine tune and align the potential pilot interventions and explore the opportunities to sustainably embed them into existing initiatives or draft a new integrated approach to create impact amongst the identified target groups. The proposed approach works towards the objective to be more efficient and results oriented, since the development of all inclusive sets of pilot interventions that might eventually not be considered as applicable and/or suitable might not be feasible.
MESO
Figure 8 : Proposed TA activities by intervention level


Improving the skill set of agri SMEs in Ethiopia seems crucial for a successful inclusion of the vast majority of AVC participants, especially medium level business, and financial management skills such as record keeping, accounting, and financial capability lack amongst the target group. It is not all about making agricultural SMEs “bankable”, but rather to equip them with the required knowledge and necessary skills and tools to successfully run their businesses as self determined entrepreneurs.
Intervention Level Micro Level
32
AGRI-SME
1. CAPACITY BUILDING AND MENTORING SUPPORT MEASURE FOR
S (BUSINESS/ENTREPRENEURSHIPSKILLSDEVELOPMENT)
Addressed key barriers to Agric finance for SMEs
TA component
Lack of management capacity and governance structure in agri SMEs
Lack of financial and operational management systems in agri SMEs
Lack of management skills, business experience and the application of inadequate accounting, record keeping, and financial management practices
The technical assistance component involves a detailed Training Needs Assessment (TNA) of participating agri SMEs. In addition to the standardized externally driven TNA, there is the possibility to incorporate an agri SME self assessment tool facilitating the internal (self-driven) evaluation of the target group’s skills set, i.e., their financial management, record keeping, and accounting skills, as respondents displayed a significant degree of overconfidence and overestimation of their capabilities. Subsequently, the measure will provide a modular capacity building / coaching / mentoring scheme allowing the agri SME to acquire predefined skills and competencies relevant for the successful and sustainable management of the business. In addition, the TA encompasses the organisation of pitching events bringing together FIs and financiers and participants of the mentoring support measure for agri SMEs. The pitching events will be used as platforms to apply for funding but also to network and build market linkages with other AVC actors.
Finance component
Benefits
Risks
Pre-conditions
Potential synergies with interventions of other stakeholders
Debt funding instruments such as credit lines earmarked for specific AVC or equity investments offered by investment funds could be a value adding element of the measure.
The tailor made capacity development approach for identified growth oriented agri SMEs strengthens and benefits individual businesses/ entrepreneurs (SMEs), FIs exposure to agricultural finance and AVCF and the maturity of targeted agricultural value chains.
If selected agri SMEs are not committed to the mentoring support measure, they may not adopt any of the knowledge transferred. As such, there needs to be a mechanism of self contribution that fosters commitment and dedication. The same counts for partnering FIs and financiers at pitching stage.
Strong selection mechanism/diligence for participating agri-SMEs. Strong level of commitment required from SMEs, FIs, and mentors/coaches.
RENEW (modular)
GIZ AgBAIT (modular)
GIZ Agri-SME Loop (modular) Technoserve (coffee value chain)
USAID “Feed the Future”
Others
Potential beneficiaries Agri SMEs, FIs, agricultural sector
Potential impact Medium
Difficulty Moderate, due to the close collaboration with experienced partner entities
33
Potential pilot interventions
• Series of modular classroom (or e learning) trainings on business and financial management for agri SMEs in pre defined agricultural value chains (and regions) for up to 125 agri-SMEs
o 4 training sessions at 3 hours for 25 participants/group for 5 training groups
▪ 2 sessions on business management and 2 sessions on financial management
o Business management covers: Human Resources (HR) management, business planning, business operations (including logistics and transport), access to inputs, sales and marketing (market linkages), access to finance/bankability/investment readiness, etc.
o Financial management covers: Financial statements, accounting, book/record keeping, budgeting, controlling, etc.
o Potential AVCs: Cereals (incl. flour mills), Dairy, Vegetable/ fruit/ spices, and Coffee
o Potential regions: TBD
• Series of individual mentoring and/or coaching sessions for up to 12 agri-SMEs in pre defined agricultural value chains (and regions). The 12 agri SMEs will be identified throughout the training sessions according to a set of pre defined criteria
o Up to 5 individual sessions for 3 hours deepening the most prevailing areas of the training sessions with a focus on investment readiness / bankability (A2F)
o The mentoring/coaching sessions will also include a preparatory workshop for the scheduled pitching events
• Organisation of up to 5 pitching / matchmaking events for trained SMEs as well as identified partnering financial institutions
o The pitching / matchmaking events are designed to serve as a platform to link agri SMEs with financial service providers and other AVC members (business links)
o Each pitching / matchmaking event at 3 4 hours might be co organised by (hosting) partnering FSPs or other stakeholders (e.g., chamber of commerce)
o Up to 25 trained and all mentored/coached 12 agri SMEs will have the chance to pitch their business and managerial skills set to partnering FIs and financiers
2. INSTITUTIONALCHANGEMANAGEMENTPROCESS (AGRICULTURALFINANCE)
Incentivising or encouraging financial institutions to explore new and unknown economic (sub ) sectors like agriculture or agricultural value chains (AVC) with a long term vision requires more than an attractive credit line or a simple TA approach that focuses on capacity building activities for front office staff or the training of (credit) risk officers it requires institutional change led by the FI’s senior management. Therefore, supporting an institutional change management process (ICMP) with a focus on agricultural finance requires a TA approach that ignites and facilitates the internal exploration and growing into a new and demanding business segment, building upon the five classical steps of change management:
I. Preparing the FI for Change.
II. Mutually developing a vision and plan for Change.
III. Implementing the Changes
IV. Embedding the Changes within the FI’s culture and operational practices.
V. (Reviewing progress and analyzing results achieved).
The ICMP encompasses all organisational levels as well as operational and back office departments of a partnering FI (PFI) and it involves leveraging the FI’s existing affinity, experience, and orientation towards the agricultural sector. That is the reason why a conscious selection of the PFIs is crucial for the successful implementation of the recommendation as suggested. But, as mentioned above, the ICMP requires more than technical, administrative, and operational changes The key element is the change of mind set, the change of institutional culture and identification with the agricultural
34
sector as a comfortable, “go to” business sector that generates income and contributes to the PFI’s growth and long term sustainability.
Intervention Level Micro-Level
Addressed key barriers to Agric finance for SMEs
TA component
Finance component
Lack of strategic business focus towards agri SME financing
Lack of agricultural (finance) knowledge among staff and management
Lack of credit assessment and risk management tools and methodologies to serve agricultural clients
The TA approach involves the abovementioned ICMP steps. Depending on the available timeline for the TA intervention, the activities can be designed accordingly. In any scenario, the TA includes the provision of management support in terms of strategic planning, as well as technical and operational capacity building, organisational development, and cultural change facilitation in addition to the facilitation of the overall ICMP with senior management.
Two scenarios could be considered (depending on GIZ’s orientation):
1) Local subsidies financing technological innovation in line with the ICMP towards agrifinance (e.g., laptops, tablets for front office staff, dynamic MIS system, development of agri tech cards as reference system, etc.)
2) Innovative new agricultural credit lines (or leveraging existing lines) or blended finance instruments in collaboration with interested stakeholders and/or donors such as KfW, USAID or IFC.
A combination of a TA component with a finance component could create additional incentives for PFIs but is not necessarily required for a successful implementation of an ICMP.
Benefits
Risks
Pre conditions
Potential synergies with interventions of other stakeholders
A dedicated FI, with an institutional agrifinance orientation and vision, led by passionate management and carried by trained staff members can be highly impactful for rural communities as well as the agricultural sector as a whole and lead subsequently to increased financial inclusiveness, higher agricultural productivity, job creation, income improvements, and poverty reduction
PFIs might be overwhelmed with the holistic approach and may initially struggle to understand the concept and complexities of it. In order to mitigate the risk, it is crucial to work out the business case of agrifinance at an early stage of the process allowing the PFI to quickly buy into the required allocation of human and capital resources necessary for the successful implementation of the ICMP.
Time involvement: this approach is to be considered long term, as it would take some years to properly implement ICMP.
The existence of a certain level of affinity, experience, and orientation towards the agricultural sector is the main pre condition. In addition to a very passionate and driving senior management that understands the long term nature of the process, geared towards sustainability and continuity.
KfW (upcoming SME finance facility EUR 25m) Others (tbd)
Potential beneficiaries Coop Bank of Oromia, Wasawa MFI*
* Just a tentative proposal based on held supply side interviews, but set of transparent selection criteria can be developed
Potential impact Medium
Difficulty Moderate, due to conscious pre selection of PFI(s)
35
Potential pilot interventions
• Based on pre defined transparent selection criteria, up to 2 partnering financial institutions will be selected to be guided through an institutional change management process (ICMP) with the objective to embed an institutional mindset and culture in favour of agricultural finance
• Over a period of up to 6 months, the selected PFIs will be accompanied in the ICMP, that encompasses:
o Agric finance maturity assessment and general TNA o Development of a detailed ICMP road map, including the following:
Strategic management consulting and coaching ▪
Blueprint for an organisational structure catering for an agricultural finance business model, according to international best practices
Internal and external awareness creation and communication strategy
Technical and operational capacity building for operational staff and management
Potential support in operational and risk management frameworks (to be discussed)
o Implementation of the developed ICMP road map in close cooperation with the PFI’s senior management
36
▪
▪
▪
▪
CREATION/ SENSIBILISATION
Creating awareness in the Ethiopian financial sector about dedicated AVCF approaches requires a concerted approach that involves various donors and/or stakeholders. Based on previous experiences from other countries, it is recommended to anchor a sector wide awareness creation/sensitization approach to a strong and reliable local institution, capable of supporting an envisioned public/private dialogue about agricultural finance in Ethiopia. Here, advantage can be taken from the huge body of regional and international experiences on the subject.
Intervention Level Meso Level
Addressed key barriers to Agric finance for SMEs
TA component
Lack of access to finance by agri related SMEs
Lack of market linkages between actors within AVCs
Lack of agricultural VC (finance) knowledge among stakeholders and FI’s staff and management
The technical assistance consists of the identification process for one or more partnering entities, e.g. National Bank of Ethiopia (NBE), Ministry of Agriculture (MoA), Ethiopia Bankers Association (EBA), etc., to anchor the sector wide awareness creation/ sensibilisation exercise with the objective to bridge the agricultural finance gap through a public private dialogue that will lead to a better understanding and adapted and improved agricultural finance policies, instruments, and incentives. In a subsequent step, the TA will establish and operationalize a dynamic platform for the subject matter intended to organise and host events, roundtables, and information meetings for public and private stakeholders. The series of events and activities will create awareness and promote innovative approaches and practices in agricultural finance and strengthen, at the same time, the capacity of national partners. To this end, capacity building activities / trainings could be geared to (1) demonstrating the business case and set up of appropriate AVCF methodologies and to (2) acquiring and processing in depth information to make informed decisions regarding the implementation of agricultural finance strategies on both public and private level (e.g., FIs)
Finance component N/A
Benefits
Risks
The exposure and introduction of AVCF concepts and methodologies to a broader spectrum of market participants will increase the level of understanding regarding the importance of strengthening and/or the consolidation of market linkages among agricultural value chain participants. A public/private dialogue bears as well the potential to sustainably sensitize decision makers and local partner organisations to make informed decisions on various levels of the political and/or financial ecosystem. Results can be fed into the operationalisation of recommended interventions 1 and 2 and vice versa.
Difficulties in finding a reliable and interested partner entity to anchor the sector wide awareness creation/ sensibilisation intervention. A guided dialogue is valuable to share knowledge and awareness about agricultural finance but might be limited in creating tangible impact.
Pre conditions General interest in agricultural value chain finance among stakeholders and the sector in general.
Potential synergies with interventions of other stakeholders
tbd, e.g. IFAD, KfW
Potential beneficiaries Public and private sector, financial sector, AVC participants
Potential impact Medium
Difficulty Moderate, due to huge body of regional and international experiences on the subject
37 3. AGRICULTURAL VALUE CHAIN FINANCE (AVCF) SECTOR-WIDE AWARENESS
Potential pilot interventions
• Within a time period of up to 6 months, lobbying for an intensive national dialogue on agricultural (VC) finance and identifying a suitable partner entity to anchor the sector-wide awareness creation/sensitization approach. An MOU shall be signed within 3 months of the TA intervention.
• Establishment and operationalization of a dynamic platform for the subject agricultural (VC) finance intended to organise and host at least a series of 3 events (e.g., workshops/webinars), 3 roundtables, and up to 6 information meetings (business breakfasts, association gatherings, etc.) for public and private stakeholders.
• A series of capacity building activities, mainly incorporated in the schedule of the abovementioned events and workshops/webinars, as well as up to 6 specific training sessions on identified subject matters (2 each for partner entities, financial institutions, and agri SMEs, or combined sessions if subject allows).
38
Annex
39 6 Annexure
1: Profile of agri-SMEs interviewed
Table 9 shows how our respondent SMEs were sourced and the response rate we achieved
Banks/
Development
Government
Coop Bank United Bank VF DBE GIZ / Sequa SMEFP AACC SA FEMS EDA Others Total
0
0 0 0
0
0
2 7
50,0% 28,6% 50,0% 100,0%
Out
the
small and medium sized agri businesses visited,
owned
10: Gender distribution23 Female owners Male owners 15 49 The large majority of the
interviewed were the owner
the manager of the business in
10 respondents were only managing the business. Table 11: Respondent’s role Owner and Manager Owner only Manager only 43 8 10 The dominant legal form of the agri businesses was Sole proprietorship, followed by Private Limited Company (PLC). Table 12: Legal form of organisation Sole proprietorship Partnership PLC Share company 35 8 17 1 The 61 agribusinesses can be distributed to different agricultural value chains. The majority operates in the cereals value chain. Table 13: Number of respondents per value chain Cereals (incl. flour mills) Dairy Vegetable/ fruit/ spices Coffee Honey Others24 19 12 11 7 6 6 Considering the number of respondents per value chain (Table 14), the number of full time staff is highest for the cereal value chain with an average of 38 full time staff. The most seasonal employees are hired in the coffee value chain. 23 3 companies are co owned; hence the total here is higher than the 61 SMEs 24 Poultry, aromatic oil, livestock, peanut butter.
Table 9 : Source and response rate of SMEs Region
MFIs
agencies
agencies
con tacted % Survey responde nts Amhara
0
0 0 7 3 10 30,0% Addis (incl. surrounding)
0 0 0 10 5 4 0 35 54 50,0% Oromia 2 0 2 6 3 8 0 90 7 118 14,4% Sidama/ SNNPR/ Gambela
7 2 0 2 3 0 12 7 33 39,4% Total contacted
4 6 15 16 4 109 52 215 % Survey respondents
73,3% 12,5% 50,0% 0,9% 65,4% 28,4%
of
61
around a quarter were
by women. Table
SMEs
as well as
question;
Value Chain
Number of fulltime staff
Number of family members employed
Number of part time employees
Number of seasonal employees
Cereals (incl. flour) 722 5 199 107 Dairy 182 0 51 0
Vegetable/ fruit/ spices 209 1 70 200 Coffee 174 0 260 1,950 Honey 61 1 3 5 Others (poultry, aromatic oil, livestock, peanut butter) 148 1 19 20
Total 1,496 8 602 2,282
Table 15: Number of staff per respondent, per category, and per value chain
Value Chain
Number of fulltime staff Number of family members employed Number of part time employees Number and timing of seasonal employees
Cereals (incl. flour) 38 0 10 6 Dairy 15 0 4 0
Vegetable/ fruit/ spices 19 0 6 18 Coffee 25 0 37 279 Honey 10 0 1 1 Others (poultry, aromatic oil, livestock, peanut butter) 25 0 3 3 Average* over all 61 SMEs 25 0 10 37 *Arithmetic mean
Considering the number of observations per value chain, the highest turnover is seen in the cereals value chain, generating ETB 42million on average. The honey value chain seems to produce the lowest turnover with on average ETB 1million.
Table 16:
(our
value chain
Cereals (incl. flour) 543,050,000 (13) 41,773,077 Dairy 113,721,500 (11) 10,338,318
Vegetable/ fruit/ spices 22,060,000 (7) 3,151,429 Coffee 94,000,000 (7) 13,428,571 Honey 4,770,349 (4) 1,192,587 Others (poultry, aromatic oil, livestock, peanut butter) 124,160,850 (6) 20,693,475 Total 901,762,699 18,786,723 25 Not all 61 SMEs responded to this question
40
Table 14: Number of staff per category and per value chain
Business turnover
respondents) per
VC Total turnover (in ETB) of all respondents (no. in brackets)25 Average: turnover (in ETB) over no. of respondents
We also looked at the spread of the 61 agri SMEs across the different stages of the VCs. Most respondents are active across more than one stage. For example, one SME processes rose flowers into (cosmetic) aromatic oil. It also produces the roses on its own farm, as they are specific for the extraction of oil. However, in the table below, we have allocated each SME to one VC stage only; overlaps are noted in the last column. In this table no SME is counted double. We also opted for the median instead of the mean because it shows the actual turnover (in terms of financial turnover as well as in terms of volume of physical output) of one of the respondents.26 Thus, the table gives a realistic insight into the business sizes of the respondent SMEs.
Table 17: Turnover physical volume and money by VCs and VC stages
VC VC stage No. of SMEs
Median volume
Median turnover (million ETB) Notes
Coffee Processing 7 Coffee beans 100t 10 60
Production 1 Honey/ Beeswax 0 15t 0 08
Apiculture
Cereal
Vegetables and fruits/ spices/ aromatic oils/ peanuts
Livestock (dairy, poultry, cattle fattening)
Overlap with other VC stages: production (1), export (2), trade (3)
Processing 5 n.a. 1 80 Only one disclosed volume: 7t
Production and Trade 8 85t 4 00 Transport and input provider 3 n.a. n.a.
Only input provider disclosed turnover: ETB 1.4million
Processing 8 1000t 24 Overlap with other VC stages: trade (1 not counted double)
Production 7 1 5t 2 00
Overlap with other VC stages: trade (4), export (1) Trade and Processing 6 54t 3.50
Production 12
Milk and yoghurt Eggs Cattle Chicken
560 hl 419,000 37,5 7,000 2 16
Input provider 2 Feeds 2800t 72 50 Trade and Processing 2 Milk and yoghurt Cheese 355 hl 7.5t 6 00
Annex 2: Status of access to finance
Savings and payments
Overlap with other VC stages: trade (3), input provider (1 not double counted)
26 Commonly, the term ‘average’ is used equivalently to the arithmetic mean, calculated by dividing the sum of the values in the set by their number. Statistically, the average as a measure of the central tendency of a given set of numbers can be calculated by different formula. The median is the middle value in a sorted, ascending or descending, list of values. It is one of the actual values, unless there is an even number of values in that case the median is the mean of the two middle values.
41
All but four of the SMEs surveyed have opened accounts with banks in the name of the enterprise. Those four are all sole proprietorships. Meanwhile, 45 SMEs have a current or checking account, 37 have a savings account, and 22 have a loan account (Figure 9).
The SMEs surveyed hold on average 1.7 savings accounts with private banks and 0.9 savings accounts with public banks. Twenty one SMEs do only have accounts either in private or in public banks. Only 1 respondent has a savings account with a (public) MFI.
The single most mentioned bank where most SMEs have had their longest relationship (with a savings or checking account) is CBE. This reflects that CBE has the widest network and that many other banks only joined the market later. On average, the longest SME with bank relationships have existed for 8.1 years, ranging from 49 years to less than 1 year.
Other banks mentioned are Coop, Awash, Dashen, Berhan, Hibret (United), and Enat Bank as well as NIB and OIB. The reasons for changing to or adding other (usually private) banks are overwhelmingly “offered services”. These banks offer less bureaucratic and faster payment services. Relatedly, many SMEs opened accounts with further banks because suppliers, customers or (in some cases) funders had an account there, and checks are hence cleared faster.
60
45
30
15
0
Current or checking account Savings account Loan account Savings account (in private name) Current or checking account (in private name, spouse equal access)
Any other
Note: Blue bars: Accounts in enterprise name. Number of accounts mentioned; more than one per SME possible. Figure 9 : Types of accounts
Meanwhile, 40% of the SMEs confirmed that they access the institution where they have a savings account through the internet or telephone, the other 60% do not use either.27
This stands in contrast to the potential usage of online banking, as 79% of the SMEs indicate that they have a smartphone, and over 80% have phone and internet network.
Table 18: Phone and network availability among SMEs
Smartphone Phone network Internet network 79% 85% 82%
As intuition suggests, the access infrastructure varies with urbanization (Table 19). In and near Addis, 21 out of 22 SMEs who responded are less than 1 km away from a bank branch or banking agent. Indeed, bank branches are now so far spread that some of these respondents even said bank agents are irrelevant.
The SMEs from the other regions were mostly located in semi urban areas, but still around half of them are less than 1 km away from a bank branch or a banking agent. For those who attempted to answer the question, the average distance to bank branches or banking agents varies between 1
27 In case an SME has saving accounts at several FIs and some are accessed through internet or telephone, and some are not, the SME is counted as accessing FI through internet or telephone.
42
km and 8.4km. However, these averages mask awide variance, with a couple of SMEs being around 25 km away from the next financial services access point.
Table 19: Distance to bank branch or banking agent
Region
No. of SMEs responding question
No. (%) of SMEs who are less or equal to 1 km away from bank branch/ banking agent
No. (%) of SMEs who are above 1 km away from bank branch/ banking agent
Average distance to bank branch/ banking agent (if above 1 km)
Addis Ababa 22 21 (95%) 1 (5%) 5 km
Amhara 6 4 (67%) 2 (33%) 2,7 km Gambella 1 1 (100%) 1 km
Oromia 19 9 (47%) 10 (53%) 8.4 km Sidama 4 2 (50%) 2 (50%) 2.5 km SNNPR 7 7 (100%)
Credit
Thirty three SMEs said that they had ever received a loan. Only 23 out of these indicated that they received the loan amount they requested while 9 SMEs shared that the loan amount they applied for was reduced on average by ETB 986,000, i.e., on average more than one third (36%) of the amount applied for. Another 2 said they did not get any financing. One respondent was completely rejected (ETB 10 million Coffee VC), another one was withdrawn (ETB 300,000, Dairy VC) when the MFI officer asked for a bribe of ETB 100,000
From the FI interviews transpired the following overview of agricultural finance activities; however, few of them are geared towards, or even relevant for SMEs: MFI loans are too small and too short tenured to make a productive difference for SMEs the classic lower boundary of the ‘missing middle’ phenomenon. For instance,Addis MFI offers ‘business loans’ of ETB 1 1.5million for up to 6 months. They ask for 5% 10% compulsory saving upfront, which is a drain on liquidity and further reduces the usefulness of the loan product for SMEs. Oromia MFI did experiment with lending for contract farmers in the barley value chain, i.e., farmers supplied beverage processors. The MFI never scaled this into a wider product, though, because of lack of staff capacity.
VisionFund works with the Rotary Club in a project that supports agri SMEs in the dairy value chain. VisionFund MFI is also engaged in a USAID project since 2020 which is horticulture and cattle fattening in the south of Ethiopia. The USAID issued a paper guarantee to refinance from commercial banks and offers TA in the agrifinance space.
Accordingly, the Coop Bank of Oromia funds activities in the dairy, honey, and coffee VCs with ‘underwriting’ of USAID. The bank also entertains a plan to further develop financing of these VCs. To that end, they collaborate with several international development partners as well as Ethiopian government agencies.
Hibret Bank collaborates with Ethiopia Commodity Exchange (ECX) to provide warehouse receipt finance. The bank has developed policies, processes, and procedures, but warehouse operators need to be licensed by the government first. Hibret Bank also offers classic trade financing for coffee and sesame VC exporters, based on promissory notes.
Awash Bank also collaborates with the International Finance Corporation (IFC) on inventory financing, highly sought for by malt processors.
43
The CBE offers a mechanisation loan for farmers operating on 2 to 10 hectares of land. The loan can be used for tractors and combiners and is repayable over 5 years the only CBE product with such a long tenure. The application requirements are given below.
The collateral is the tractor (or combiner), plus 100% for individual farmers and 40% for cooperatives. Borrowers are identified through (local government based) agricultural extension workers. The CBE reported that the Cooperative Bank of Oromia has introduced a comparable loan product, competing with CBE in the same space (i.e., drawing on the agricultural extension workers, or directly on the cooperatives that are their member owners).
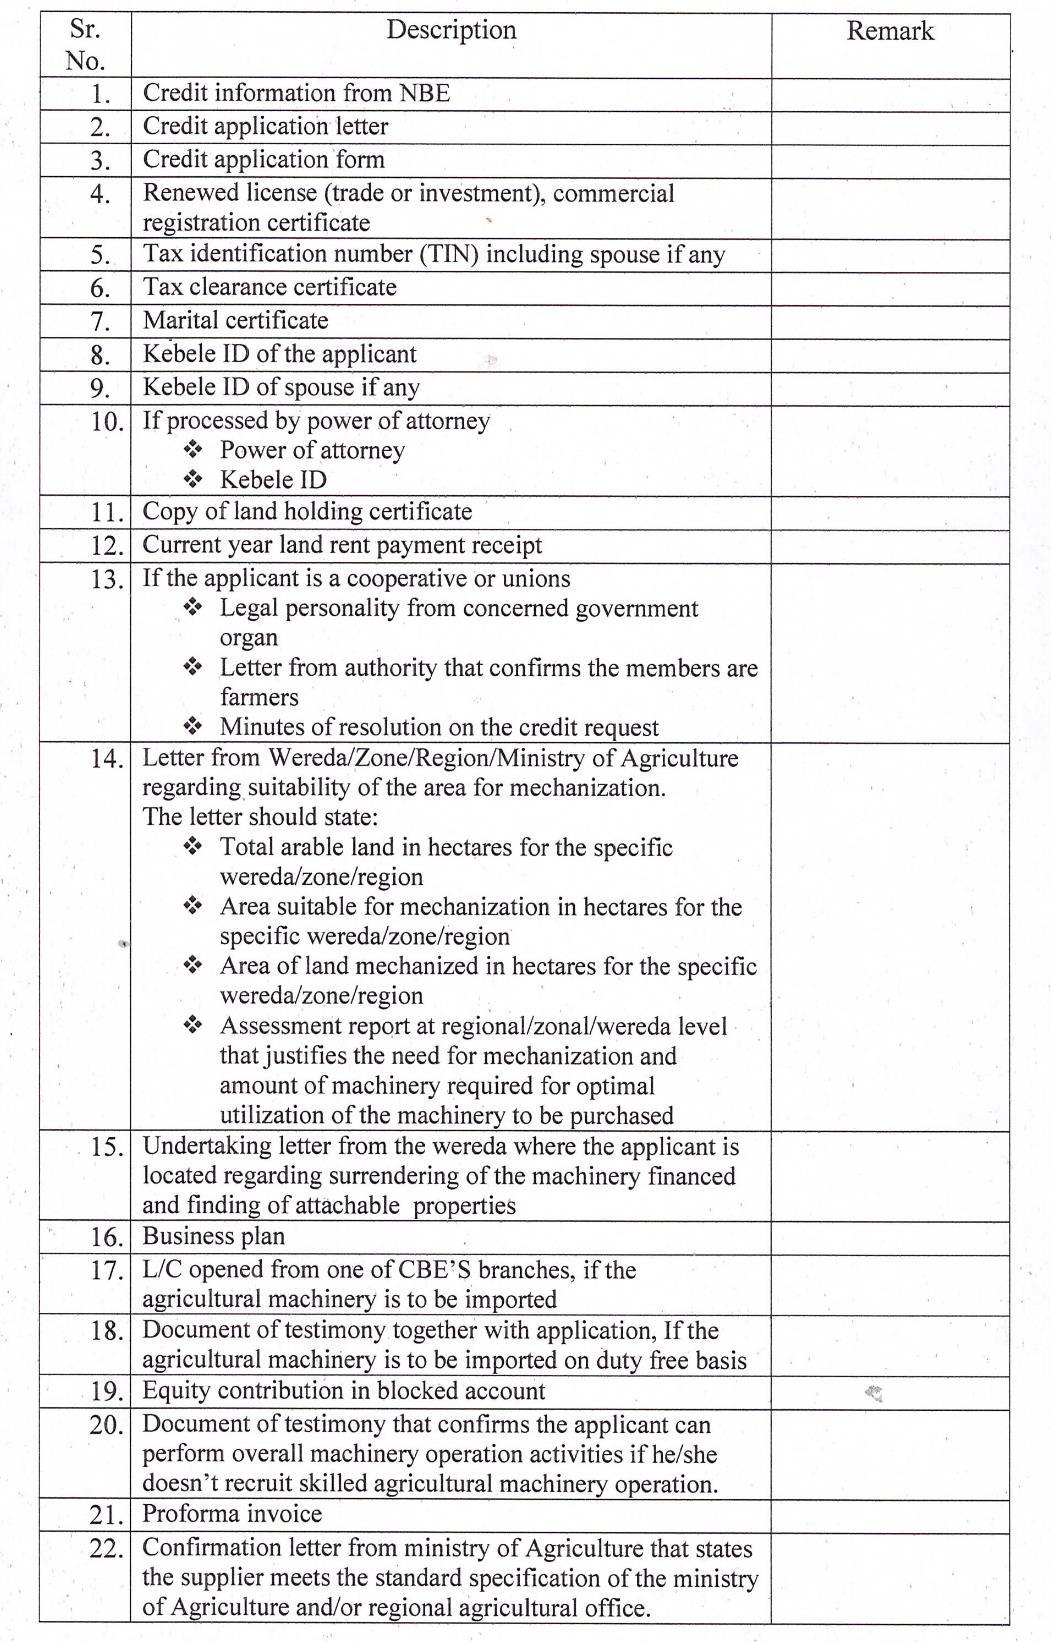
Figure 10: CBE - Checklist for Agricultural Machinery Financing for Smallholder Farmers
44
Leasing
The IFC has recently helped Ethiopia’s government create a favorable regulatory environment for leasing and has helped the Development Bank of Ethiopia and the five regional finance companies based in Addis, Debub, Kaza, Oromia, and Waliya launch leasing operations. The sector is open to foreign investors and thus, in 2019, Ethiopia’s first independent leasing company, Ethio Lease, launched operations.
With this, several of the SMEs interviewed expressed interest and positive expectations in leasing. None of them has accessed a leasing product yet.
The supply side interviews revealed the following:
The DBE offers leasing contracts starting from ETB 2million. Most of their contracts are less than ETB 5million, very few up to ETB 20million. They have about 100 agro processing SMEs among their leasing customers, engaging mainly in flour milling, pasta making, and meat processing. The DBE also has about 200 customers who have leased agricultural mechanisation equipment such as tractors.
Oromia Capital Goods Financing offers leasing contracts of up to 2.5% of their own capital. Most of their leasing contracts are between ETB 1 2million though. Agro processing companies among their customers have leased machinery for breadmaking, grain milling, honey processing, and coffee roasting or crushing. They recently started to lease tractors but have no performance records yet.
Insurance
Twenty seven SMEs who responded to the survey have an insurance cover. More men than women are among the insured, because overall more men than women responded to the survey. The proportion of insured men and women amongst their respective gender varies only moderately. However, 46.7% of men compared to 41.7% of women have taken out insurance for their businesses.
Table 20: Insurance of SMEs, by location
Region Insurance Yes No
Oromia 10 9 Addis 12 10 SNNPR 4 2 Sidama 1 2 Amhara, Gambella 0 5 Total 27 28
45
Most SMEs (55%) have taken vehicle insurance, because it is obligatory (‘3rd party’); 2 SMEs mentioned employee (health) insurance; 28% indicated they had insured their machinery, combiners and/or tractor. One SME mentioned life, livestock, and property insurance respectively.
Meanwhile, 41% said they lacked awareness about insurance; only 11% said they did not need insurance. Asked which type of insurance would be useful, several SMEs indicate livestock, crop insurance, as well as protection of assets against fire, flooding, and/or theft. As such insurances do exist, lack of awareness reveals to be the real issue.
Figure 11 : Example of livestock insurance policy
The insurance companies interviewed informed that both crop and livestock insurance are available in Ethiopia. Fire and other asset insurance are also available for SMEs but not commonly availed. The Oromia Insurance Company (OIC) pilot tests a hospital cash insurance with support from the World Bank.
The type of crop insurance depends on the agro ecology parameters of the farms. Insurance companies have also been working with various development agencies, e.g., UNDP to expand outreach of insurance and to introduce new products, e.g., livestock index insurance.
Understandably, the focus of agricultural insurance products, and according to development partner efforts, have been on smallholder farmers. With growing concerns about climate risks, some of these products will become very relevant to processors as well.
In the stakeholder workshop, the representative of Nyala insurance noted that only two (out of 18 licensed) insurance companies in Ethiopia offer agricultural insurance, and that ‘agricultural insurance is a loss-maker’. This may explain the involvement of donor agencies in the abovementioned agricultural insurance products. However, the same involvement is likely to cover the losses, at least for the time being. Besides, in the interview OIC emphasised that they achieved sustainable delivery, pointing to the example of livestock index insurance.
VisionFund MFI’s board has recently approved the collaboration between an insurance team from Awash Insurance and specialists from VisionFund International to introduce various kinds of insurance products.
Table 21: Agricultural insurances available in Ethiopia
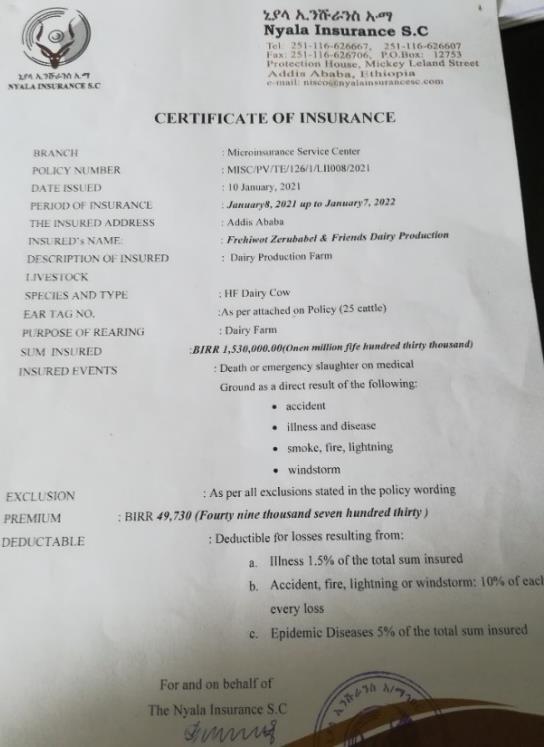
What is insured Insurance type Insured event / pay-out
Multi peril
Crop
Area yield index
Flood, fire, lightening, excessive/ untimely rainfall, rust
If yield falls below a given threshold
Limitations
Locusts sometimes excluded
Target group Cost (of insured yield)
Farmer groups, cooperatives, commercial farms
Farmer groups, cooperatives, commercial farms
n.a.
n.a.
46
Livestock
Vegetation index
Index based
If vegetation dries up beyond a threshold % on satellite photos, pay out automatic
If vegetation dries up beyond a threshold % on satellite photos, pay out automatic
Multi peril
Indicated livestock, e.g., cows
Oromia
Oromia (3 zones; Borana, West Guji, East Hararge) Somali SNNPR (1 district) from Dec. 2021
Age of livestock (e.g., cows: 2 8 years)
Farmer groups, cooperatives
Pastoralists
15% (30 50% subsidised by government and NGOs)
8 11.5% (Somali heavily subsidised [UNDP], Borana almost no subsidy)
Livestock farmers 2 4.5% of cow value p. a.
47
Annex 3: Other Findings on demand side barriers
Linking accounting practices and access to credit
At first sight, the link between accounting practices and access to credit looks rather weak, with 28 SMEs said they operate one (or more) loan accounts. Out of these: 42.9% (12 SMEs) do not deploy a professional accountant; 46.2% (13 SMEs) do not always or never separate private and business accounts; and 32.1% (9 SMEs) do not prepare financial statements.28
Many but not all of these are the same respondents, i.e., they have more than one poor accounting practice. Without double counting any of the SMEs who indicated (one or more) poor accounting practices, proportion of respondents with loans is 60.7% (17 SMEs).
This shows that record keeping / accounting and financial management practices are not the only or the decisive reason why FIs approve or disapprove a loan application. However, this does not prove the initially stated stylised fact wrong. First, as this is not a representative sample of all Ethiopian agri SMEs who ever applied for a loan; so, it is well possible that in that population, poor records are a significant reason for rejecting loan applications that would otherwise be granted.
Certainly, in our sample no SME said that the bank complained about their records or financial reports, and therefore their loan application was rejected or reduced. Neither did any of the SMEs give this reason for not applying for a loan.
Dissatisfaction about ‘lengthy procedures’ was among the critiques of SMEs with loans from formal FIs. Also, SMEs without loans gave lengthy procedures as an important reason for not applying for a formal FI loan. These might be placeholders for complaints about financial records or reports. We know that banks do not proceed until they have the documents and reports they need. If the SME has difficulty producing them, then the procedure would be experienced as lengthy, yet the cause of delay is the poor record keeping / financial reporting practice.
This discussion might lead to a recommendation that FIs might actually link their terms of providing loans to the quality of record keeping and financial management. That means they would transparently differentiate between those SMEs with advanced record keeping vs those who lack such organized records. FIs could provide the former with ease of collateral requirements, or better prices. Currently no such practice exists.
Other reasons for inadequate management practices
28 This draws from their description of the record keeping practice, see footnote 6.
48
State of the art
Fairly professional Basic, limited
>5years in business <3years in business
Note: Details on the bar labels are given in footnote 5.
Figure 12 : Accounting practices
Record-keeping practices are related to the time for which an SME has been operating. Figure 12 shows that the proportion of SMEs, which have been operating over 5 years is the highest among those who have a fully professional record keeping and decreases among those with partially professional or very basic record keeping systems. Only two respondents said they do not keep any records, yet they have been operating for over 5 years. However, this sub sample is too small for meaningful inference. In summary, this suggests that the more mature the businesses are, the better they get in their financial management. However, as discussed below, these behaviours are better explained by educational attainment of the entrepreneur than by the period of operation. As it would be expected, the professionalism of the record keeping system relates strongly to the practice of separating accounts. The variable for the fully professional record keeping system correlates positively to the variable for always separating accounts, with a positive correlation coefficient of 44.1%. The variable for a very basic record keeping system correlates negatively to the same variable, with a negative correlation coefficient of 49.4%.
Separation of accounts, however, is hardly related to the period of operating the business. Instead, it is well explained by the educational attainment of the entrepreneur, as well as by the legal form of the enterprise. Almost 9 in 10 (87.5%) of the SMEs who do not separate accounts are sole proprietorships, while less than 4 in 10 (37.1%) SMEs who do separate accounts are. Entrepreneurs who always separate business and private accounts have on average 14.1 years of schooling and those who sometimes do so have on average 13.5 years of schooling, while those who do not operate separate accounts have on average 10.8 years of schooling.
Those who separate accounts have on average 35 employees. That is substantially higher than those who separate accounts only sometimes: they have on average 11 employees. Those who have no separate accounts have on average 10 full time employees.
In our sample, the separation of accounts is not related to the gender of theentrepreneur. The reason might be that female respondents have a small share, as stated earlier.
Annex 4: SMEs without loans
49
0% 25% 50% 75% 100%
A bit less than half of the interviewed SMEs did not manage to access a loan (46%), either because their application was rejected or because they did not apply in the first place. Interestingly, a sizeable number (10 SMEs) said they did not need a loan, at least at the moment.
Among all these, the reasons reflect those of the active borrowers (Figure 13). Most complaints fall into the realm of ‘supply side barriers’, i.e., they are largely in control of the financial institutions:
Barrier number 1 is collateral. SMEs do not have the required type, or their collateral was valued low (perceived too low).
Barrier number 2 are tedious procedures by the FIs or financial product features, e.g., short loan tenure or not lending to agricultural sector at all, that do not fit the target groups’ needs.
These two are followed by dissatisfaction about the cost of the loans as well as sufficient selffinancing capacity rendering the need for a loan mute. It should be noted though, that loan costs are not necessarily in the (immediate) control of the FIs, because they are affected by broader trends in Ethiopia particularly the cost of refinancing.
Political barriers include licensing requirements, corruption,29 and political instability. Only one SME said it did not have enough information about financial institutions.
We also probed into semi formal sources of finance, particularly of those SMEs that did not access a loan from a formal financial institution. Sources of semi formal/ informal finance mentioned by our respondents are given in Table 22
Table 22: Sources of semi-formal/ informal finance
Source Brief Description
Suppliers or buyers Companies the SMEs trade with, e. g. suppliers of seeds or other inputs; or buyers of their products, e. g. coffee or rose flower oil.
Shareholders Persons who own a share of the SME. They may be formally registered if the legal form is a partnership, PLC or share company, or have a private agreement if the legal form is sole proprietorship.
Friends and Family Persons who are well acquainted with or related to the owner.
iquub A group of voluntarymembers who contribute to a given rhythm (e. g. monthly) and share out the sum by lottery; akin to rotating savings and credit associations (ROSCA).
Average Period Average Amount
ETB 244,000
Additionally, 2 SMEs reported loans of ETB 3million and 1.6million respectively
Ranging from 7 to 90 days
ETB 1million n.a.
ETB 300,000; Additionally, 1 SME reported a loan of ETB 11.35million
Ranging from 45 to 180 days
Sizes, minimum contribution, and continuity (life cycle of the group) may vary widely.
Interestingly, none of the SMEs said that they borrow from money lenders. The literature suggests that moneylenders in Ethiopia are often larger traders, i. e. they could be subsumed under ‘suppliers’ in our survey.
Noteworthy, more than half of those who answered the question (55.6%) accessed finance from suppliers, and two respondents accessed finance from buyers. The remaining third availed finance from friends and family and from shareholders of the enterprise.
The average amount borrowed was ETB 680,000 for an average period of 48 days.
29 We clustered the answer “corruption” from the non borrowing SMEs with ‘political barriers’, i. e. government. However, respondents were not specific, so they may refer to government agencies or to financial institution (as in the example given above).
50
Buyers 11%
Shareholder 11%
Friends and family 22%
Suppliers 56%
Figure 13 : Sources of semi-formal credit
Nineteen SMEs (out of those without FI loans) are saving with at least one iquub.
51
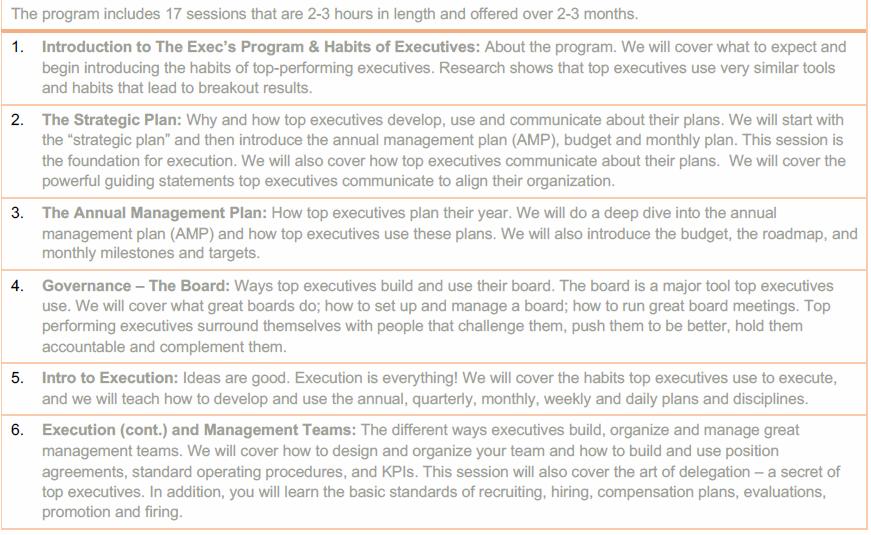
52 Annex
5: Curriculum of RENEW (Investment Funds) SME management training
Deutsche Gesellschaft für Internationale Zusammenarbeit (GIZ) GmbH
Sitz der Gesellschaft Bonn und Eschborn
Friedrich Ebert Allee 32 + 36 Dag Hammarskjöld Weg 1 5 53113 Bonn, Deutschland 65760 Eschborn, Deutschland
T +49 228 44 60 0
T +49 61 96 79 0
F +49 228 44 60 17 66 F +49 61 96 79 11 15
E info@giz.de
I www.giz.de
53


