The Aluminium Industry in the UK Fraser of Allander Institute


The Aluminium Industry in the UK Fraser of Allander Institute
1 Introduction
11 ALFED: UK Aluminium Manifesto 2024
25 Conclusion
Disclaimer
3 Aluminium Production Sector and Wider Aluminium Industry
19 Methodology
8 The Economic Impact of the UK Aluminium Sector
23 Assumptions, Limitations and Next Steps
The analysis in this report has been conducted by the Fraser of Allander Institute (FAI) at the University of Strathclyde. The FAI is a leading academic research centre focused on the Scottish economy.
The report was produced in 2024 in partnership with the Aluminium Federation (ALFED).
The analysis was undertaken independently by the FAI. The FAI is committed to informing and encouraging public debate through the provision of the highest quality analytical advice and analysis. We are therefore happy to respond to requests for technical advice and analysis. Any technical errors or omissions are those of the FAI.
The UK aluminium industry plays a pivotal role in the nation's manufacturing sector and broader economy. As the UK shifts towards a more sustainable and circular economy, the strategic value of aluminium is expected to grow, owing to its diverse applications and recyclability.
In this third instalment of our UK aluminium industry report, we offer an updated analysis of the sector's economic contribution, building on our previous reports from 2021 and 2022.
In this report, we continue to use our definition of the wider aluminium industry and to include separate estimates of the aluminium production sector (SIC24.42).
This report finds that:
■ The wider aluminium industry supports the employment of 108,000 FTE jobs across the UK and the contribution of £9.4 billion in GVA to the UK economy.
■ The aluminium production sector supports the employment of 16,500 FTE jobs across the UK and the contribution of £1.9 billion in GVA to the UK economy.
This report features a novel section which combines publicly available data and findings from our own ALFED members survey to provide the economic context to ALFED’s UK Aluminium Manifesto 2024.
Our analysis finds that:
■ The wider aluminium industry, including the aluminium production sector, supports employment beyond high GVA areas, helping to distribute economic activity more evenly across the UK. This is crucial for enhancing productivity and competitiveness across all UK regions.
■ The aluminium production sector has seen an 88% reduction in GHG emissions since 2005 and an 8% reduction since 2015.
■ Members highlighted the delivery of long-term economic growth and stability as a critical priority for the new government.
■ On a firm-by-firm basis, members emphasised the importance of teamwork, collaboration, problem-solving, and critical thinking as key skills for applicants. Interestingly, when asked about the skills needed for the industry in the future, technical skills were anticipated to be the most in demand.
Although this survey provides only a snapshot of member sentiment, it serves as a strong foundation for assessing the direction of the economy and industry in the coming years.
Supports £1.9bn in GVA and 16,500 FTE jobs across the UK economy
For every 1 job supported in the Aluminium Production sector, 3.1 jobs are supported elsewhere in the economy
Supports £9.4bn in GVA and 108,000 FTE jobs across the UK economy
For every 1 job supported in the Wider Aluminium Industry, 1.6 jobs are supported elsewhere in the economy
90% of ALFED members surveyed report that delivering long-term economic growth and stability should be the core priority of the new government
Aluminium Production employment in the UK is highest in the West Midlands, supporting productive jobs outside London and delivering economic growth outside the UK's common GVA hotspots
Business count in Aluminium Production was up 13% between 2016 and 2023, notably resilient through global disruptions in 2020-2021
The aluminium industry is vital component of the modern UK economy. Characterised by its lightweight properties, versatility and highly recyclable nature, aluminium is poised to play a pivotal role in the UK’s journey towards a more sustainable future.
This report offers an economic analysis of the wider aluminium sector, which we define as encompassing both aluminium production (SIC 24.42) and a spectrum of aluminium products classified under various industries but directly linked to aluminium.
However, products with aluminium components and several aluminium products could not be included in the wider aluminium industry definition due to insufficient data. These products are classified as part of the extended aluminium industry shown in Table 1.
Table 1: Products included in aluminium industry definition
Industry Constituent SIC
Aluminium production sector
Aluminium production
SIC 24.42
Wider aluminium industry
Extended aluminium industry
Aluminium production
SIC 24.42
+
Aluminium products found and quantified in 15.12, 24.43, 25.11, 25.12, 25.29, 25.92, 25.93, 25.99 and 29.32
Aluminium products found under SIC codes where it was not possible to quantify aluminium content
+ Products which are likely to be aluminium and are not specifically labelled as such under SIC codes
Includes products such as
Aluminium alloy bars, rods, profiles and hollow profiles (24422250), Aluminium tubes and pipes (24422630), Unwrought non-alloy aluminium (24421130)
Aluminium prefabricated buildings (25111050), Aluminium structures (25112370), Metal containers for compressed or liquefied gas (25291200), Casks, drums, cans, boxes (25921240), Aluminium aerosol containers, with a capacity 300 litres or less (25921260), Nails, tacks, drawing pins, corrugated nails and staples (25931400), Aluminium sanitary ware (25991137), Road wheels and parts (29323040)
Light metal castings for land vehicles (24531010), Articles of aluminium (25992955), Capsules of aluminium (25921350), Bumpers and parts for motor vehicles (29323010),
Parts and accessories of vehicle bodies (29322090), Brakes, servo-brakes and their parts (29323020), Suspension systems for motor vehicles (29323050), Radiators and their parts for motor vehicles (29323061), Steering wheels, steering columns, steering boxes and their parts for motor vehicles (29323067), Other parts and accessories, not elsewhere classified, for motor (29323090), Frames and forks for bicycles, other non-motorised cycles and side cars.
We use our classification of the wider aluminium industry and the aluminium production sector, defined in Table 1 to provide a snapshot of the industry in terms of its contribution to the economy through gross value added (GVA) and employment.
For this report, we built a bespoke Hypothetical Extraction Model (HEM) calibrated on the latest version of the 2019 UK Input-Output Tables (IOTs) to estimate the importance of the wider aluminium industry and aluminium production sector.
Our model considers the interconnectedness of sectors within the economy, allowing for the analysis of spill-over effects from changes in the spending patterns of specific industries or groups of industries. The 2024 report offers a more comprehensive economic overview by introducing new layers of analysis. It examines both the aluminium production sector SIC24.42 and the wider aluminium industry explored in previous reports and extends our modelling to include genderspecific employment spillover effects - enabling a better understanding of the distinct contributions made by aluminium production and the broader ecosystem of aluminium products and related sectors.
Section 3 aligns with the ALFED UK Aluminium Manifesto 2024, providing an analysis of relevant data and findings related to the manifesto's key pledges. Drawing from an ALFED members survey, relevant data and government policy, we present useful measurable statistics and indicators to gauge progress towards manifesto targets. The section examines five main pledges: delivering an industrial strategy, safeguarding energy security and net zero policies, ensuring political and policy stability, addressing skills and education reform, and infrastructure investment for a net zero economy. By establishing baseline data on issues such as manufacturing's contribution to GDP, greenhouse gas emissions, economic concerns of industry members, demand for skills, and infrastructure investment levels, this section offers a foundation for tracking the aluminium industry's development and the effectiveness of policy initiatives over time.
The Fraser of Allander Institute produced this report in collaboration with the Aluminium Federation (ALFED). ALFED represents producers and other key stakeholders operating within the wider aluminium industry.
The report’s structure is as follows:
■ Section 1 presents an economic overview of the wider aluminium industry and aluminium production sector;
■ Section 2 examines the economic impact of the UK aluminium industry;
■ Section 3 aligns with the ALFED 2024 Manifesto pledges providing useful indicators and related findings;
■ Section 4 details the methodology used in our estimations;
■ Section 5 highlights key assumptions and limitations;
■ Section 6 concludes the report.
GVA is a measure of the economic contribution of a firm or industry to the economy. Economists often consider GVA as the preferred economic indicator for assessing the significance of a particular sector or industry to the economy.
In 2022, the wider aluminium industry contributed approximately £4.3 billion in GVA to the UK economy, of which aluminium production made up £1.5 billion.
Chart 1 illustrates that the wider aluminium industry has not only recovered from the 2020 downturn but has also surpassed pre-pandemic levels with GVA in 2022 at its highest level.
1: UK aluminium industry GVA, 2022 prices
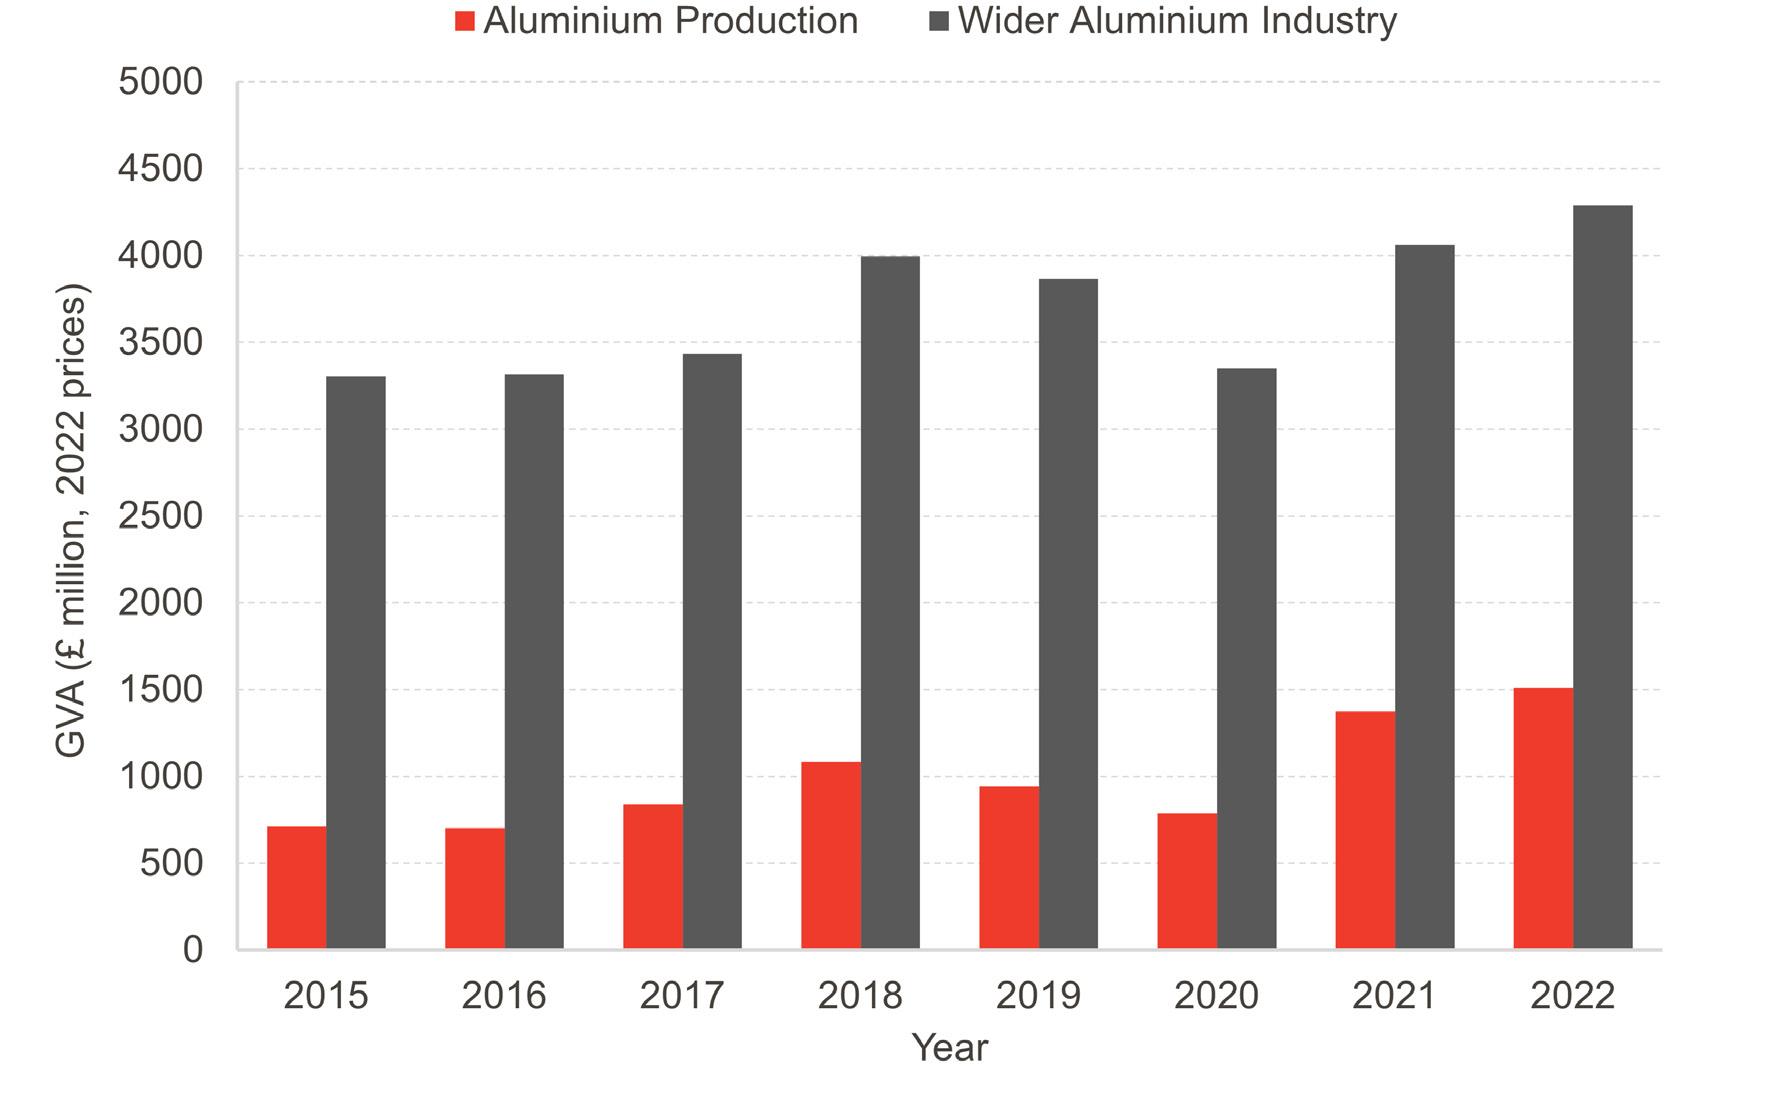
Source: ONS, PRODCOM
Since 2015, aluminium production has significantly increased its share of GVA within the wider aluminium industry, rising from 21.6% in 2015 to 35% in 2022. This growth is particularly notable when compared to a 24.4% share in 2019 and 23.5% in 2020. By 2021, aluminium production had become the largest contributor to the wider aluminium industry's GVA.
Previously, the largest share of GVA came from the sales of aluminium products, particularly those classified under SIC 25.12. This category, which includes aluminium doors, thresholds for doors, windows, and window frames, now accounts for the second-largest share at 32% of the wider aluminium industry's GVA as of 2022.
In 2022, the wider aluminium industry directly employed approximately 41,000 people across the UK. Chart 2 illustrates the employment trends in both the wider aluminium industry and aluminium production sector from 2015 to 2022. Notably, the wider aluminium industry has rebounded to near pre-pandemic employment levels after experiencing a decline in employment in 2020 and 2021.
Chart 2: UK aluminium industry employment (FTE), 2015-2022
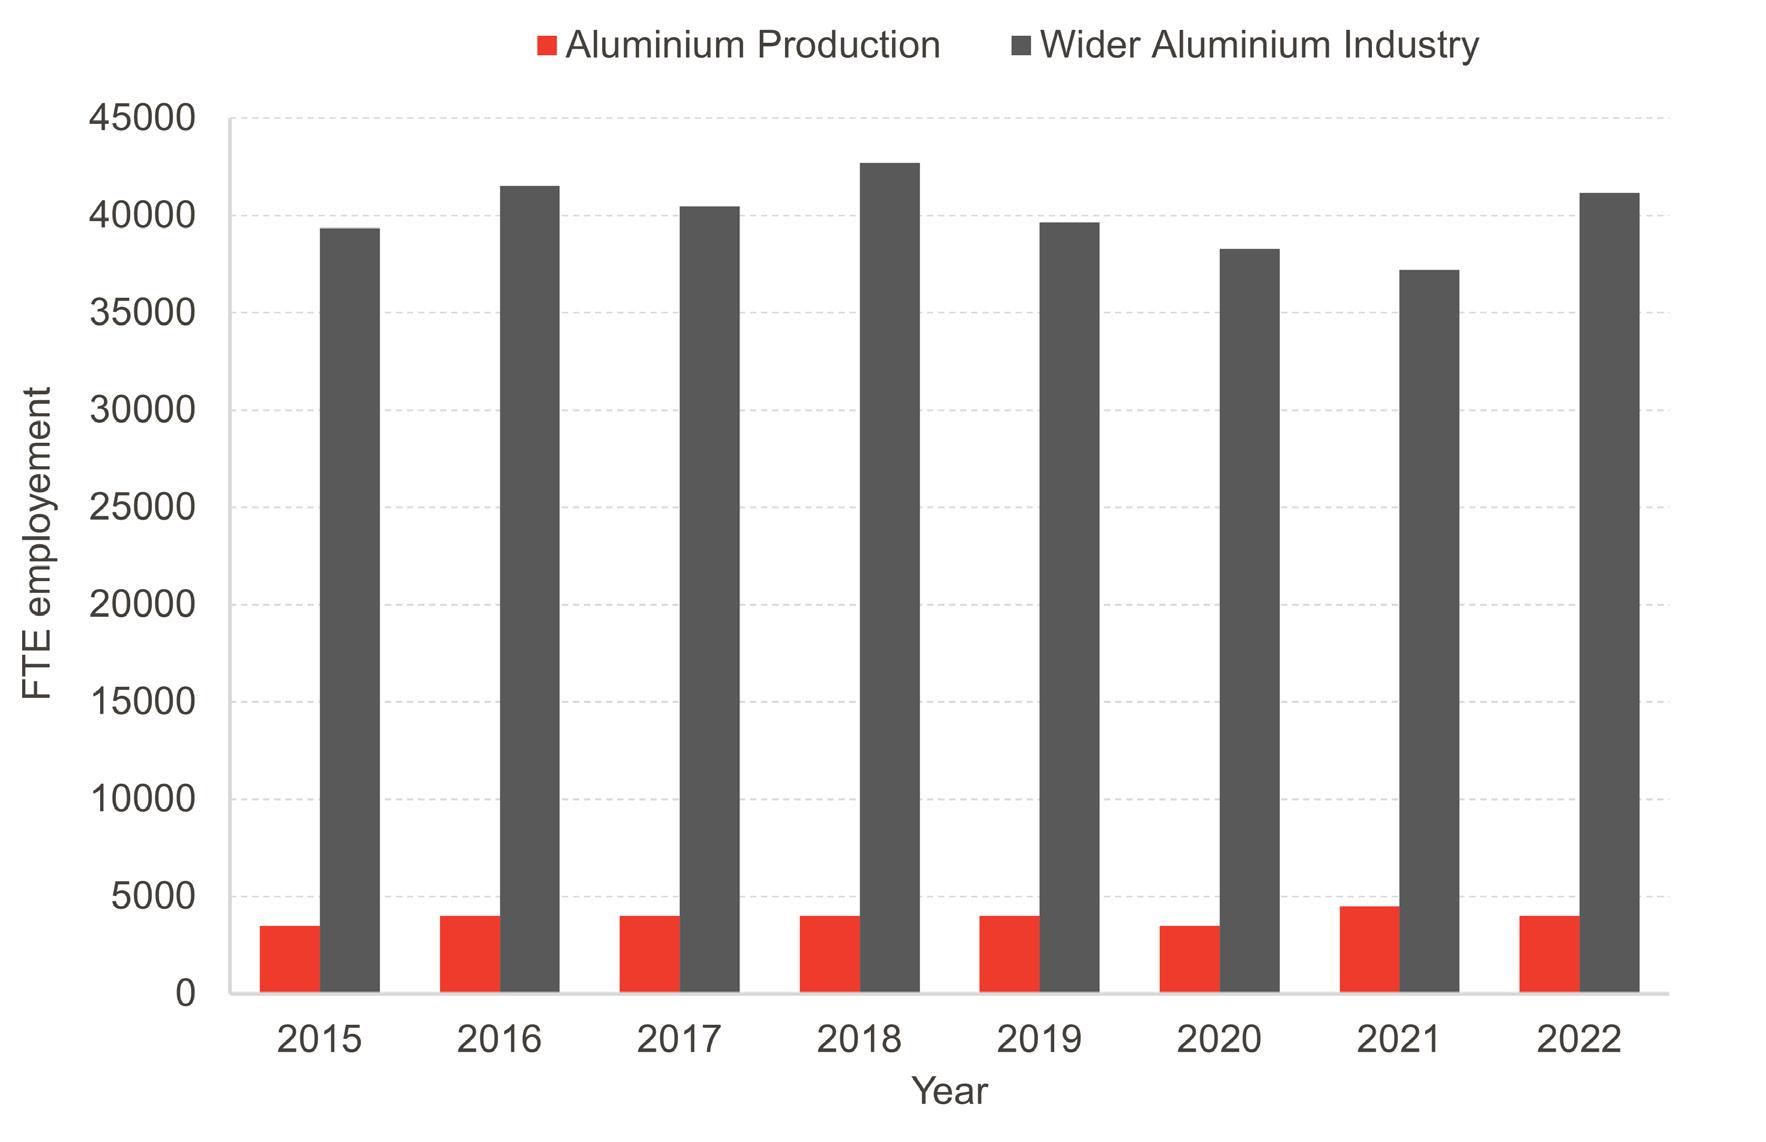
Source: NOMIS/BRES
Within this broader picture, aluminium production (SIC 24.42), represented by the red bars in Chart 2, accounts for about 4,000 of the total employment in the wider industry. This figure shows a slight decrease from the 4,500 employed in 2021, though the actual difference may be less due to rounding.
Chart 3 demonstrates the geographic distribution of the wider aluminium industry across UK ITL2 regions (mirroring the NUTS classification used in previous reports). The West Midlands region emerges as a key hub, accounting for just under 9% of the industry's total employment, highlighted by a red bar to emphasise its significance. Other regions with high concentrations of employment include Shropshire, Staffordshire, and Greater Manchester.
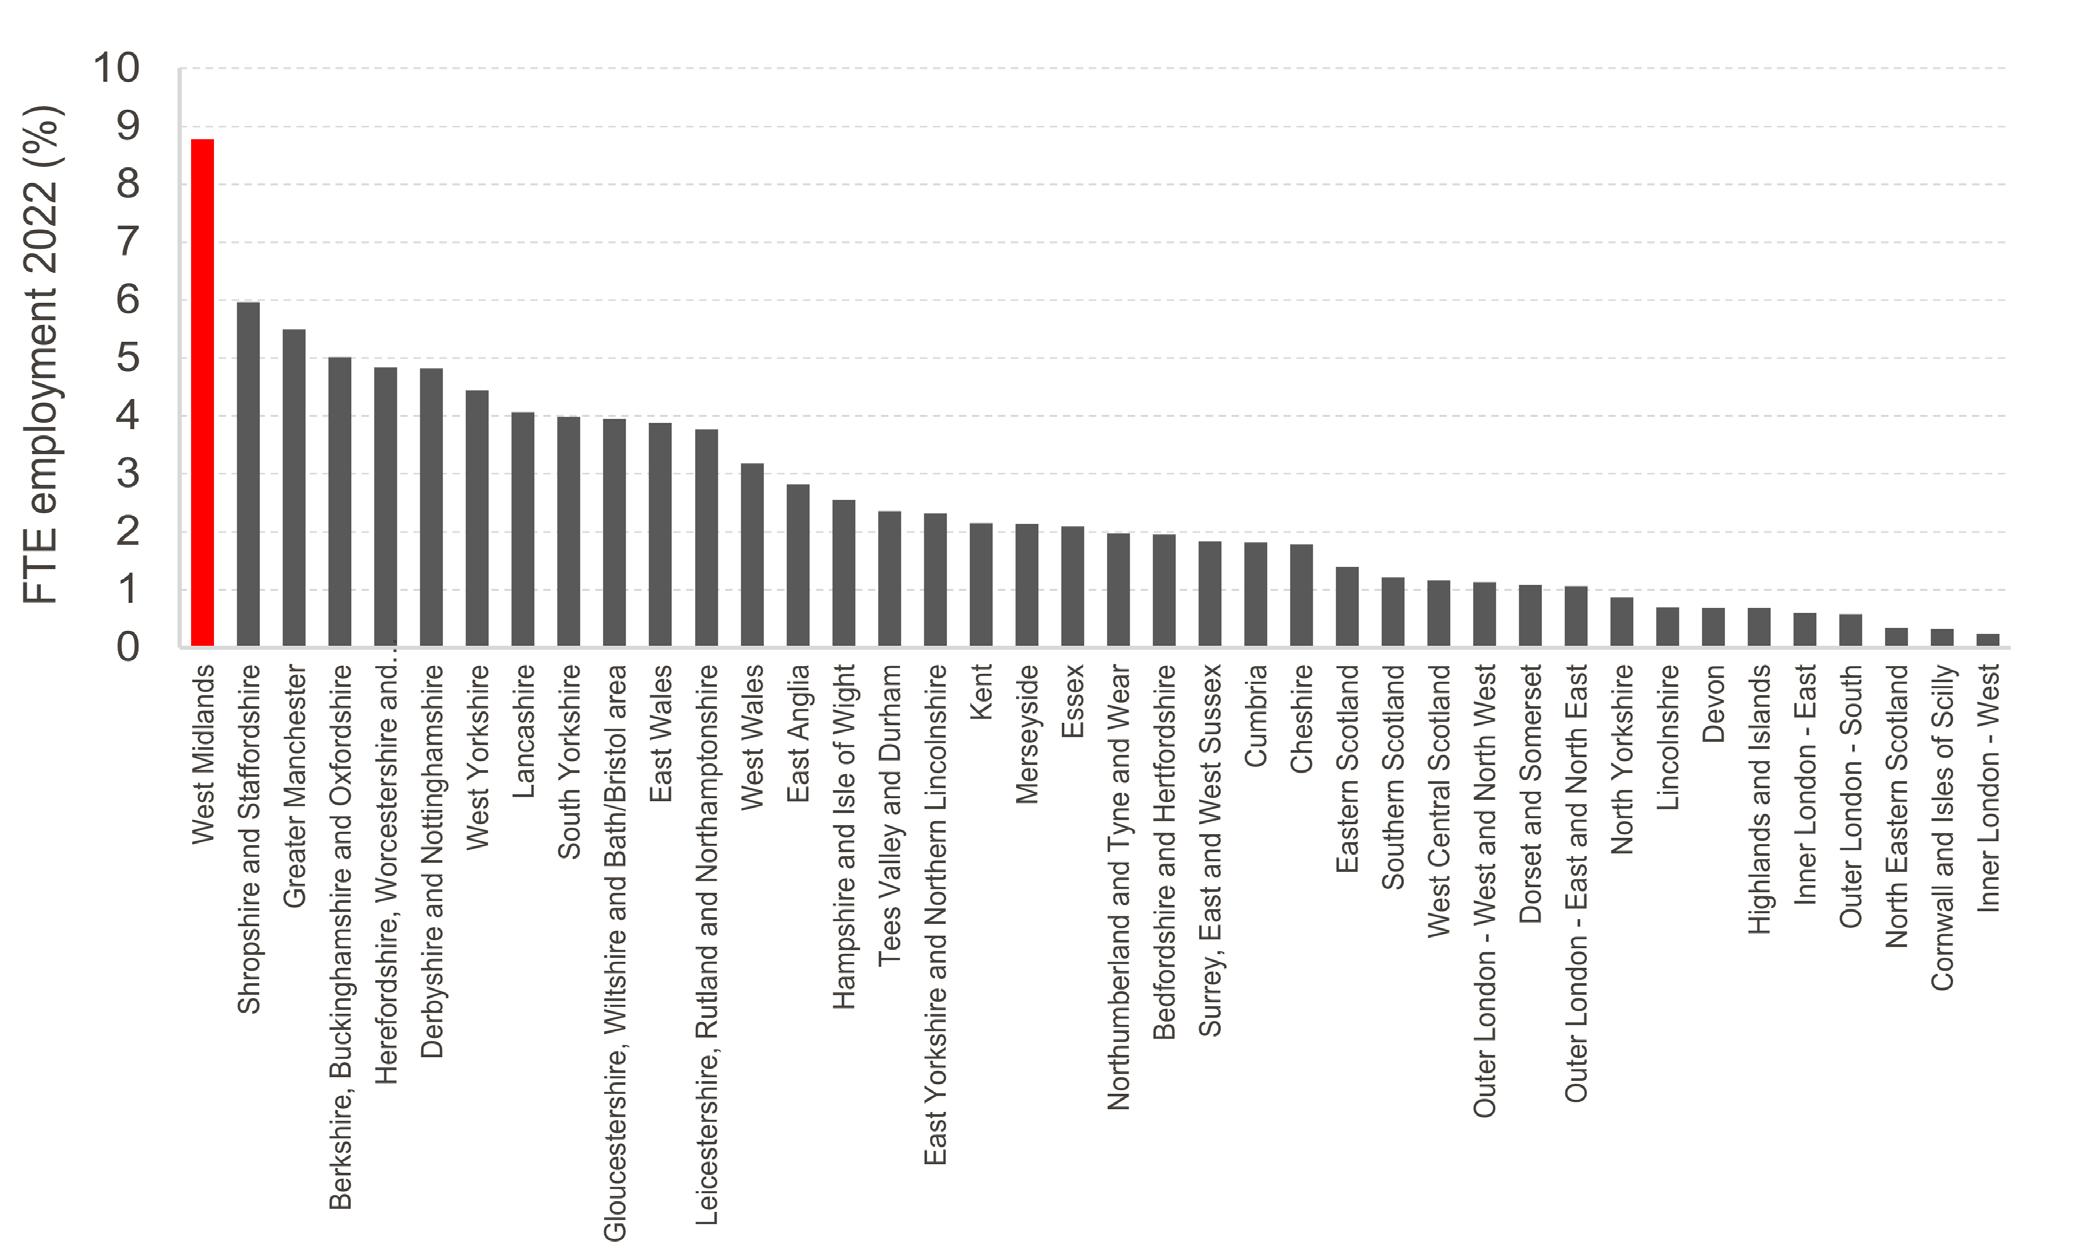
Source: NOMIS/BRES
Chart 4 focuses specifically on the distribution of aluminium production employment across ITL2 regions. As highlighted earlier, the West Midlands leads, employing 19% of those working in the aluminium production sector. This chart further underscores the West Midlands' importance to the sector while also highlighting significant employment concentrations in Shropshire, Staffordshire, Herefordshire, Worcestershire, and Warwickshire.
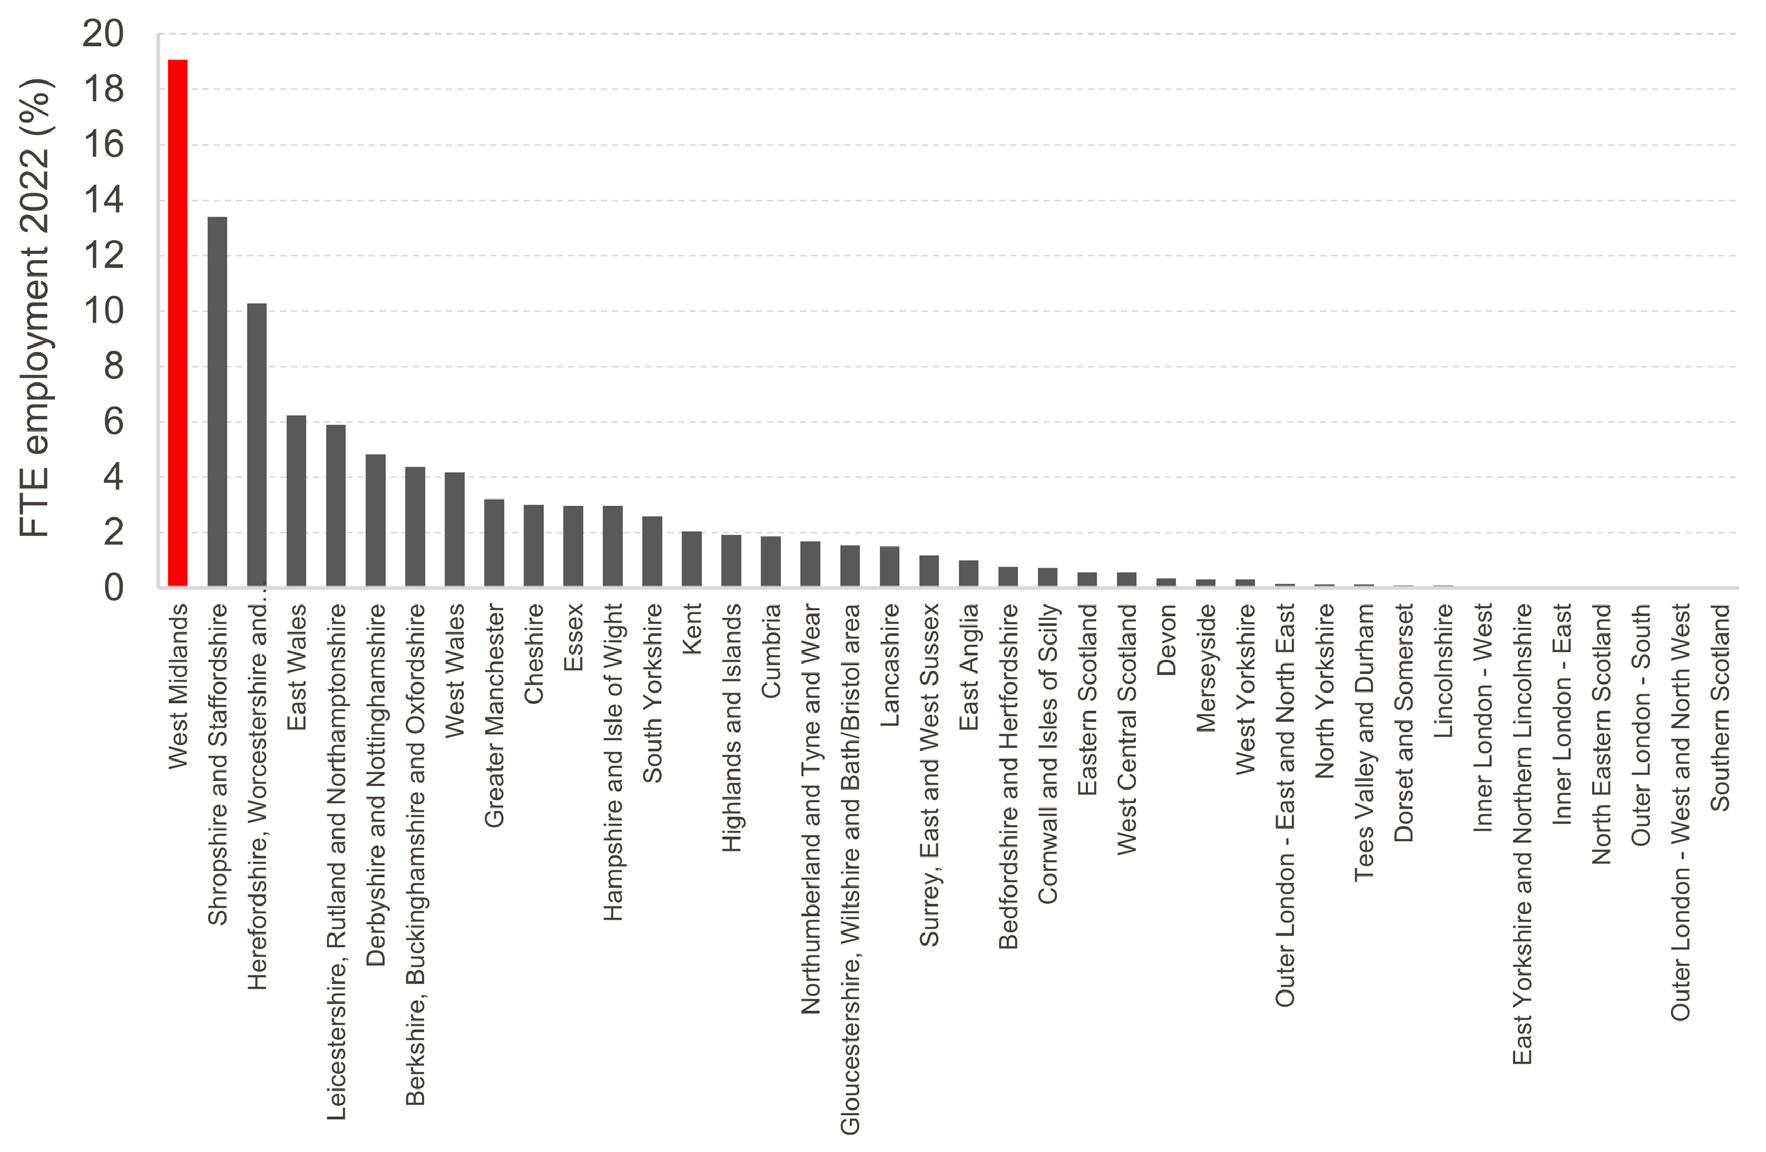
Source: NOMIS/BRES
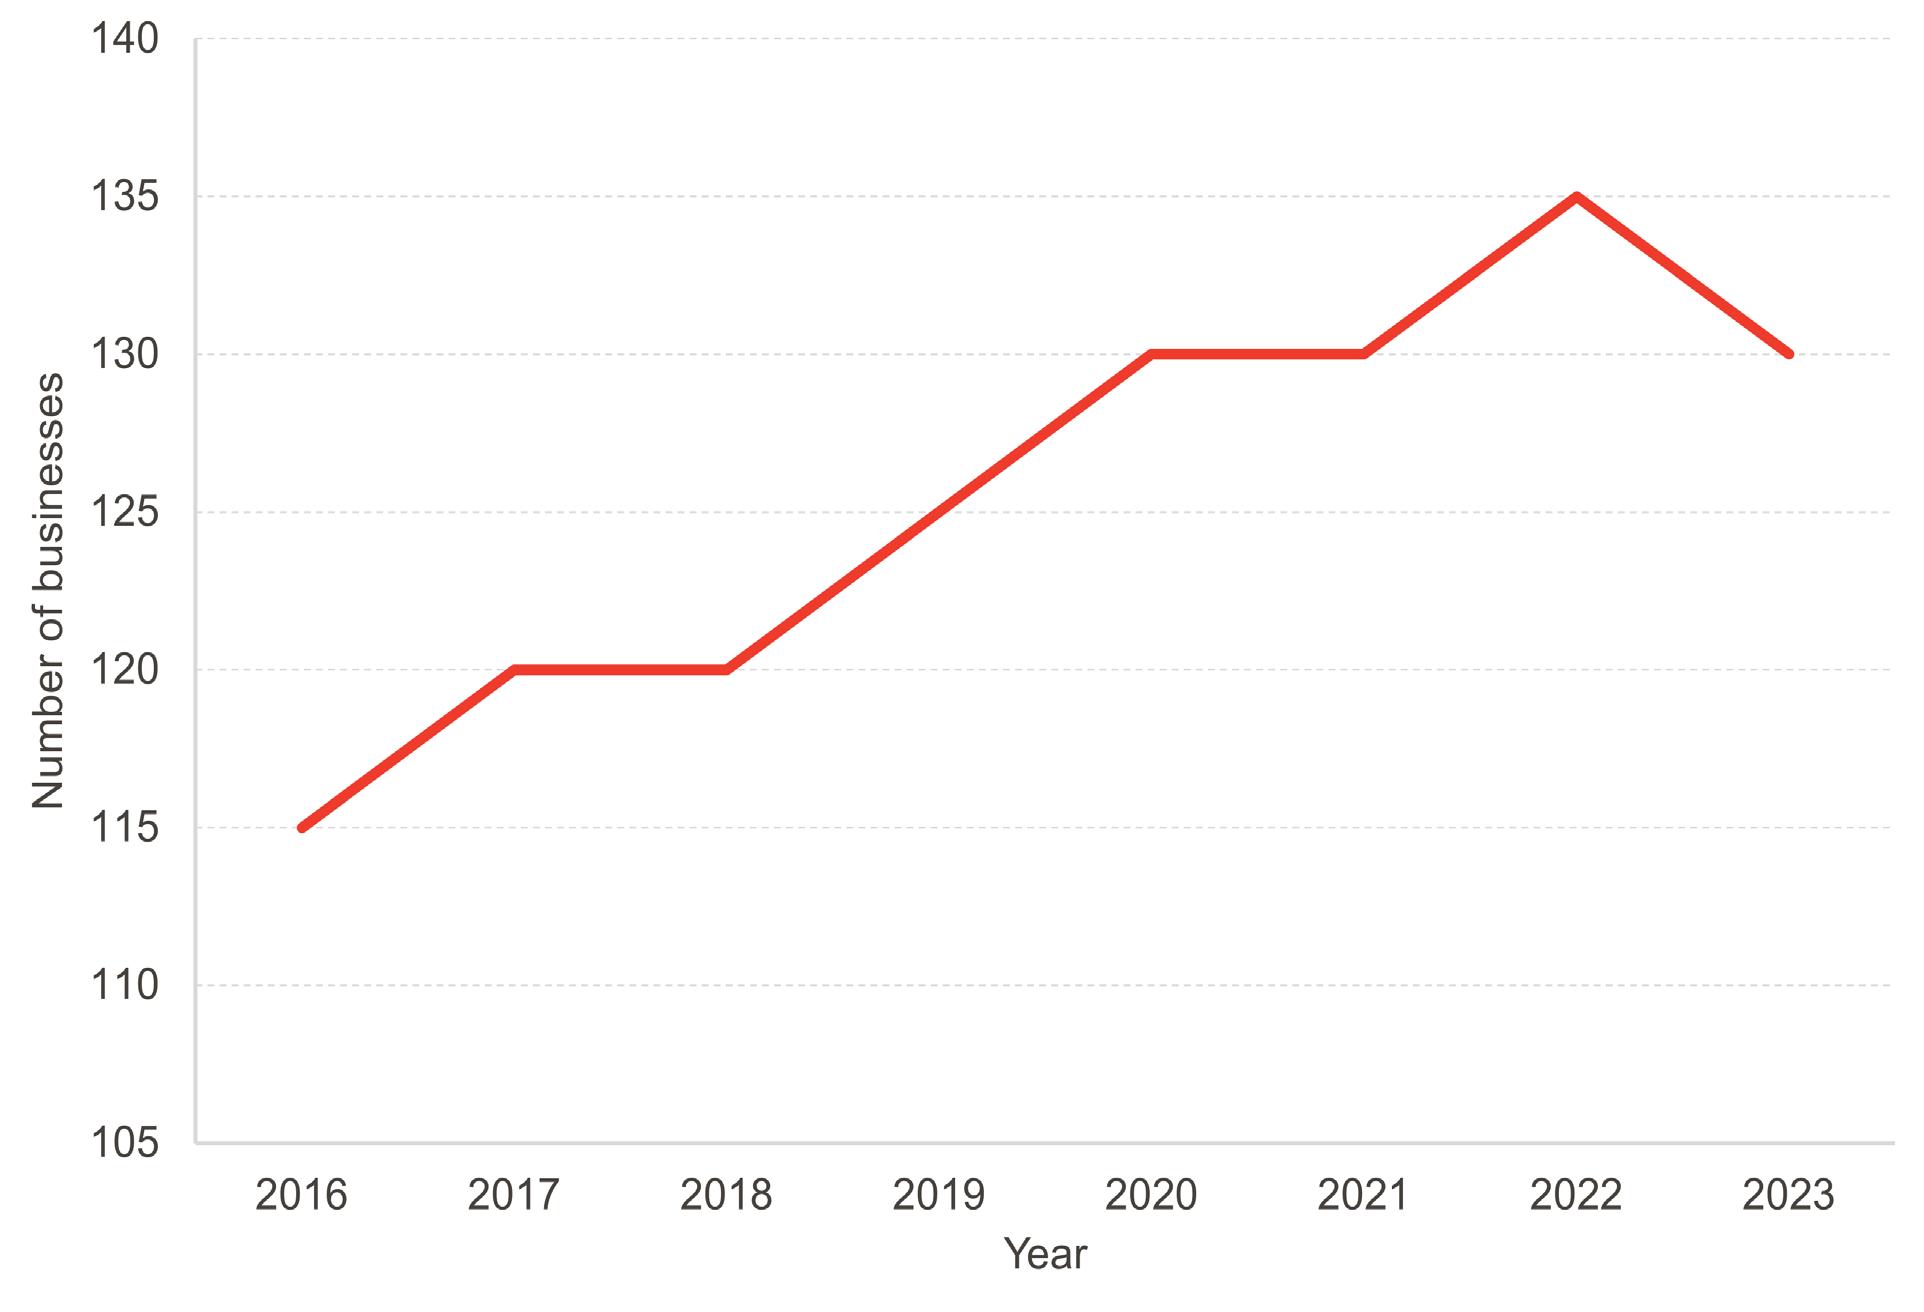
Chart 5 illustrates the trend in the number of businesses operating in the aluminium production sector from 2016 to 2023. Starting with 115 businesses in 2016, the sector experienced steady growth over the subsequent years, reaching 130 businesses by 2020. This growth continued, peaking at 135 businesses in 2022, demonstrating the sector's ability to expand even through the global challenges of 2020-2021. However, a slight decline to 130 businesses was observed in 2023, returning to the levels seen in 2020-2021.
The overall trend shows resilience in the aluminium production sector. Despite this recent small decline, the number of businesses in 2023 remains 13% higher than in 2016, indicating net growth over the eight-year period. Notably, the sector demonstrated stability during the 2020-2021 period, maintaining its number of businesses despite global economic disruptions.
Source: NOMIS/UKBC
To measure the economic impact of both the wider aluminium industry and aluminium production, we apply a Hypothetical Extraction Model (HEM) to the UK economy.
The HEM is an analytical tool that simulates the removal of the industry from the economy. By observing the changes that occur when this happens, we can estimate the impact that the wider aluminium industry has on the UK economy.
In our model, we observe three types of impact when removing the industry from the economy: direct, indirect, and induced.
Diagram 1: Direct, Indirect and induced impacts
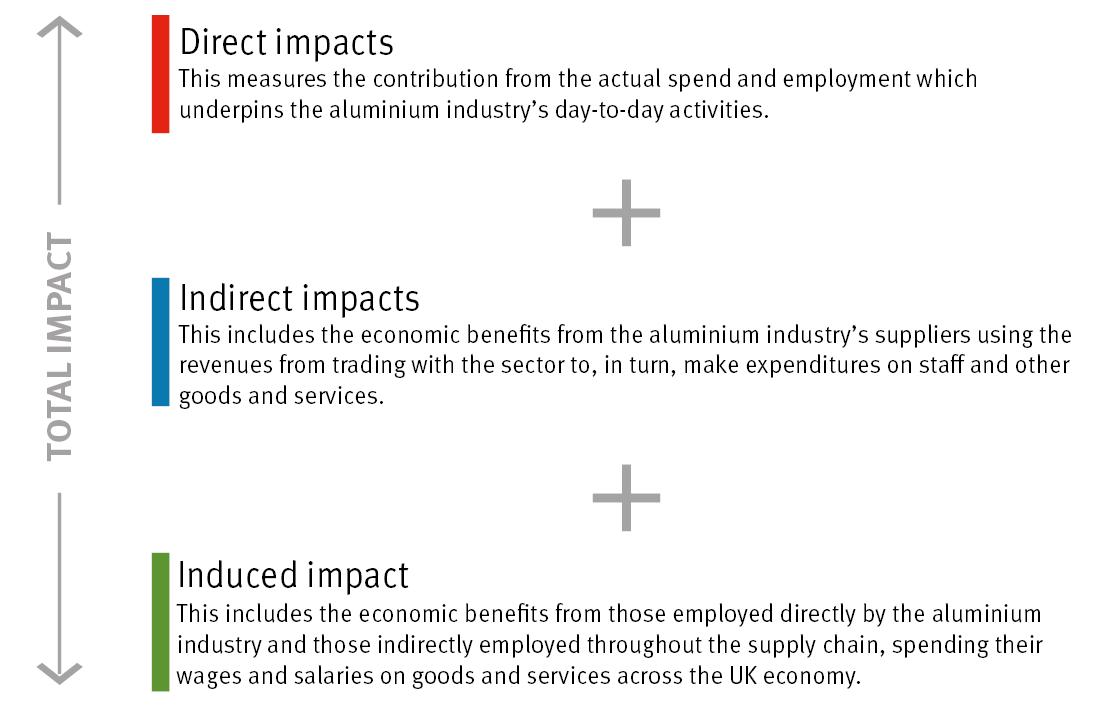
Source: FAI
The results for the wider aluminium industry from the FAI HEM are shown in Table 2. The HEM model produces a slightly lower direct GDP figure for the wider aluminium industry than our calculations in Section 1 using ONS data.
According to the model, the wider aluminium industry directly contributes approximately £3.98 billion to the UK economy. However, this figure does not capture the indirect or induced impacts on the rest of the UK economy. When these spill-over effects are included, the total contribution of the wider aluminium industry to the UK economy amounts to just under £9.4 billion.
When direct, indirect, and induced employment impacts are considered, we estimate that the wider aluminium industry supports around 108,000 FTE jobs.
Table 2: Economic impact of the wider aluminium industry
Source: FAI Calculations
Chart 6 illustrates the direct, indirect, induced, and total economic impact of the wider aluminium industry to the UK economy.
Chart 6: Economic impact of the wider aluminium industry
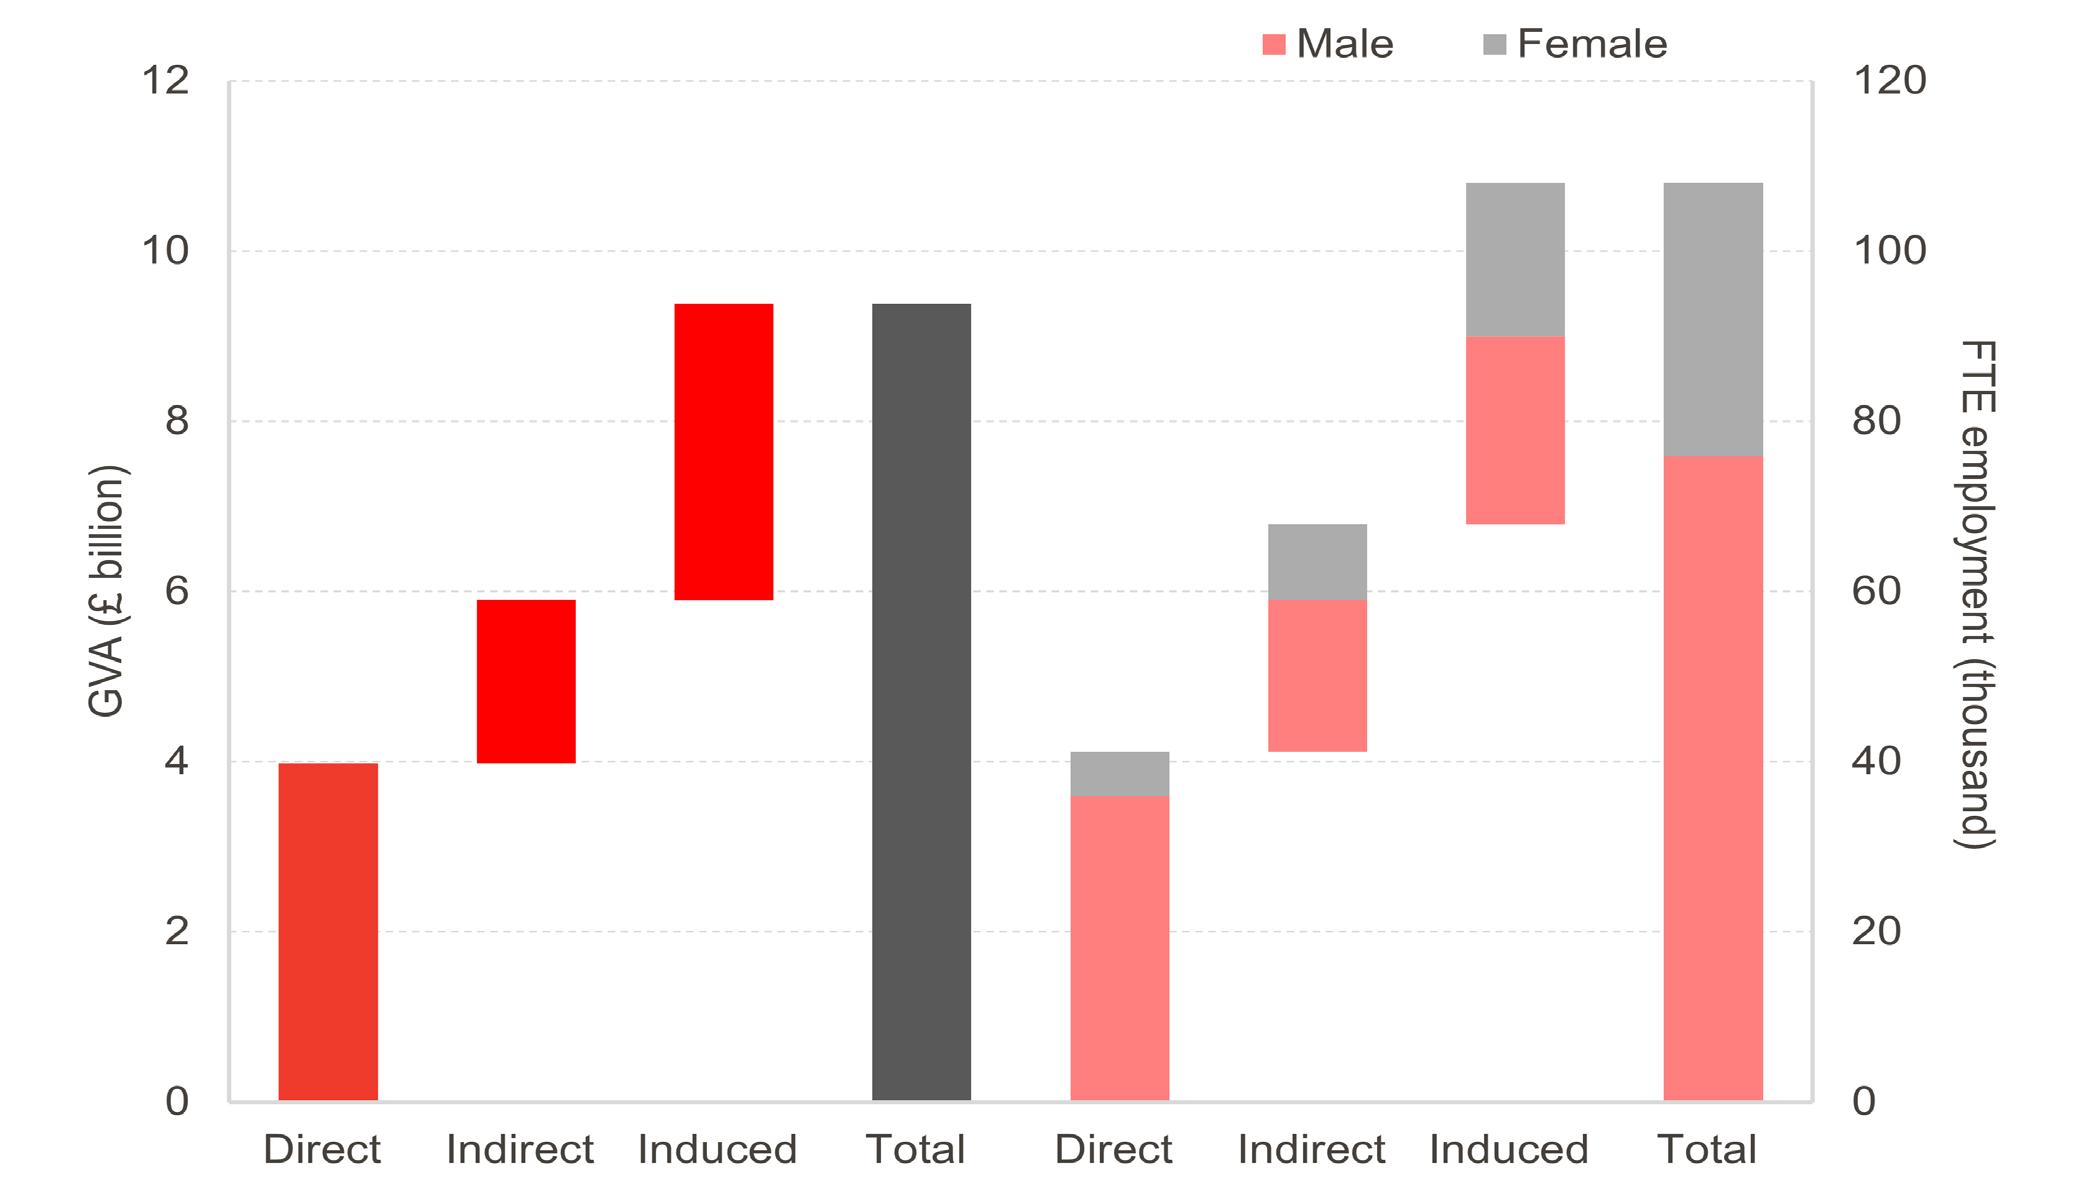
Source: FAI Calculations
The results for the aluminium production sector from the FAI HEM are shown in Table 3. The HEM model produces a much lower figure for the aluminium production sector than our calculations in section 1 using ONS data. This is largely due to ONS data suggesting a substantial increase in the GVA from SIC 24.4-5 in 2021 and 2022 of which aluminium production is a considerable element.
According to the model, the aluminium production sector directly contributes approximately £939 million to the UK economy. However, when spill-over effects are included, the total contribution of the aluminium production sector to the UK economy is over £1.9 billion.
When direct indirect and induced impacts are considered, we estimate that the aluminium production sector supports around 16,500 FTE jobs.
Table 3: Economic impact of the aluminium production sector
Source: FAI Calculations
Chart 7 illustrates the direct, indirect, induced, and total economic impact of the aluminium production sector to the UK economy.
Chart 7: Economic impact of the aluminium production sector
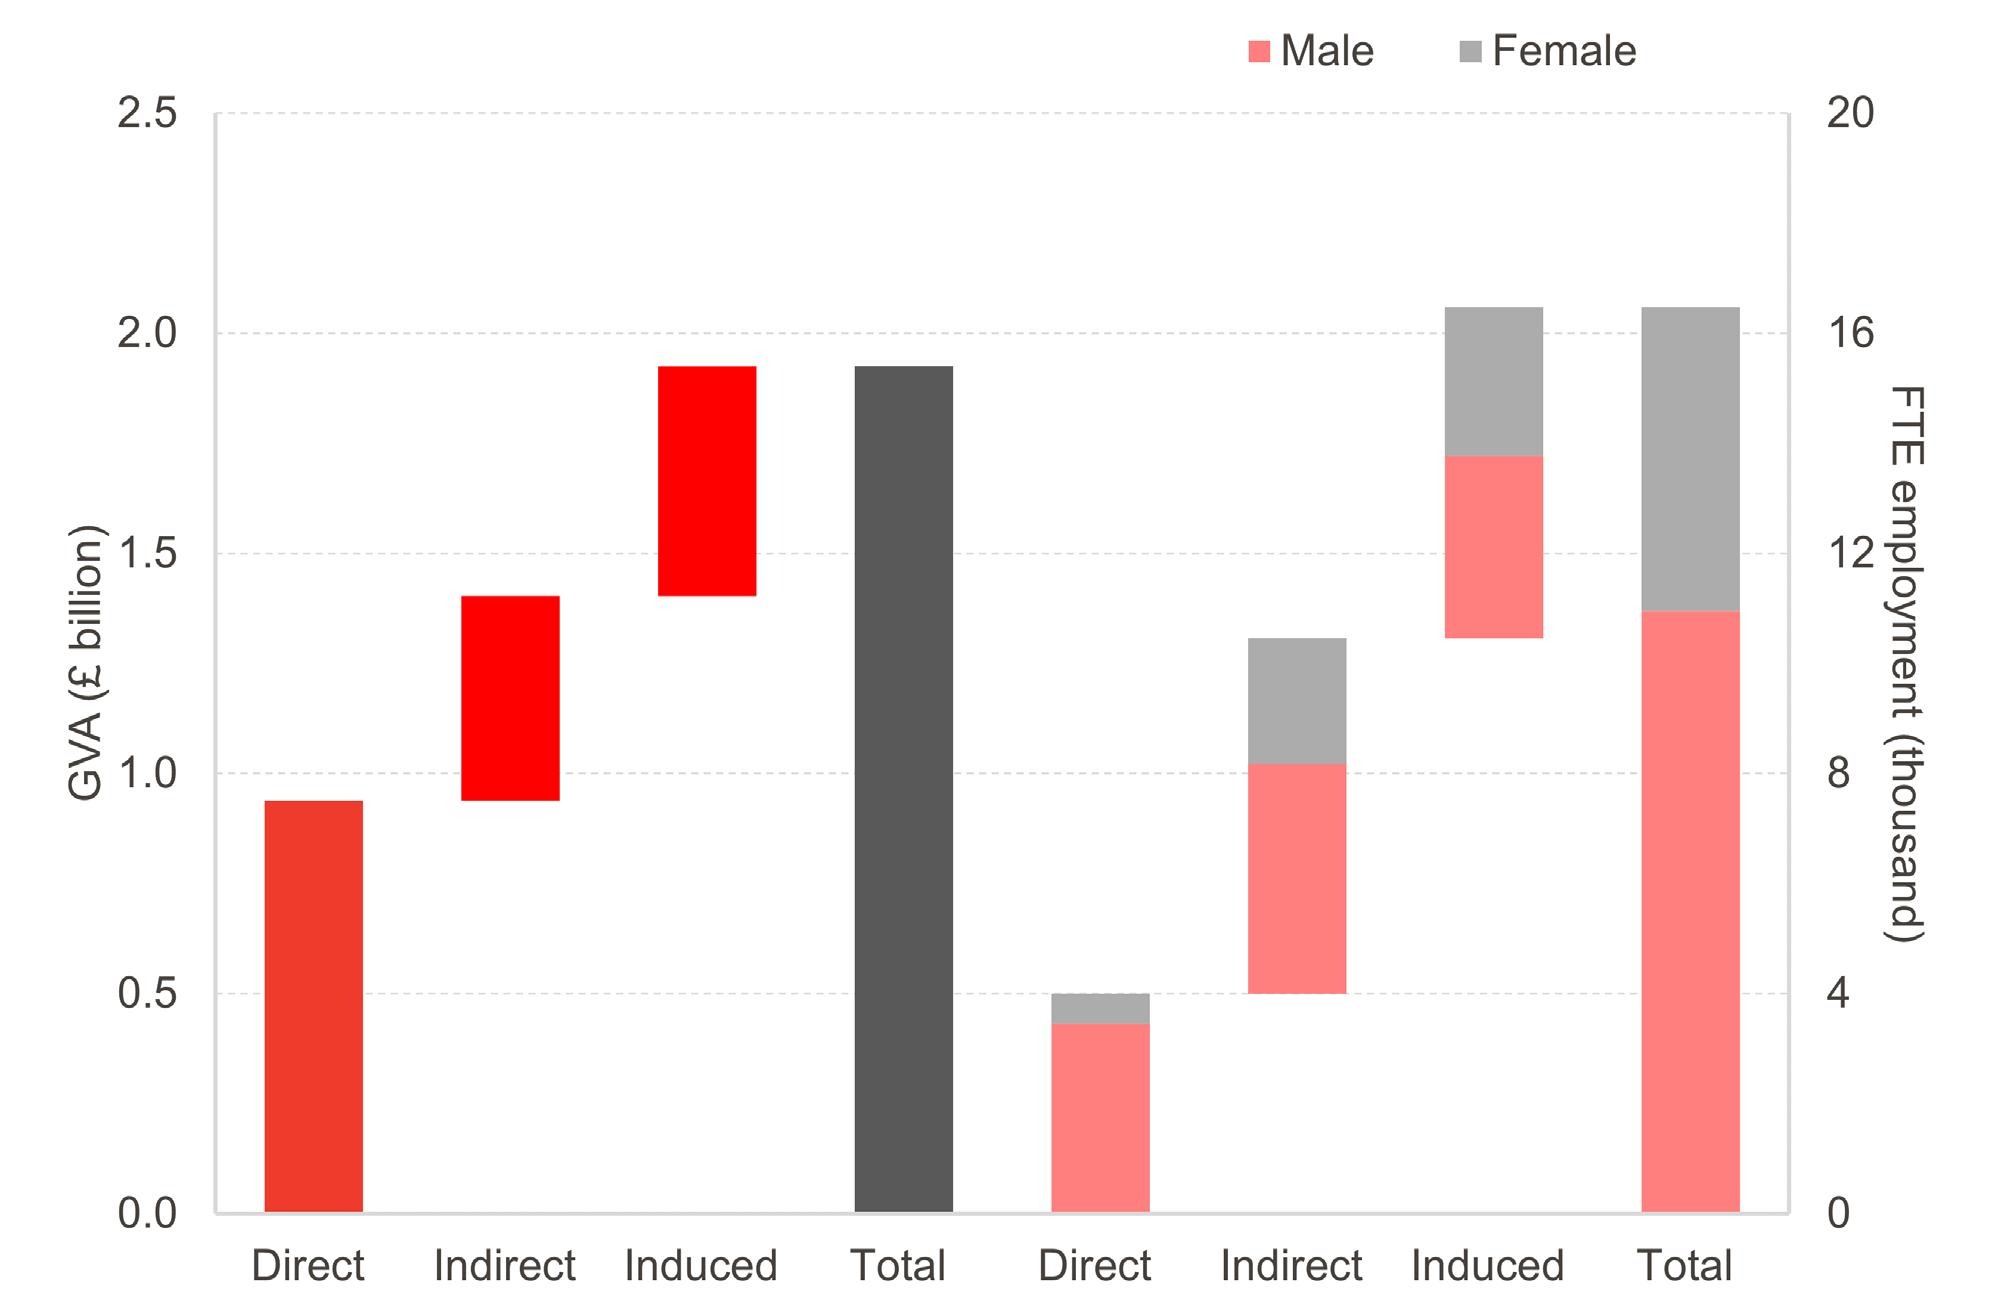
Source: FAI Calculations
Pledge 1: Deliver an industrial strategy creating a level playing
ALFED’s primary objective in their manifesto is to support the development of an industrial strategy that will facilitate progress, particularly in areas such as sustainable aluminium production.
The new government has committed to establishing a new industrial strategy in the 2024 King's Speech that prioritises industrial growth and economic stability. However, at the time of writing, the exact details of this strategy are still unknown. They have stated that they will seek involvement from industry, trade unions, and civil society in their plans for growth, aiming to build a stronger economy across all parts of the country.
ALFED has called for an increase in the contribution of manufacturing to GDP from 10% to 15%. However, according to Chart 8, the contribution of manufacturing to GDP has been on a downward trend, dropping from approximately 10.4% to 9.4% between 2015 and 2023.
Chart 8: Contribution of UK manufacturing to GDP (%)
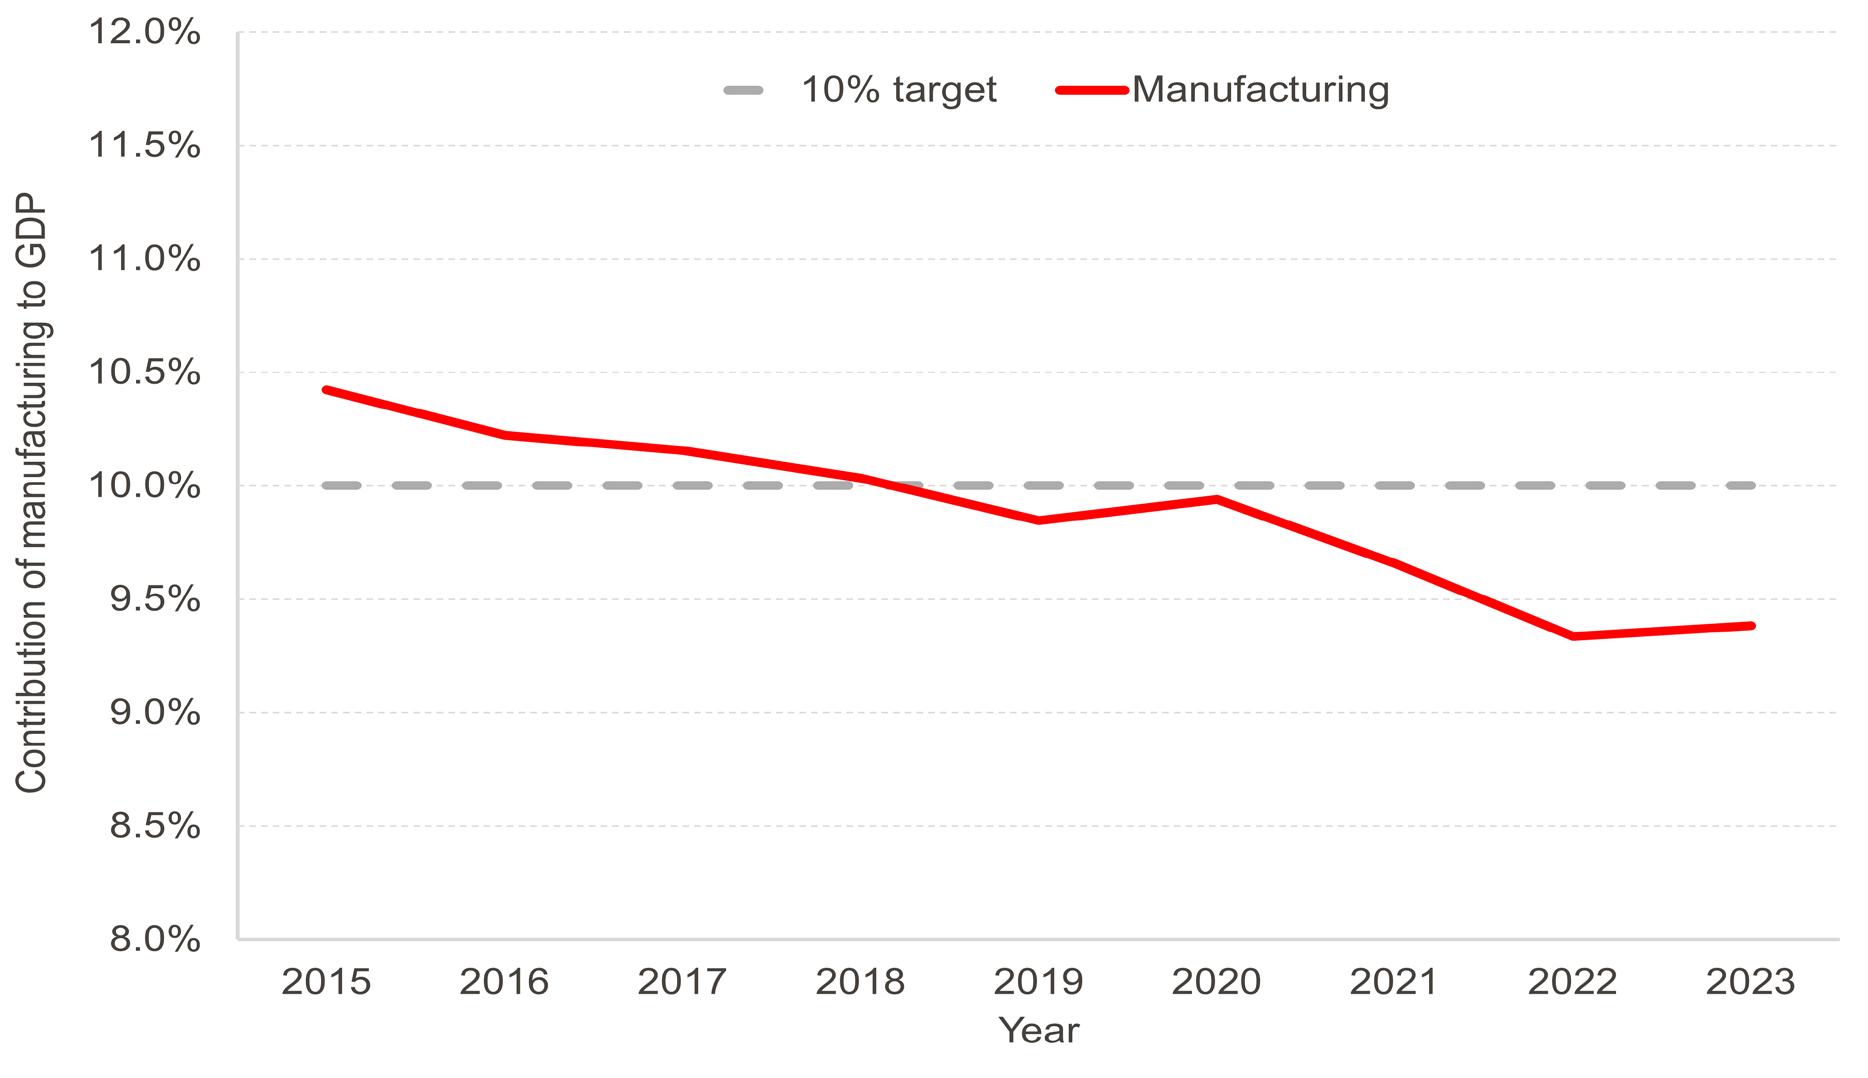
Source: ONS
However, the manufacturing sector is one of the most significant industries for producing GVA across many areas of the UK, especially outside the traditional high GVA areas such as Inner London West and Inner London East.
Diagram 2 displays how the wider aluminium industry, and specifically the aluminium production sector, supports employment outside high GVA areas, helping to distribute the UK’s GVA more evenly across the country. This distribution is key for boosting productivity and competitiveness across all UK regions.
The second manifesto pledge from ALFED calls for action to strengthen the UK’s aluminium industry to tackle energy security and net-zero policies. ALFED note this investment would not only strengthen the UK's economic resilience by shortening supply chains and fostering local manufacturing capabilities, but also mitigate the country's vulnerability to international carbon tax mechanisms and origin requirements associated with importing aluminium. The new government supports the introduction of a carbon border adjustment mechanism to help address carbon leakage in an effort to support the UK's net-zero journey.
Aluminium production has reduced total greenhouse gas emissions by approximately 8.5% from 2015 to 2022 (see Chart 9). Emissions reached as low as 450 ktCO2e, although this was likely facilitated by the COVID-19 pandemic, which slowed down the industry. Since then, emissions have been increasing again, although they remain significantly below 2018 levels.
Chart 9: Aluminium production total greenhouse gas emissions
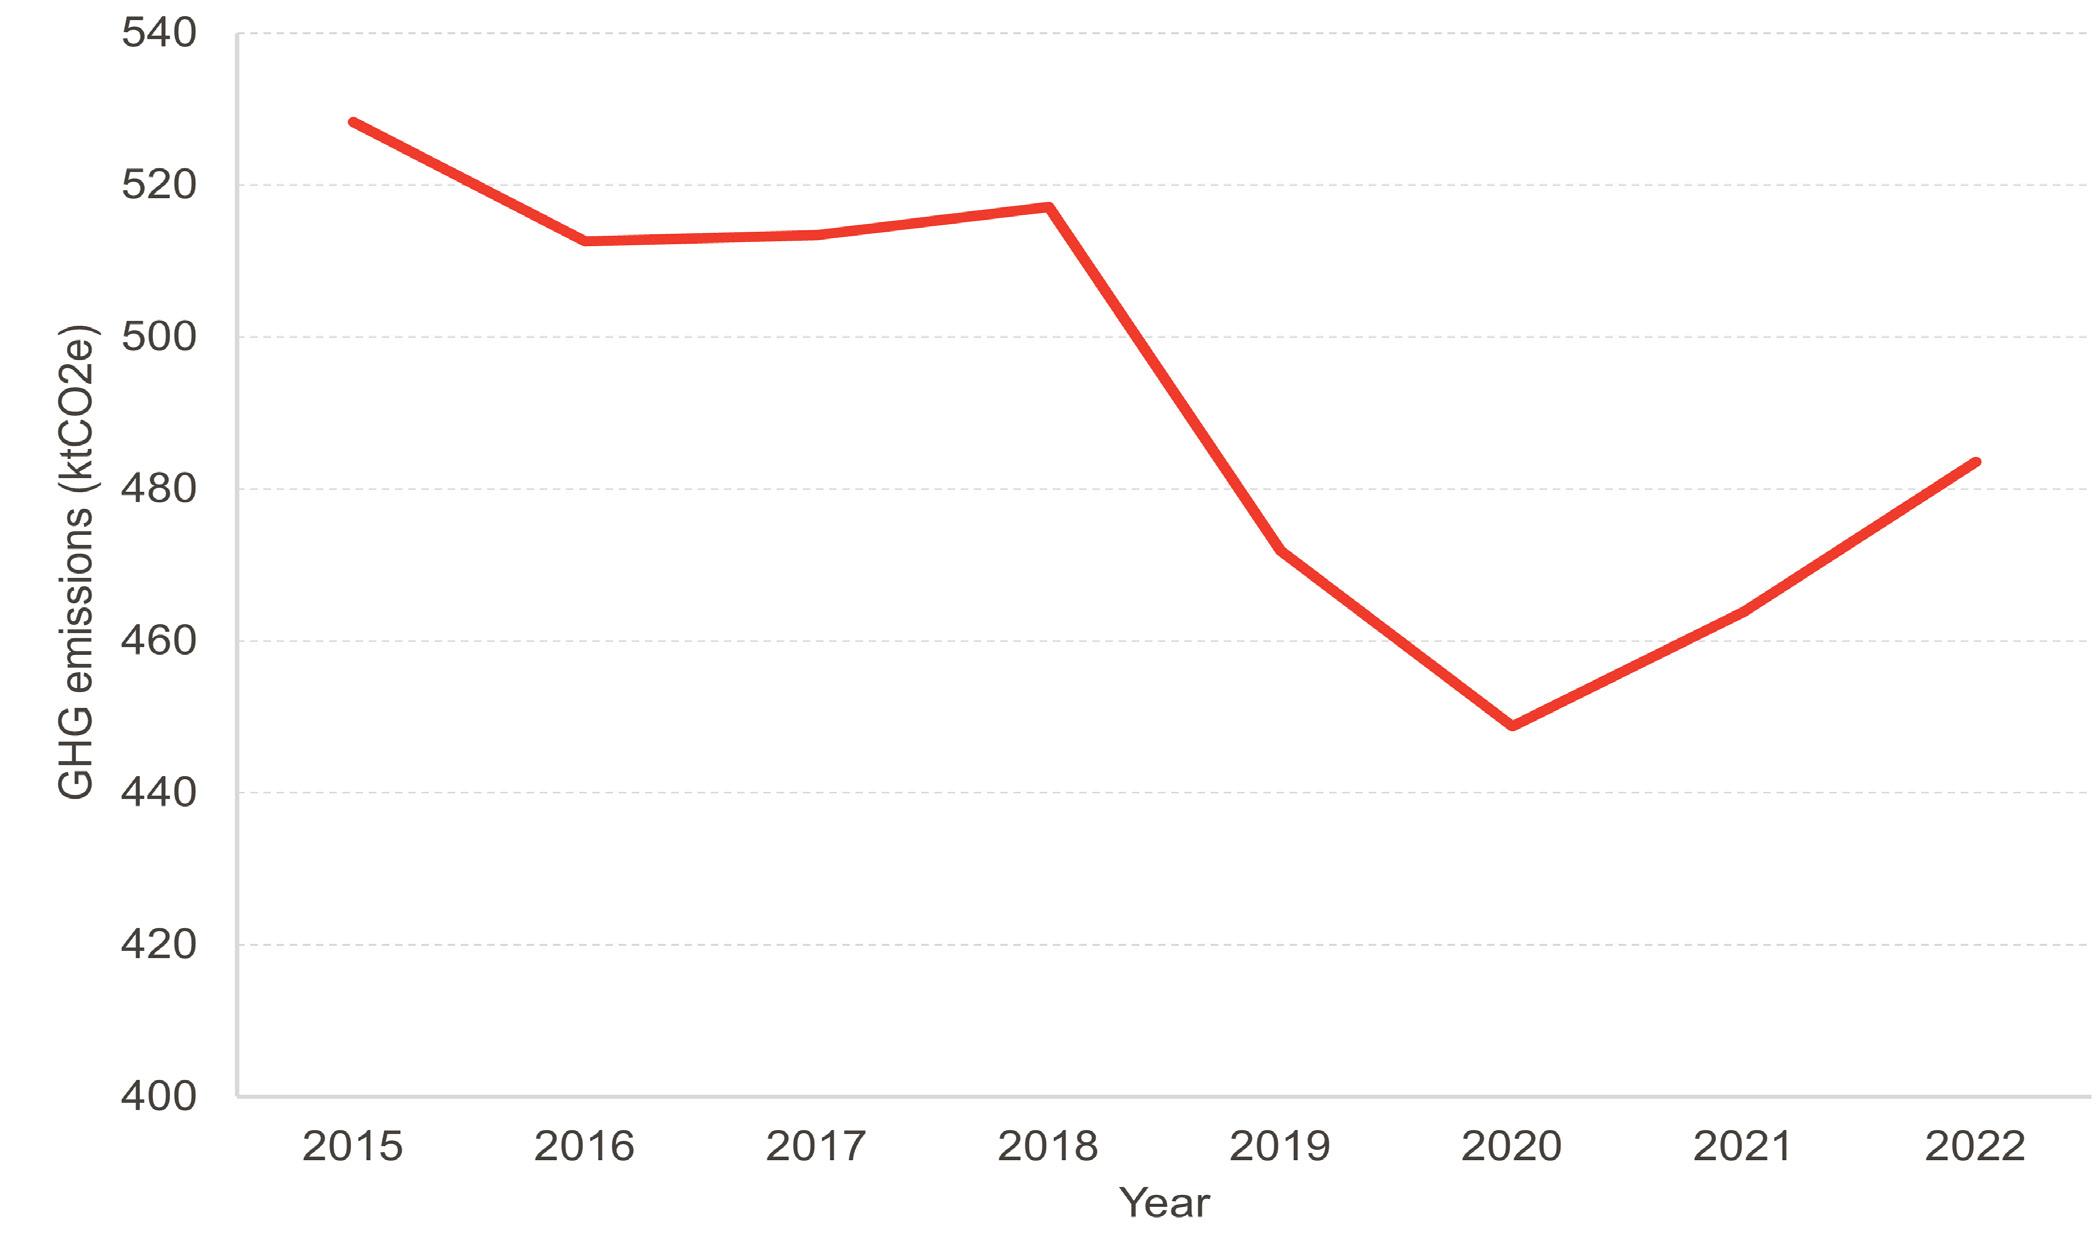
Source: ONS
In their third manifesto pledge, ALFED has called on the Government to prioritise the return of political and policy stability to foster an environment conducive to long-term investment and growth.
Survey data collected from ALFED members reflects these concerns. Chart 10 shows that 90% of respondents identified delivering long-term economic growth and stability as a top priority for the new government.
Economic uncertainty emerged as the most significant factor impacting companies' investment plans, as displayed in Chart 11, with 66% of respondents citing it as the greatest influence. These findings underscore the industry's desire for a stable political and economic landscape to support growth and investment in the UK aluminium sector. The survey results shown in Chart 12 indicate a mixed response to ALFED members' concerns compared to three months earlier, with the largest group (around 45%) reporting no change in their level of concern. However, a significant portion of businesses reported increased concern, with approximately 25% slightly more concerned and 10% significantly more concerned.
The Government has stated that creating a stable policy environment to give investors the certainty they need to fuel growth is one of their top priorities. They have also committed to involving industry, trade unions, and civil society in plans for growth, so all can contribute to building a stronger economy across the country.
Chart 10: What should be the top (3) priorities for the new UK government?
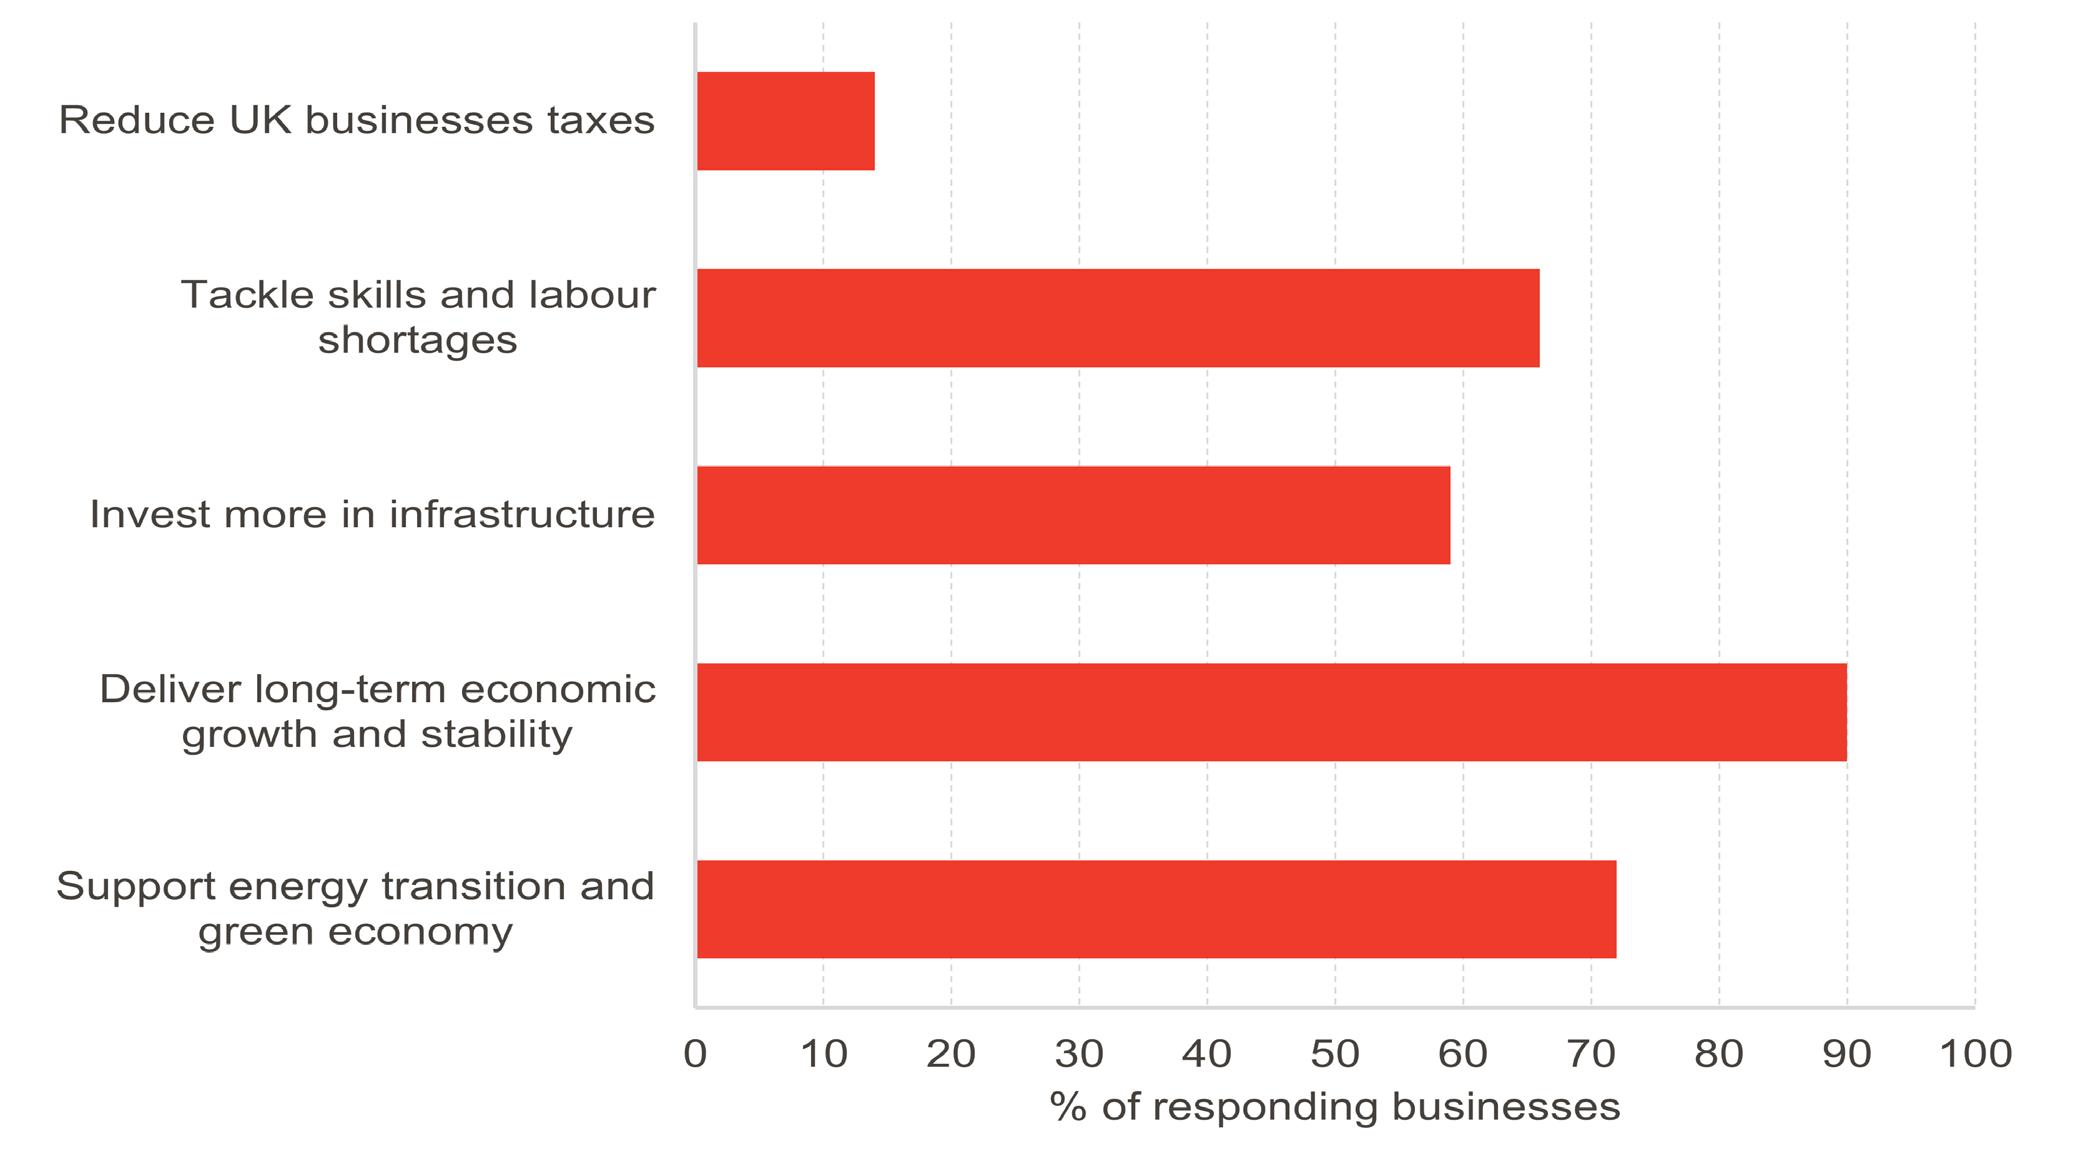
Source: FAI/ALFED Members Survey
Chart 11: Which of the following factors has had the greatest impact on your company’s investment plans?
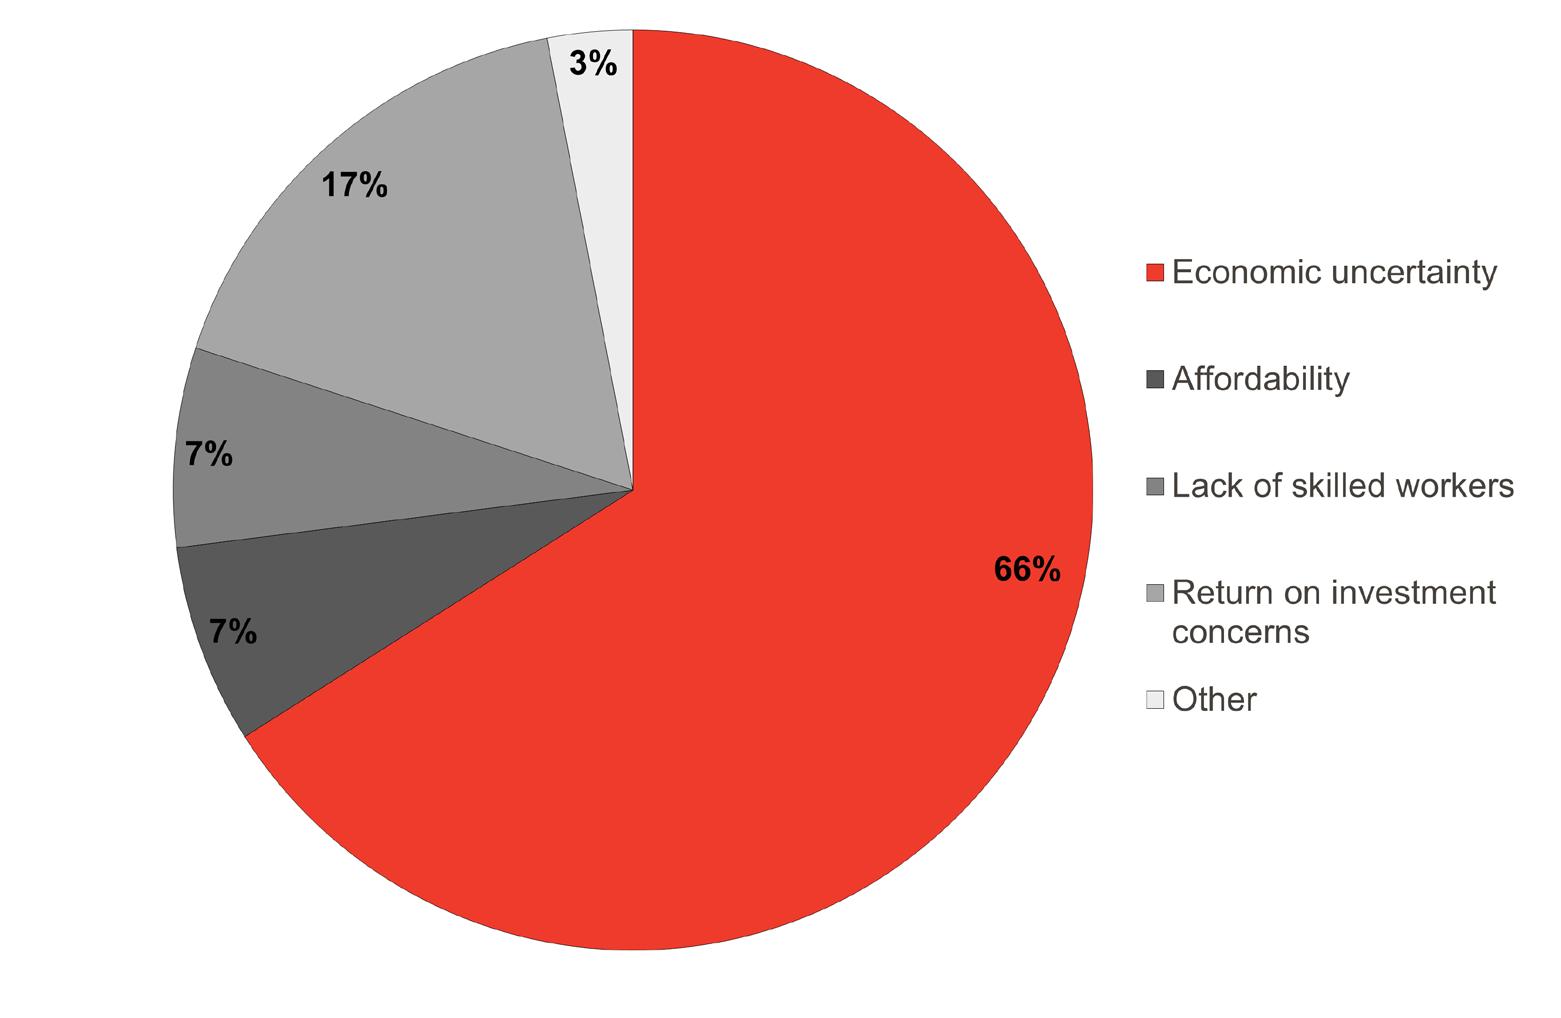
Source: FAI/ALFED Members Survey
Chart 12: Compared to 3 months ago, is your businesses more or less concerned about the stability of the current economic environment?
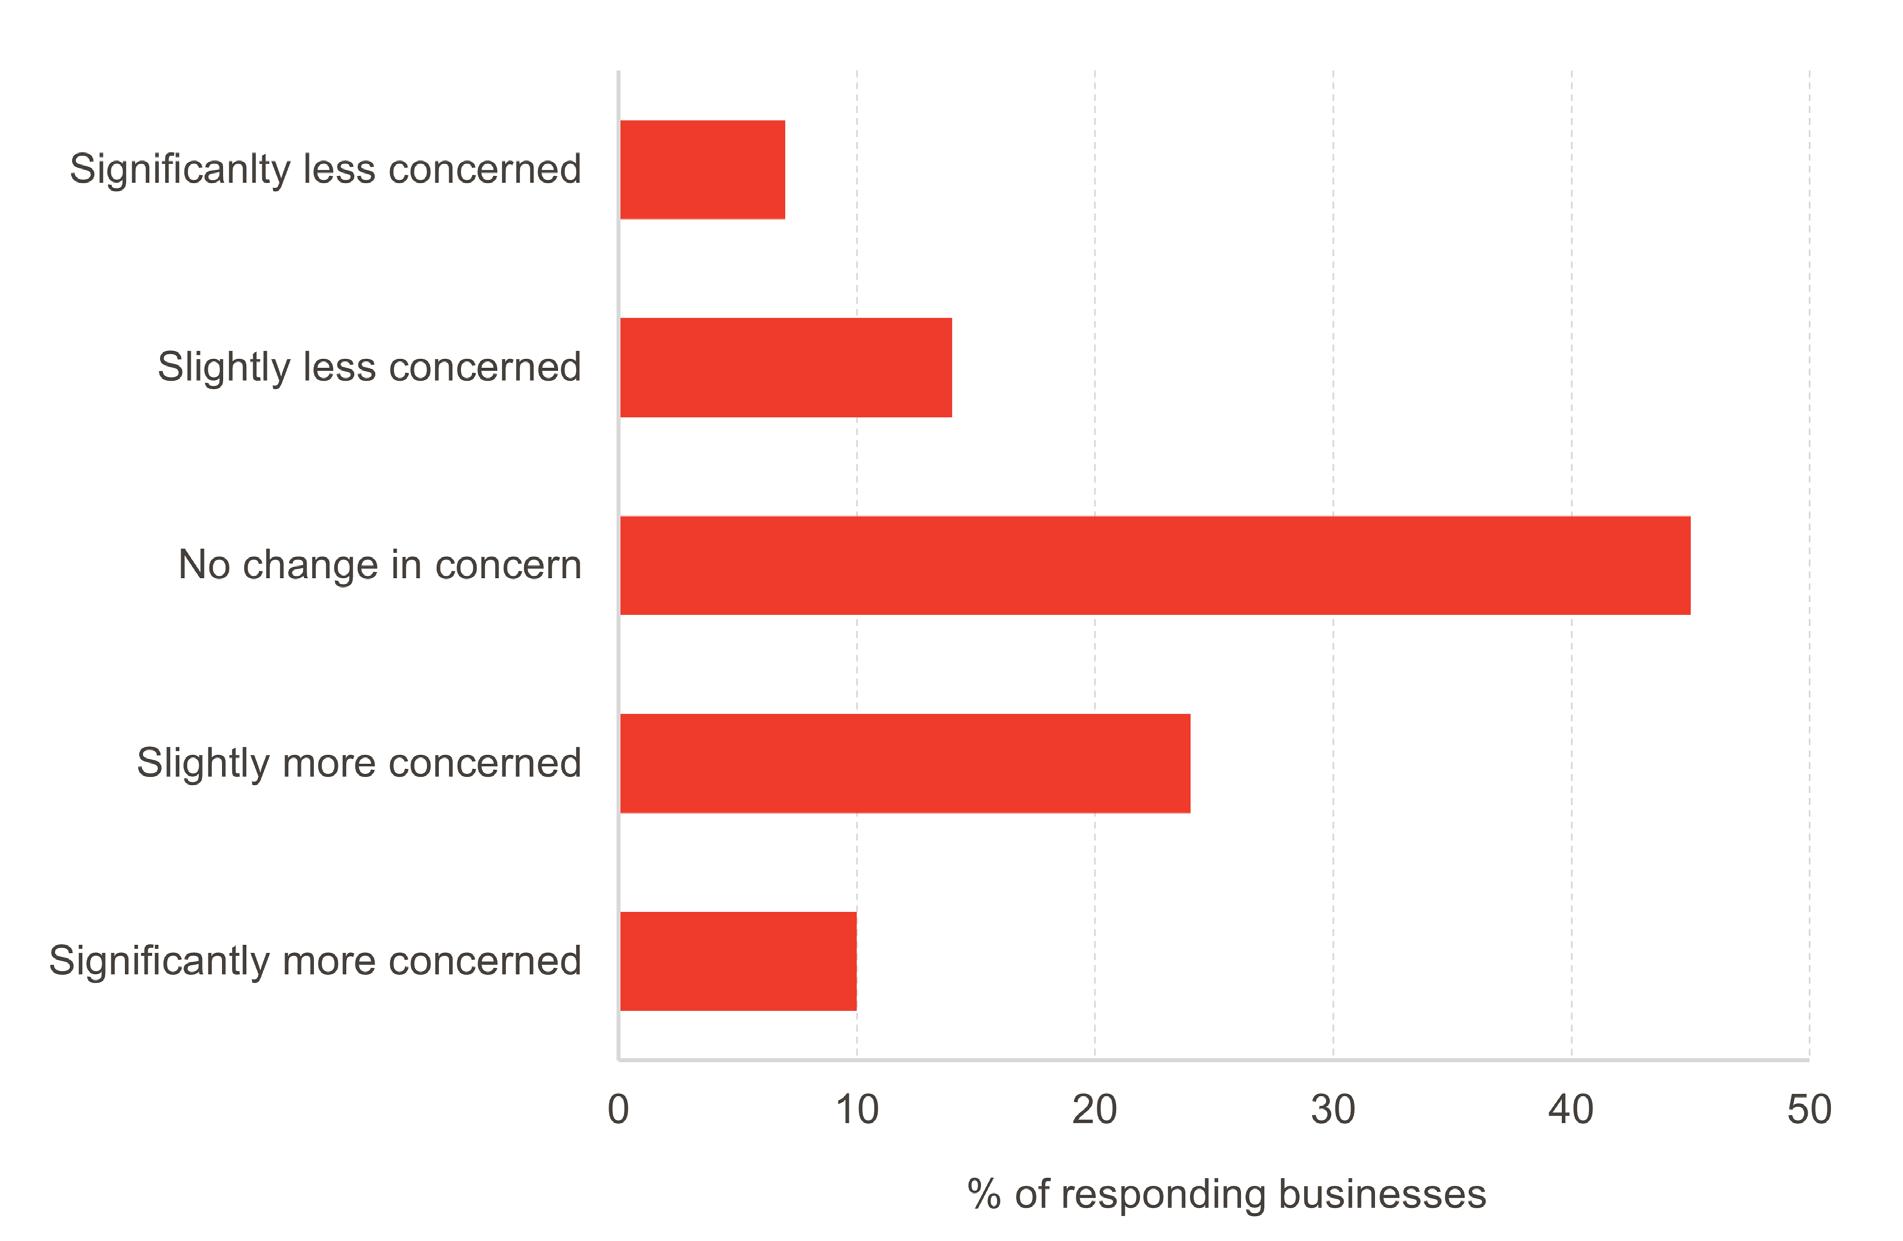
Source: FAI/ALFED Members Survey
The fourth manifesto pledge advocates for a skills revolution to equip the current and future workforce with the digital skills necessary for advanced manufacturing. The manifesto calls for substantial reforms of the Apprenticeships Levy and vocational skills system to achieve this.
Survey data from ALFED members provides insight into the industry's priorities for government action. Fifty-five per cent of respondents believe increased funding for vocational education and training programmes would be most important for improving talent acquisition, while 34% support reforming the Apprenticeships Levy, showing that these issues align closely with the industry's needs.
Regarding key skills, teamwork and collaboration, along with problem-solving and critical thinking, are highly valued by ALFED members in job applicants. However, in the future, ALFED members anticipate that digital skills, especially technical skills, will be most in demand over the next 5 to 10 years, highlighting the importance of a skills revolution like the one ALFED has proposed.
The new UK government has committed to reforming the Apprenticeships Levy, proposing a more flexible Growth and Skills Levy to address vital skills and training requirements.
Chart 13: What would be the most important thing the government could do to improve the potential talent hired in the aluminium industry?
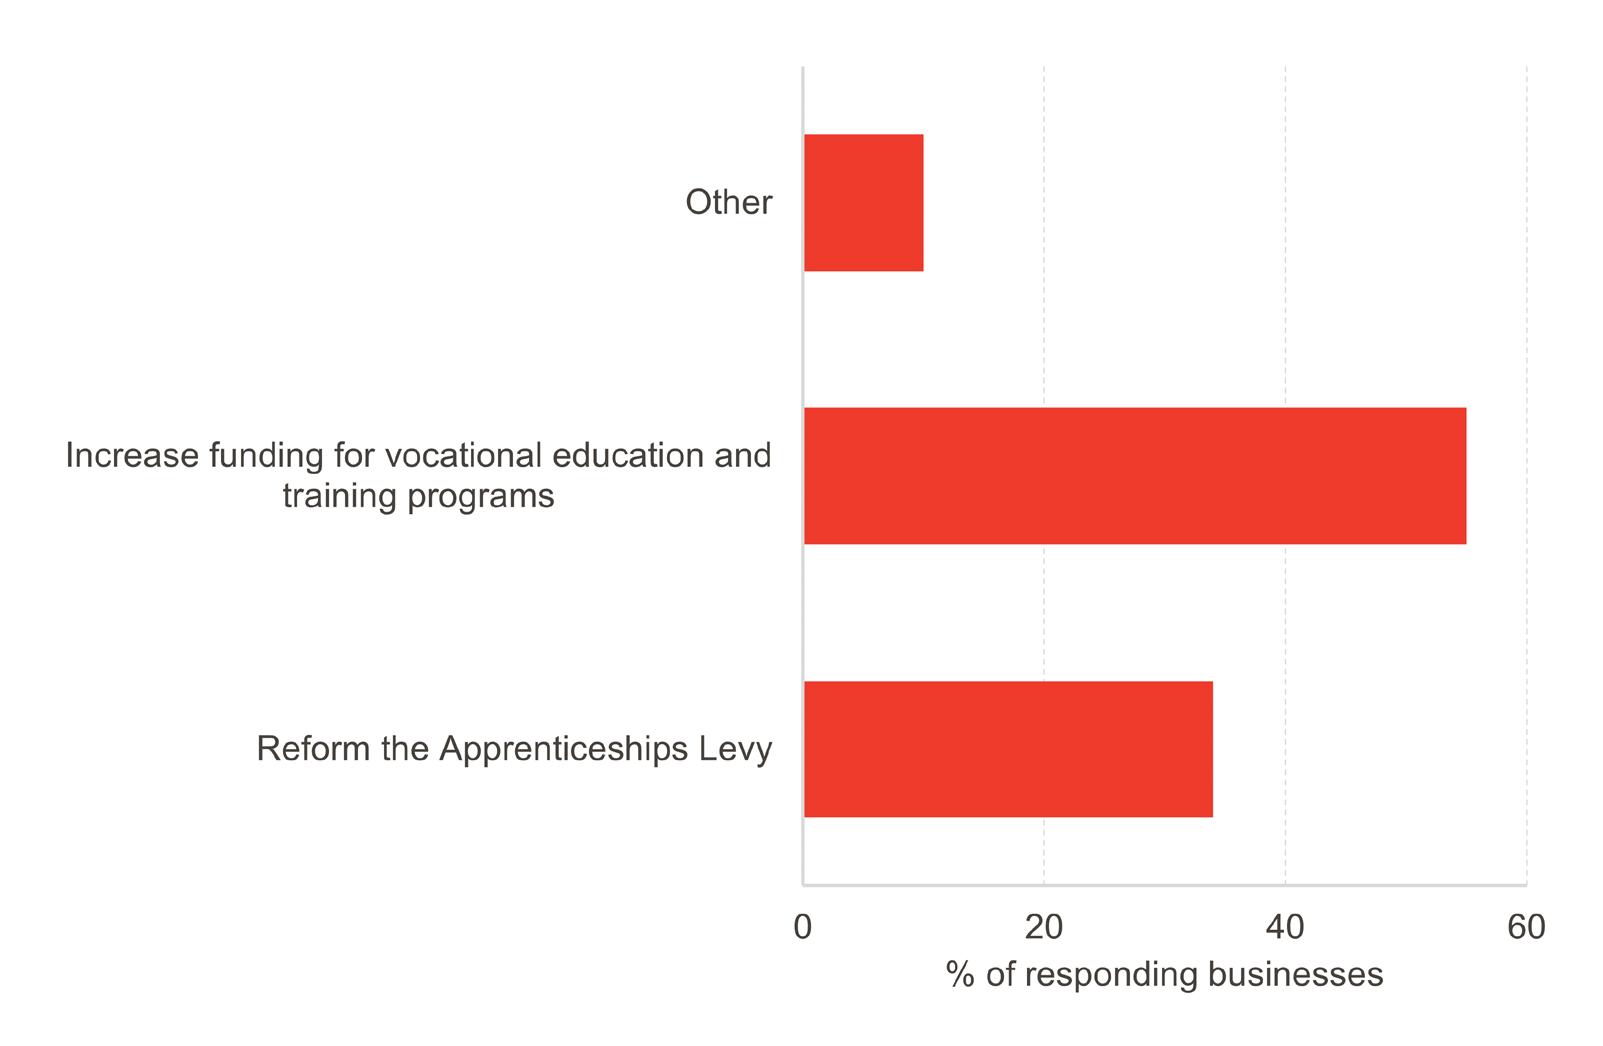
Source: FAI/ALFED Members Survey
Chart 14: Which of the following skill sets do you most value in job applicants to be successful in your businesses?
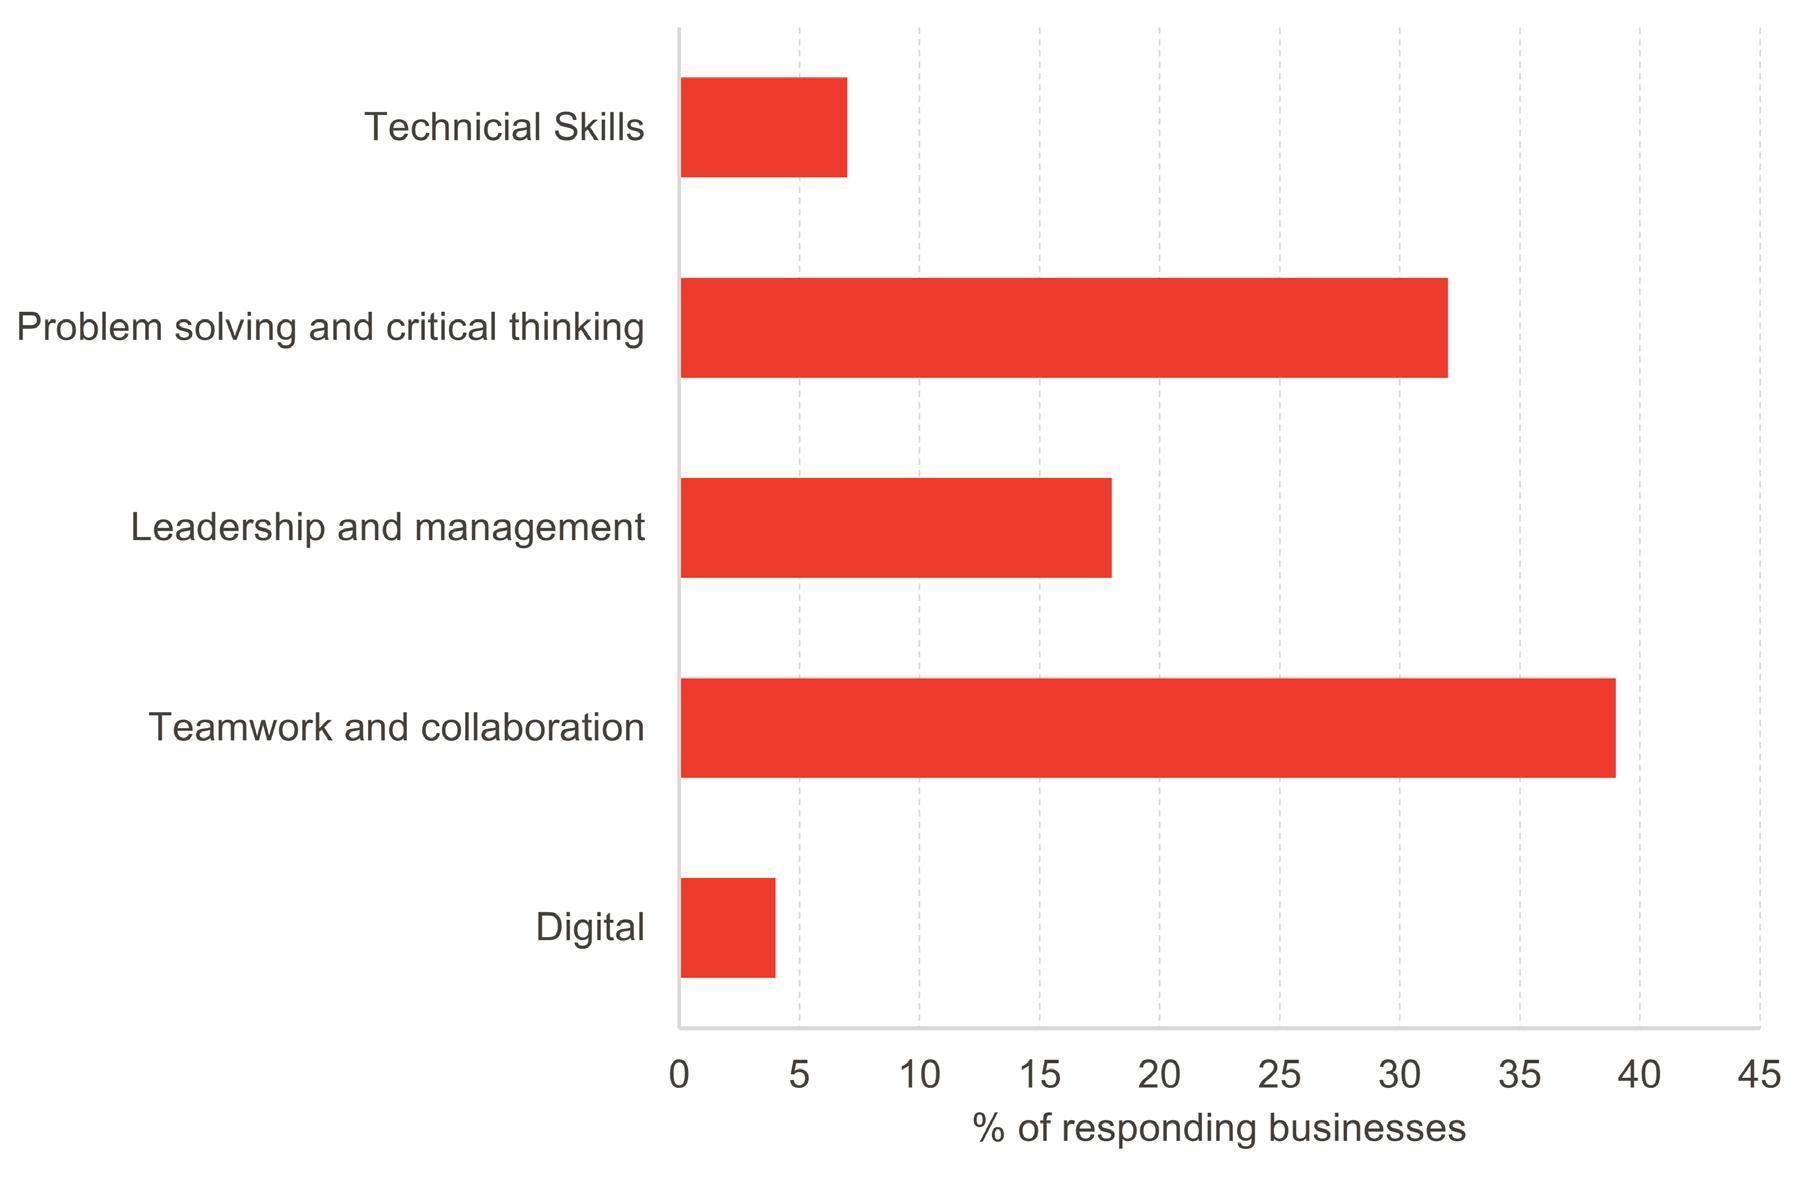
Source: FAI/ALFED Members Survey
Chart 15: Which skills do you anticipate will be the most in demand for the aluminium industry over the next 5 to 10 years?
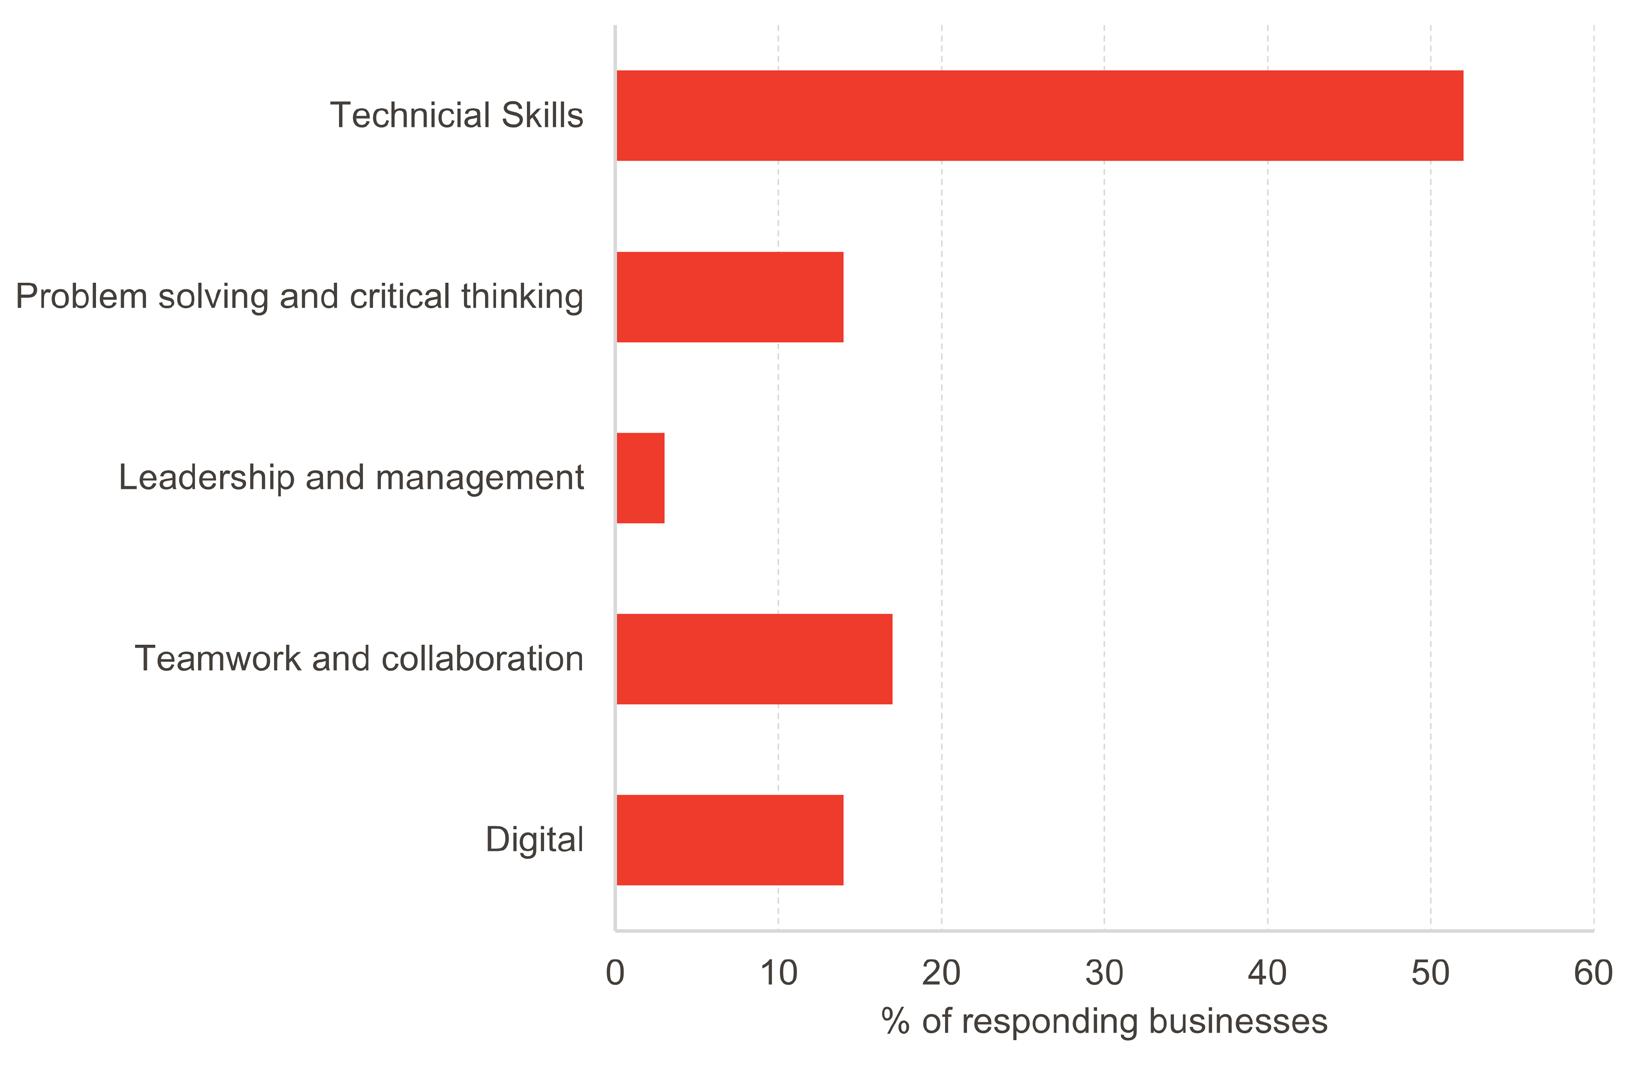
Source: FAI/ALFED Members Survey
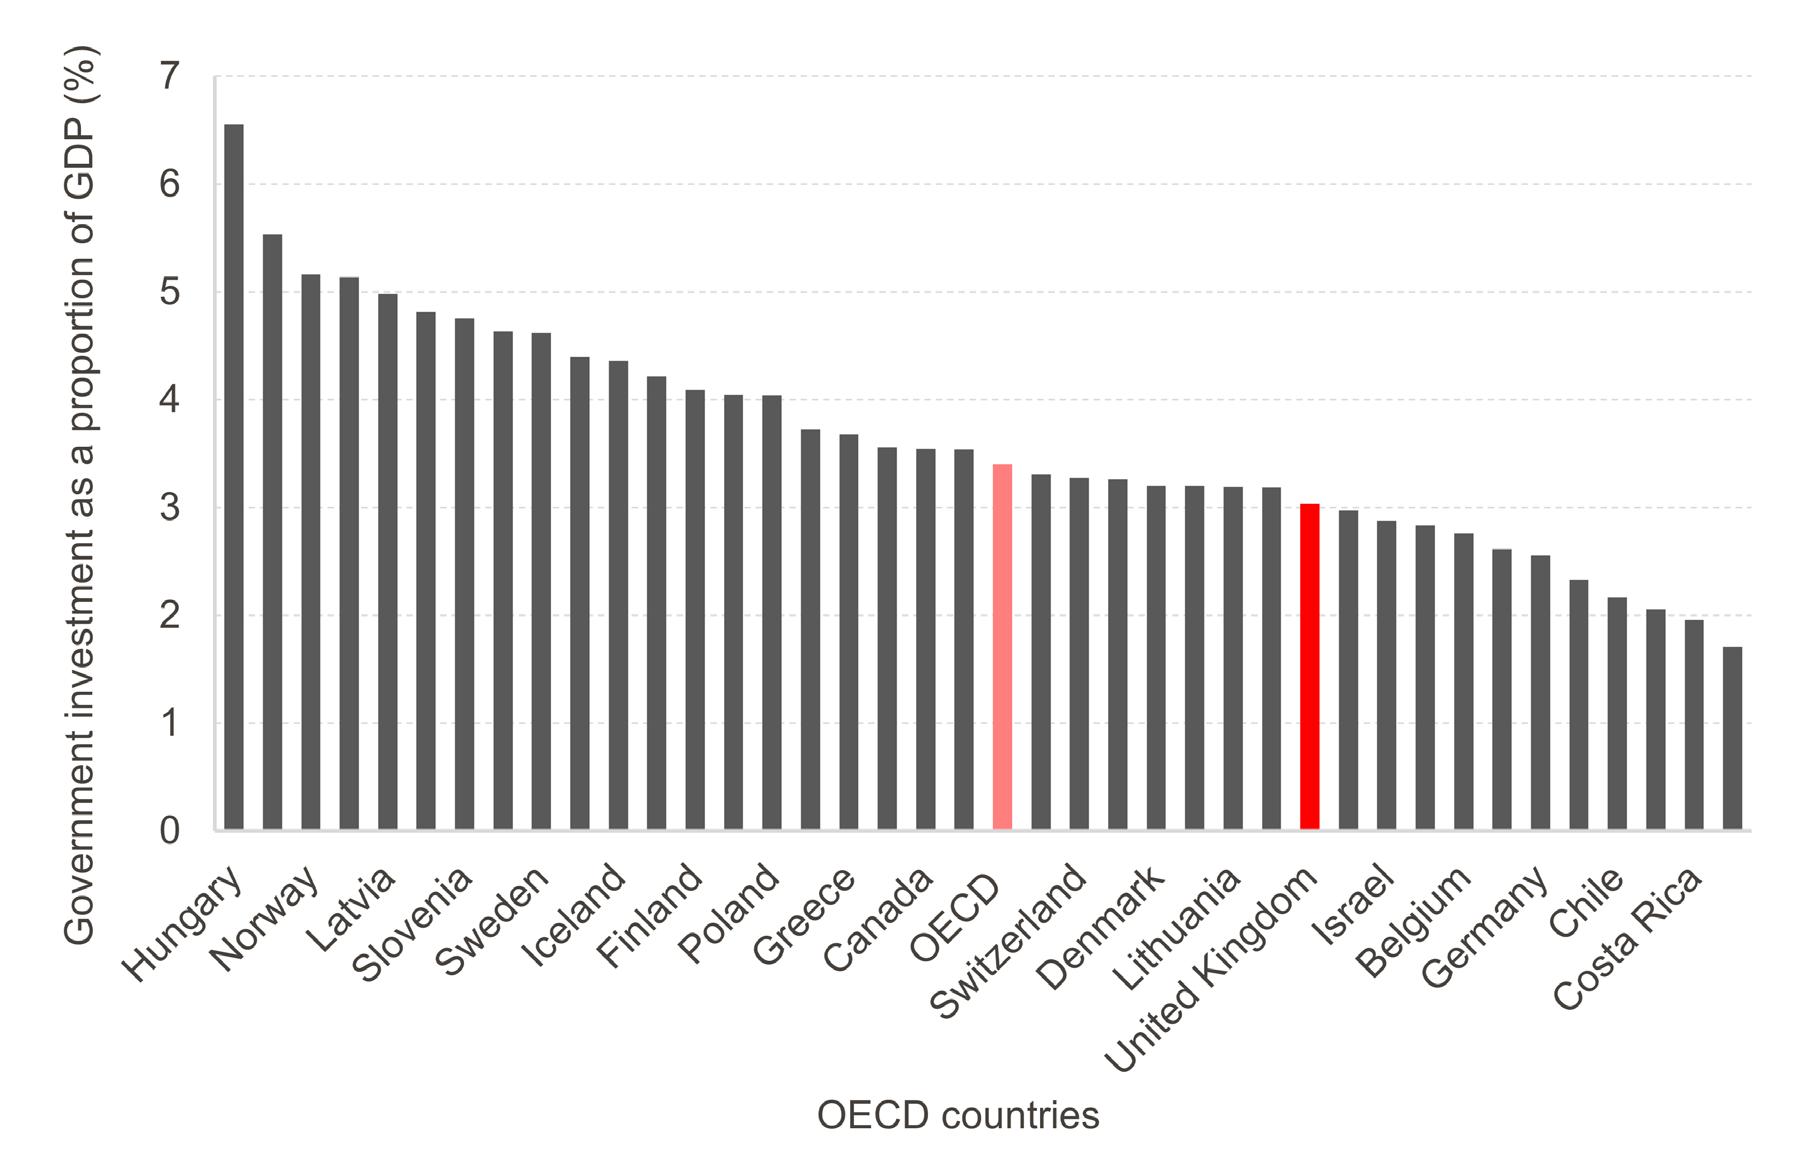
The Aluminium Federation's fifth manifesto pledge calls for increased infrastructure spending to match the OECD average, with a focus on maximising opportunities in the net-zero economy. This includes investments in transportation, energy, and digital infrastructure to support the growth of the aluminium sector.
Data from the OECD, shown in Chart 16, highlights that UK government investment as a proportion of GDP stands at approximately 3%, significantly below the OECD average of around 3.4%. This places the UK 25th out of 38 OECD countries, behind nations such as Norway and Sweden, which invest over 5% of their GDP in infrastructure.
Increasing infrastructure investment to the OECD average is crucial for the growth of the aluminium sector and the broader net-zero economy. The Chancellor, Rachel Reeves, has unveiled a series of reforms aimed at 'Britain building again.' These plans are intended to 'accelerate the building of critical infrastructure for energy, transport, and technology.
Chart 16: Government investment as a proportion of GDP, 2021 (%)
Source: OECD
The three reports published by the Fraser of Allander Institute have been unique, to our knowledge, in their attempt to define the aluminium industry in a way that goes beyond aluminium production (SIC24.42).
In consultation with ALFED, it became clear that there was a need to create a broader definition—one that encompasses a range of domestically manufactured aluminium products that fall outside the narrow definition of aluminium production.
The process of determining what could be considered part of the wider aluminium industry can be summed up in three steps:
■ Step 1: SIC codes were used to identify sections of industries which were clearly aluminium. This included what we have already described as the narrow aluminium industry (SIC 24.42).
■ Step 2: Use the ONS UK Manufacturers' Sales by Product Survey (PRODCOM) to assess how much of a given SIC code could be allocated to the wider aluminium industry.
■ Step 3: Use harmonised system (HS) commodity codes from HMRC overseas trade data to estimate the share of a given 8-digit SIC code that could be attributed to the wider aluminium industry when PRODCOM could not be used.
An example of this process is discussed below:
SIC 25 - Manufacture of fabricated metal products
SIC 2512 - Manufacture of doors and windows of metal
SIC 25121050 - Aluminium doors, thresholds for doors, windows and their frames
By searching through PRODCOM, we found that aluminium doors, thresholds for doors, windows and their frames (SIC 25121050) account for approximately 6% of total UK manufacturer’s sales in SIC 25.
We determined that as the sales of this product account for 6% of sales, it was reasonable to assume that we could extract a 6% share of SIC 25’s GVA and attribute it to the wider aluminium industry.
Example 2.
SIC 29 - Manufacture of Motor Vehicles, Trailers and Semi-trailers
SIC 2932 - Manufacture of other parts and accessories for motor vehicles
SIC 29323040 - Road wheels and parts and accessories thereof SIC 29323040 (41%)
The sales of road wheels and parts and accessories thereof totalled £120 million in 2022. Within PRODCOM, SIC code 29323040 is noted to have the corresponding HS commodity code 870870 for overseas trade.
Due to the nature of overseas trade data and its use for applying trade tariffs, HS commodity codes often offer a higher degree of detail regarding what a product is made of. In this case HS 870870 is broken down into four subcategories, one of which is 87087050 (aluminium road wheels and aluminium parts and accessories thereof).
Using export data from 2019 it was possible to determine proportion road wheels and accessories exported that were aluminium. This figure was then used as a proxy for the share of domestic production that could be assumed to be aluminium.
Using this method, we were able to take a 41% share of the total UK manufacturer’s sales for SIC 29323040 and attribute it to the wider aluminium industry.
Example 3.
SIC 2592 - Manufacture of light metal packaging
SIC 25921350 - Capsules of lead; capsules of aluminium
We found that sales of capsules of lead and capsules of aluminium (SIC 25921350) totalled £58 million in 2022.
Within PRODCOM there was no indication of the proportion of capsules that were made of aluminium. Attempts were made to use HS commodity codes in the same way as was described in example 3 above.
When HS commodity codes did not offer a higher degree of detail, we concluded that there was insufficient data to determine a fair share of this SIC code that could be considered as aluminium.
Despite a share of this SIC being a good candidate for inclusion, data limitations led to this SIC code to not be included in our wider definition of the aluminium industry.
ONS GDP(O) Low-Level Aggregates data provided current price estimations of GVA for various SIC codes. GVA figures are often available at the 2-digit and sometimes 3-digit levels. The decision was made to take the most granular GVA data available and then to find the corresponding share of that SIC code that was considered to belong to the wider aluminium industry. Although a GVA figure was available for SIC 24, the data also included a figure for 24.4-5. Once we determined the share of 24.4-5 that could be attributed to aluminium we calculated the GVA contribution of the wider aluminium industry that comes from SIC 2.4-5. An example of this process is shown below in Table 4.
Source: FAI calculations
This process was reiterated for the remaining SIC divisions where aluminium products had been found. A total GVA figure for the wider aluminium industry was then calculated by aggregating all of the individual GVA figures.
Modelling the economic impact
Modelling the impact of the wider aluminium industry was carried out using the 2016 FAI UK HEM. This model removes wider aluminium industry from the UK economy and estimates the impact this would have on the surrounding industries in terms of GVA and employment.
GVA is the value of goods and services produced minus intermediate goods and services consumed in the production process. GVA is similar to GDP however a key difference is that GVA does not take into account taxes and subsidies i.e., GDP at basic prices.
Employment
Employment here refers to full-time equivalent (FTE) jobs. One FTE job is equal to a single person working full-time hours or two people each working half the hours of a full-time worker over the same period.
HEM methodology
The 2019 FAI UK HEM was purpose built for this project using the UK input-output analytical tables (IOATs) on an industry by industry basis. IOATs are often used to model supply chains and estimate multiplier effects in the economy. The HEM is effective in estimating the impact on the economy of removing the economic activity of an industry. While there are more recent IOATs available, due to the anomalous impacts of the pandemic on the 2020 and 2021 tables, the FAI consider the updated 2019 IOAT to be the best avaiable for building our HEM.
A useful feature of the HEM is that it can be used to remove part of an industry and leave the remaining part in place. This makes the HEM useful for modelling the impact of the wider aluminium industry and as it is a composite industry, containing shares of multiple industries e.g., the manufacture of basic metals and castings (SIC 24.4-5), manufacture of fabricated metal products, excluding weapons and ammunition (SIC 25OTHER), and manufacture of motor vehicles; trailers and semitrailers (SIC 29). This model allows an examination of the spill-over effects that occur when sales and purchases of the wider aluminium industry are removed.
The model compares the before and after states to estimate the importance of the industry to the UK economy. Table 5 shows the share of each individual 2-digit SIC industry that was taken and extracted by the 2019 FAI UK HEM. The combination of these shares is how we define the wider aluminium industry.
Using the shares of 2-/3-digit SIC codes, it was also possible to find employment statistics for the wider aluminium industry using the Business Register and Employment Survey (BRES). The BRES employment data was added to the FAI 2019 UK HEM to improve the accuracy of the model.
Table 5: Determining GVA from industry shares
Source: FAI calculations
The wider aluminium industry as we have defined it is spread over multiple 2-digit and 3-digit SIC codes.
In order to estimate a GVA figure, a method was required to assess how much of each 2- or 3-digit SIC code’s GVA figure should be taken.
This report makes the following initial assumptions about how the GVA share can be calculated:
■ The share of 2-/3-digit SIC code that can be attributed to the wider aluminium industry can be found by dividing the total UK manufacturer’s sales by the total aluminium product sales in the same 2–3-digit SIC.
■ The share of a 2-/3-digit SIC code that can be considered as part of the aluminium industry, is an appropriate share to use when calculating the same SIC code’s wider aluminium industry GVA figure.
An example of this process can be found in Table 4.
When data limitations made it impossible to take shares of 2-/3-digit SIC codes using only PRODCOM, we turned to HS commodity codes from HMRC overseas trade data.
This process involved trying to find HS commodity codes which offered a higher degree of detail regarding what a product was made of.
When a useful HS commodity code was found, we were able to calculate the share of exports in that product group that were aluminium products.
We assumed that this traded share could act as a suitable proxy for the share of domestically produced aluminium products under the same SIC code found in PRODCOM. An example of this process can be found in example 2 of the methodology section.
We consider the GVA and employment figures given in this report to be the lower bound of likely estimates for the size of the wider aluminium industry.
The lack of detailed data on domestically manufactured aluminium products is likely to have resulted in a significant underestimation of GVA and employment statistics.
A large number of products which we believe to be good candidates for inclusion in our definition, are due to data constraints, not included in these report’s estimations.
One example worth discussing is the numerous aluminium automotive vehicle components which could not be included. This report was able to quantify the GVA contribution that arises from the production of aluminium vehicle wheels.
Due to data limitations, we were not able to account for any other automotive component. A 2019 Ducker Frontier report on the aluminium content in European cars estimates that road wheels account for approximately 21% of the aluminium content in an average European vehicle.
This report indicates that a significant proportion of the aluminium content vehicles is located within the engine, suspension systems, body components, brakes, and heat exchangers.
It is important to discuss the limitations of this report in the context of the available data. There are two methods for classifying aluminium products used in this report:
■ The first method involves using Standard Industrial Classification (SIC) codes. SIC codes are the classification system used in PRODCOM.
■ The second method of classification is the harmonised system (HS) commodity codes used in HMRC overseas trade data.
The two methods of classification are largely used for different end goals.
PRODCOM is a survey of UK manufacturer’s product sales, as such, it and the classification system it uses are geared towards the use of a given product. Put simply, PRODCOM is less concerned about what a product is made from and more concerned about what it is made for.
HS commodity codes are primarily used in HMRC overseas trade data.
Within this system products are categorized according to the material they are primarily made of. Aluminium products, for example, are in general located in Chapter 76. These data, however, do not allow us to estimate the size of the wider aluminium industry as it tracks imports and exports and does not include observations of domestic production.
There is a considerable lack of harmony between these two sources of data which makes analysis of the wider aluminium industry challenging.
The current data landscape lacks a source of information which classifies products by the material they are comprised of and includes information on the level of domestic production. This is a considerable barrier to overcome when estimating the size of the wider aluminium industry.
As discussed above, our estimation of the size of the wider aluminium industry captures a small share of aluminium products manufactured for the automotive industry. Our 2022 report attempted to estimate the aluminium content of the average UK passenger car and the additional GVA comtribution associated with such production. We were ultimately unsuccessful due to the limits of publicly available data. Going forward, the FAI consider quantifying the role of aluminium in UK automotive production to be a valuable step.
The data provided in Section 3 of this report can be used in the future to measure progress in achieving the manifesto pledges ALFED has made. This section aligns with the ALFED UK Aluminium Manifesto 2024 and provides baseline data and indicators for each of the five key pledges.
For example, the ALFED members survey presented in Section 3 provides valuable insights into current industry concerns and priorities. This survey could be repeated in the future to track changing sentiments and needs within the aluminium industry. By repeating these questions about economic concerns, investment factors, government priorities, and skills demands, ALFED can establish useful data over time.
Additionally, quantitative data, such as the contribution of manufacturing to UK total GVA, greenhouse gas emissions from aluminium production, and the UK's infrastructure investment as a proportion of GDP, can be tracked over time to better understand progress in the future.
This report updates and expands upon our previous analyses of the UK aluminium industry's economic contribution. Key improvements include: (1) separating the economic contributions of the aluminium production sector from the wider aluminium industry, and (2) conducting a survey of ALFED members to develop indicators that serve as baseline data for ALFED's 2024 UK Aluminium Manifesto pledges.
Our modelling suggests that the wider aluminium industry contributes approximately £4.3 billion in GVA directly, rising to about £9.3 billion when including spill-over effects. Aluminium production alone contributes around £1.5 billion in GVA directly, increasing to roughly £1.9 billion when spillover effects are included.
Both the wider aluminium industry and aluminium production provide employment across the UK, with the highest concentration of jobs located in the West Midlands. In 2022, over 41,000 people were directly employed by the wider aluminium industry, with 4,000 of them working in the aluminium production sector. When spill-over effects are considered, the wider aluminium industry supports an estimated 108,000 FTE jobs, while aluminium production alone supports approximately 16,500 jobs.
Our survey of ALFED members highlights the need for economic stability, long-term growth, and prioritising the development of essential skills for firms today and the industry in the future. Although this survey provides only a snapshot of member sentiment, it serves as a strong foundation for assessing the direction of the economy and industry in the coming years.
The UK aluminium industry has demonstrated considerable resilience in recent years. Aluminium production and aluminium goods manufactured in the UK will continue to play a significant role in the transition to a more circular and sustainable economy.
Fraser of Allander Institute
University of Strathclyde
199 Cathedral Street
Glasgow G4 0QU
Scotland, UK
Telephone: 0141 548 3958
Email: fraser@strath.ac.uk
Website: fraserofallander.org
Follow us on Twitter via @Strath_FAI
Follow us on LinkedIn: FAI LinkedIn