WATER QUALITY REPORT 2024
City of Allen Water Utility employees take pride in delivering safe and “superior” quality drinking water to our customers. Our water system is rated “superior” by the Texas Commission on Environmental Quality (TCEQ). This rating reflects the hard work and efforts by our employees to protect your health by delivering and maintaining safe and reliable drinking water. We recognize the North Texas Municipal Water District (NTMWD) for producing high-quality drinking water.
WHERE DOES YOUR WATER COME FROM?
The Water Utilities Department is a municipal water distribution and wastewater collection utility owned by the City of Allen. Wholesale treated water is purchased from NTMWD and delivered to our ground storage tanks. From there, the water is delivered to customers through the city’s distribution system.
NTMWD gets raw water from Lavon Lake and Bois d’Arc Lake and treats it at the Wylie Water Treatment Plant and Leonard Treatment Plant. In addition to Lavon Lake and Bois d'Arc Lake, NTMWD holds water
rights in Lake Texoma, Jim Chapman Lake (Cooper Lake), Lake Tawakoni and the East Fork Raw Water Supply Project (Wetland) which augment supplies. For detailed information on our water sources, treatment processes and more, please visit www.ntmwd.com.
The TCEQ completes a Source Water Susceptibility Assessment for all public drinking water systems. The report describes the susceptibility and types of constituents that may come into contact with your drinking water source based on human activities and natural conditions. The system from which the city purchases its water received the assessment report. For more information on source water assessments and protection efforts contact the NTMWD at 972.442.5405 or by email at watersystem.info@NTMWD. com.
CITY OF ALLEN WATER DISTRIBUTION SYSTEM
The pumping and storage station is comprised of two pump stations, five ground storage tanks and five elevated storage tanks. The ground storage capacity is 24 million gallons. Elevated storage capacity is 9 million gallons with a system pumping capacity of 80 million gallons per day.
The Water Distribution System is comprised of more than 507 miles of water mains, 5,483 fire hydrants, 14,874 water valves and 34, 559 metered service connections. In the water loss audit submitted to the Texas Water Development Board for the time period of Jan.-Dec. 2023 our system lost an estimated 569,272,882 gallons of water. If you have any questions about the water loss audit, please call 214.509.4502.
From pipe to tank to tap, we deliver safe, high-quality drinking water
Este reporte contiene información importante sobre el agua potable. Para asistencia en español, favor de llamar al teléfono 214.509.4500. A MESSAGE FROM THE
OF
CITY OF ALLEN DISTRIBUTION SAMPLES TAKEN LAST FISCAL YEAR Bacteriological Scheduled 1,320 Disinfectant Residual Scheduled 1,089 Bacteriological Construction 92 Disinfectant Residual Construction 92 Trihalomethane Samples 32 Haleoacetic Acid Samples 32
CITY
ALLEN
WHY IS THIS REPORT IMPORTANT?
Drinking water, including bottled water, may reasonably be expected to contain at least small amounts of contaminants. The presence of contaminants do not necessarily pose a health risk. The U.S. Environmental Protection Agency (EPA) prescribes regulations which limit the amount of certain contaminants in water provided by public water systems. The Food and Drug Administration (FDA) regulations establish limits for contaminants in bottled water, which must provide the same protection for the health of the general public.
This Consumer Confidence Report (CCR) is an annual summary of the quality of drinking water the City of Allen provides to customers. The CCR lists all the federally regulated or monitored contaminants which have been found in your drinking water. The EPA requires water systems to test for over 90 contaminants. Our drinking water meets or exceeds all federal (EPA) drinking water requirements.
ALL DRINKING WATER MAY CONTAIN CONTAMINANTS
Where do these come from? As water travels over the surface of the land or through the ground, it dissolves naturally-occurring minerals and, in some cases, radioactive material, and can pick up substances resulting from the presence of animals or human activity.
Contaminants that may be present in the source water before treatment may include: microbes, inorganic contaminants, pesticides, herbicides, radioactive contaminants and organic chemical contaminants. NTMWD conducts daily tests on all raw water sources and the treated water delivered to the City of Allen. More information about contaminants and potential health effects can be obtained by calling the EPA’s Safe Drinking Water Hotline at 1.800.426.4791.
SECONDARY CONSTITUENTS
Many constituents (such as calcium, sodium or iron) found in drinking water can cause taste, color and odor problems. The taste and odor constituents are called secondary constituents and are regulated by the State of Texas, not the EPA. These constituents are not causes for health concerns. Therefore, secondaries are not required to be reported in this document but may affect the appearance and taste of your water.
CRYPTOSPORIDIUM
NTMWD has tested lake water and treated water for the presence of cryptosporidium for several years. Cryptosporidium has been absent in all samples tested. Cryptosporidium is a protozoan which is so small it can be seen only with a microscope. It affects the digestive tracts of humans and animals. At this time, there is no specific drug therapy proven to be effective, but people with healthy immune systems will usually recover from a cryptosporidium infection within two weeks. NTMWD continues to diligently test both source water and treated water for the presence of cryptosporidium.
SPECIAL NOTICE
WEAKENED IMMUNE SYSTEMS
You may be more vulnerable than the general population to certain microbial contaminants, such as cryptosporidium, in drinking water. Infants, some elderly, or immunocompromised persons such those undergoing chemotherapy for cancer; those who have undergone organ transplants; those who are undergoing treatment with steroids; and people with HIV/AIDS or other immune system disorders can be particularly at risk from infections. You should seek advice about drinking water from a physician or health care provider. Additional guidelines on appropriate means to lessen the risk of infection by cryptosporidium are available from the Safe Drinking Water Hotline at 1.800.426.4791.
OZONATION
NTMWD completed implementation of ozone for primary disinfection at the Wylie Water Treatment Plants in 2014 for compliance with the Disinfection By-Products 2 Rule (DBP2). The DBP2 Rule changed the compliance criteria for trihalomethanes and haloacetic acids which are created when chlorine is used as the primary disinfectant. Ozone is also effective in treating taste and odor compounds associated with the District’s surface water sources.
CHLORAMINES
NTMWD uses Chloramines for disinfection purposes. The benefit of using Chloramines is to reduce the levels of disinfection byproducts in the system, while still providing protection from waterborne disease. The use of Chloramines can cause problems to persons dependent on dialysis machines. A condition known as hemolytic anemia can occur if this disinfectant is not completely removed from the water that is used for the dialysate. Consequently, the pretreatment scheme used for the dialysis units must include some means, such as a charcoal filter, for removing the Chloramine from the water used. Medical facilities should also determine if additional precautions are required for other medical equipment. In addition, Chloraminated water may be toxic to fish.
If you have a fish tank, please make sure that the chemicals or filters that you are using are designed for use in water that has been treated with Chloramines. You may also need to change the type of filter that you use for fish tanks.

CityofAllen.org/SafeWater Find annual water quality reports, water safety resources, how to get involved in water safety and information on sampling and testing. WATER QUALITY AND SAFETY
NOTE: Reported
WATER QUALITY DATA FOR YEAR 2023
Coliform Bacteria*
Regulated Contaminants
NOTE: Not all samples results may have been used for calculating the Highest Level Detected because some
may be part of an evaluation to determine where compliance sampling should occur in the future. TCEQ only requires one sample annually for compliance testing.
of
Nitrate Advisory: Nitrate in drinking water at levels above 10 ppm is a health risk for infants of less than six months of age. High nitrate levels in drinking water can cause blue baby syndrome. Nitrate levels may rise
NOTE: Turbidity is a measurement of the cloudiness of the water caused by suspended particles.
Total Organic Carbon
Cryptosporidium and Giardia
Unregulated Contaminants
NOTE: Bromoform, chloroform, bromodichloromethane, and dibromochloromethane are
contaminant level for these chemicals at the entry point to distribution. These contaminants are included in the disinfection-by-products TTHM compliance
Secondary and Other Constituents Not Regulated
WYLIE WATER TREATMENT PLANT
Disinfectants
By-Products Collection Date Highest Level Detected Range of Levels Detected MCLG MCL Units Violation Likely Source of Contamination Total Haloacetic Acids (HAA5)* 2023 27.9 13.2-27.9 No goal for the total 60 ppb No By-product
drinking water disinfection. Total Trihalomethanes (TTHM)* 2023 44.2 24.4-44.2 No goal for the total 80 ppb No By-product of drinking water disinfection.
and Disinfection
of
Inorganic Contaminants Collection Date Highest Level Detected Range of Levels Detected MCLG MCL Units Violation Likely Source of Contamination Barium 2023 0.048 0.041-0.048 2 2 ppm No Discharge of drilling wastes; discharge from metal refineries; erosion of natural deposits. Cyanide 2023 199 28-199 0-0 200 ppb No Discharge from steel/metal factories: discharge from plastics and fertilizer factories. Fluoride 2023 0.968 0.537-0.968 4 4 ppm No Erosion of natural deposits; water additive which promotes strong teeth; discharge from fertilizer and aluminum factories. Nitrate (measured as Nitrogen) 2023 0.790 0.067-0.790 10 10 ppm No Runoff from fertilizer use; leaching
septic
sewage; erosion
natural
results
from
tanks;
deposits.
quickly
short periods of time because of rainfall or agricultural activity. If you are caring for an infant you should ask advice from your health care provider. Synthetic organic contaminants including pesticides and herbicides Collection Date Highest Level Detected Range of Levels Detected MCLG MCL Units Violation Likely Source of Contamination Atrazine 2023 0.2 0.10-0.2 3 3 ppb No Runoff from herbicide used on row crops. Simazine 2023 0.12 0.06-0.12 4 4 ppb No Herbicide runoff. Turbidity Limit (Treatment Technique) Level Detected Violation Likely Source of Contamination Highest single measurement 1 NTU 0.73 No Soil runoff. Lowest monthly percentage (%) meeting limit 0.3 NTU 98.0% No Soil runoff.
for
We monitor it because it is a good indicator of water quality and the effectiveness of our filtration. Maximum Residual Disinfectant Level Disinfectant Type Year Average Level of Quarterly Data Lowest Result of Single Sample Highest Result of Single Sample MRDL MRDLG Units Source of Chemical Chlorine Residual (Chloramines)* 2023 2.48 0.78 3.31 4.00 <4.0 ppm Disinfectant used to control microbes. Chlorine Dioxide 2023 0.01 0 0.59 0.80 0.80 ppm Disinfectant Chlorite 2023 0.16 0 0.88 1.00 N/A ppm Disinfectant NOTE: Water providers are required to maintain a minimum chlorine disinfection residual level of 0.5 parts per million (ppm) for systems disinfecting with chloramines and an annual average chlorine disinfection residual level of between 0.5 (ppm) and 4 parts per million (ppm).
The percentage of Total Organic Carbon (TOC) removal was measured each month and the system met all TOC removal requirements set.
Contaminants Collection Date Highest Level Detected Range of Levels Detected Units Likely Source of Contamination Chloroform* 2023 14.3 6.28-14.3 ppb By-product of drinking water disinfection. Bromoform* 2023 2.96 1.36-2.96 ppb By-product of drinking water disinfection. Bromodichloromethane* 2023 16.1 8.68-16.1 ppb By-product of drinking water disinfection. Dibromochloromethane* 2023 12.1 7.1-12.1 ppb By-product of drinking water disinfection.
maximum
disinfection by-products. There is no
data.
Contaminants Collection Date Highest Level Detected Range of Levels Detected Units Likely Source of Contamination Cryptosporidium 2023 0 0-0 (Oo) Cysts/L Human and animal fecal waste. Naturally present in the environment. Giardia 2023 0.18 0.09-0.18 (Oo) Cysts/L Human and animal fecal waste. Naturally present in the environment.
drinking water no Cryptosporidium
Giardia were found in drinking water.
NOTE: Levels detected are for source water, not for
or
Contaminants Collection Date Highest Level Detected Range of Levels Detected Units Likely Source of Contamination Calcium 2023 69.8 26.5-69.8 ppm Abundant naturally occurring element. Chloride 2023 107 30-107 ppm Abundant naturally occurring element; used in water purification; by-product of oil field activity. Iron 2023 0.516 0.061-0.516 ppm Erosion of natural deposits: iron or steel water delivery equipment or facilities. Magnesium 2023 9.77 4.90-9.77 ppm Abundant naturally occurring element. Manganese 2023 0.158 0.0068-0.158 ppm Abundant naturally occurring element. Nickel 2023 0.0048 0.0047-0.0048 ppm Erosion of natural deposits. pH 2023 9.17 6.39-9.17 units Measure of corrosivity of water. Sodium 2023 95.4 26.5-95.4 ppm Erosion of natural deposits; by-product of oil field activity. Sulfate 2023 171 76.8-171 ppm Naturally occurring; common industrial by-product; by-product of oil field activity. Total Alkalinity as CaCO3 2023 139 51-139 ppm Naturally occurring soluble mineral salts. Total Dissolved Solids 2023 492 263-492 ppm Total dissolved mineral constituents in water. Total Hardness as CaCO3 2023 312 82-312 ppm Naturally occurring calcium. Radioactive Contaminants Collection Date Highest Level Detected Range of Levels Detected MCLG MCL Units Violation Likely Source of Contamination Beta/photon emitters 2022 4.7 4.7-4.7 0 50 pCi/L No Decay of natural and man-made deposits.
MCLG Total Coliform Maximum Contaminant Level Highest No. of Positive Coliform or E. Coli Maximum Contaminant Level Violation Likely Source of Contamination 0 1 positive monthly sample 1 0 No Naturally present in the environment.
monthly
no
bacteria that are naturally present in the environment and are used as an indicator that other, potentially harmful bacteria may be present.
tests found
fecal coliform bacteria. Coliforms are
WATER QUALITY DATA FOR YEAR 2023
Coliform Bacteria*
0
Naturally present in the environment.
NOTE: Reported monthly tests found no fecal coliform bacteria. Coliforms are bacteria that are naturally present in the environment and are used as an indicator that other, potentially harmful bacteria may be present.
Regulated Contaminants
and Disinfection
of drinking water disinfection.
of drinking water disinfection.
NOTE: Not all samples results may have been used for calculating the Highest Level Detected because some results may be part of an evaluation to determine where compliance sampling should occur in the future. TCEQ only requires one sample annually for compliance testing.
The percentage of Total Organic Carbon (TOC) removal was
Cryptosporidium and Giardia
NOTE: Bromoform, chloroform, bromodichloromethane, and dibromochloromethane are disinfection by-products. There is no maximum contaminant level for these chemicals at the entry point to distribution. These contaminants are included in the disinfection-by-products TTHM compliance data.
*Samples marked with an asterisk (*) are collected by the City of Allen. Remaining samples are collected by the North Texas Municipal Water District (NTMWD).
MCLG Total Coliform Maximum Contaminant Level Highest No. of Positive Coliform or E. Coli Maximum Contaminant Level Violation Likely Source of Contamination
1 positive monthly sample 1 0 No
Disinfectants
By-Products Collection Date Highest Level Detected Range of Levels Detected MCLG MCL Units Violation Likely Source of Contamination Total Haloacetic Acids (HAA5)* 2023 27.9 13.2-27.9 No goal for the total 60 ppb No By-product
Total Trihalomethanes (TTHM)* 2023 44.2 24.4-44.2 No goal for the total 80 ppb No By-product
Inorganic Contaminants Collection Date Highest Level Detected Range of Levels Detected MCLG MCL Units Violation Likely Source of Contamination Barium 2023 0.044 0.044-0.044 2 2 ppm No Discharge of drilling wastes; discharge from metal refineries; erosion of natural deposits. Cyanide 2023 28.7 28.7-28.7 2 2 ppb No Discharge from steel/metal factories: discharge from plastics and fertilizer factories. Fluoride 2023 0.19 0.19-0.19 4 4 ppm No Erosion of natural deposits; water additive which promotes strong teeth; discharge from fertilizer and aluminum factories. Nitrate (measured as Nitrogen) 2023 0.0555 0.0555- 0.0555 10 10 ppm No Runoff from fertilizer use; leaching from septic tanks; sewage; erosion of natural deposits. Nitrate Advisory: Nitrate in drinking water at levels above 10 ppm is a health risk for infants of less than six months of age. High nitrate levels in drinking water can cause blue baby syndrome. Nitrate levels may rise quickly for short periods of time because of rainfall or agricultural activity. If you are caring for an infant you should ask advice from your health care provider. Synthetic organic contaminants including pesticides and herbicides Collection Date Highest Level Detected Range of Levels Detected MCLG MCL Units Violation Likely Source of Contamination Atrazine 2023 0.2 0.2-0.2 3 3 ppb No Runoff from herbicide used on row crops. Turbidity Limit (Treatment Technique) Level Detected Violation Likely Source of Contamination Highest single measurement 1 NTU 0.25 No Soil runoff. Lowest monthly percentage (%) meeting limit 0.3 NTU 100% No Soil runoff.
Turbidity is a measurement of the cloudiness of the water caused by suspended particles. We monitor it because it is a good indicator of water quality and the effectiveness of our filtration. Maximum Residual Disinfectant Level Disinfectant Type Year Average Level of Quarterly Data Lowest Result of Single Sample Highest Result of Single Sample MRDL MRDLG Units Source of Chemical Chlorine Residual (Chloramines)* 2023 2.48 0.78 3.31 4.00 <4.0 ppm Disinfectant used to control microbes. Chlorine Dioxide 2023 0.02 0 0.58 0.80 0.80 ppm Disinfectant Chlorite 2023 0.17 0 0.81 1.00 N/A ppm Disinfectant
NOTE:
maintain a minimum chlorine disinfection residual level of 0.5 parts per million (ppm) for systems disinfecting with chloramines
annual average chlorine
residual level of between 0.5 (ppm) and 4 parts per million (ppm). Total
NOTE: Water providers are required to
and an
disinfection
Organic Carbon
removal
Unregulated
Contaminants Collection Date Highest Level Detected Range of Levels Detected Units Likely Source of Contamination Chloroform* 2023 14.3 6.28-14.3 ppb By-product of drinking water disinfection. Bromoform* 2023 2.96 1.36-2.96 ppb By-product of drinking water disinfection. Bromodichloromethane* 2023 16.1 8.68-16.1 ppb By-product of drinking water disinfection. Dibromochloromethane* 2023 12.1 7.1-12.1 ppb By-product of drinking water disinfection.
measured each month and the system met all TOC
requirements set.
Contaminants
Secondary and Other Constituents Not Regulated Contaminants Collection Date Highest Level Detected Range of Levels Detected Units Likely Source of Contamination Calcium 2023 51.6 46.8-51.6 ppm Abundant naturally occurring element. Chloride 2023 14.4 10.3-14.4 ppm Abundant naturally occurring element; used in water purification; by-product of oil field activity. Magnesium 2023 2.58 2.58-2.58 ppm Abundant naturally occurring element. Manganese 2023 0.107 0.024-0.107 ppm Abundant naturally occurring element. Nickel 2023 0.0039 0.0039-0.0039 ppm Erosion of natural deposits. pH 2023 8.6 7.6-8.6 units Measure of corrosivity of water. Sodium 2023 34.9 24.2-34.9 ppm Erosion of natural deposits; by-product of oil field activity. Sulfate 2023 81.1 60.4-81.1 ppm Naturally occurring; common industrial by-product; by-product of oil field activity. Total Alkalinity as CaCO3 2023 137 111-137 ppm Naturally occurring soluble mineral salts. Total Dissolved Solids 2023 263 223-263 ppm Total dissolved mineral constituents in water. Total Hardness as CaCO3 2023 138 104-138 ppm Naturally occurring calcium. Radioactive Contaminants Collection Date Highest Level Detected Range of Levels Detected MCLG MCL Units Violation Likely Source of Contamination Beta/photon emitters 2023 4.1 4.1-4.1 0 50 pCi/L No Decay of natural and man-made deposits.
LEONARD WATER TREATMENT PLANT
Contaminants Collection Date Highest Level Detected Range of Levels Detected Units Likely Source of Contamination Cryptosporidium 2023 0 0-0 (Oo) Cysts/L Human and animal fecal waste. Naturally present in the environment. Giardia 2023 0 0-0 (Oo) Cysts/L Human and animal fecal waste. Naturally present in the environment.
WATER QUALITY DATA FOR YEAR 2023
Lead and Copper
Corrosion of household plumbing systems; erosion of natural deposits. Copper*
Erosion of natural deposits; leaching from wood preservatives; corrosion of household plumbing systems.
ADDITIONAL HEALTH INFORMATION FOR LEAD: If present, elevated levels of lead can cause serious health problems, especially for pregnant women and young children. Lead in drinking water is primarily from materials and components associated with service lines and home plumbing. Allen is responsible for providing high quality drinking water, but cannot control the variety of materials used in plumbing components. When your water has been sitting for several hours, you can minimize the potential for lead exposure by flushing your tap for 30 seconds to 2 minutes before using water for drinking or cooking. If you are concerned about lead in your water, you may wish to have your water tested. Information on lead in drinking water, testing methods, and steps you can take to minimize exposure is available from the Safe Drinking Water Hotline or at http://www.epa.gov/safewater/lead
*Samples collected by the City of Allen Unregulated Contaminant Monitoring (UCMR) Period 5
NOTE: PFBA, PFPeA, PFBS, and PFHxA are
GLOSSARY TERMS TO KNOW
The charts in this Water Quality Report list the contaminants detected in Allen drinking water during calendar year 2023. Numerous tests detected no other contaminants. Listed below are the definitions for abbreviations on the adjoining page. As noted, the water quality surpasses standards for each contaminant as required by law. For additional information, please contact the Allen Water Utilities Department at 214.509.4502.
Maximum Contaminant Level (MCL) is the highest permissible level of a contaminant in drinking water. MCLs are set as close to the MCLGs as feasible using the best available treatment technology.
Maximum Contaminant Level Goal (MCLG) is the level of a contaminant in drinking water below which there is no known or expected health risk. MCLGs allow for margin of safety.
Maximum Residual Disinfectant Level (MRDL) is the highest level of a disinfectant allowed in drinking water. There is convincing evidence that addition of a disinfectant is necessary for control of microbial contaminants.
Maximum Residual Disinfectant Level Goal (MRDLG) is the level of a drinking water disinfectant below which there is no known or expected risk to health. MRDLGs do not reflect the benefits of the use of disinfectants to control microbial contaminants.
Action Level (AL) is the concentration of a contaminant which, if exceeded, triggers treatment or other requirement which a water system must follow.
ppm stands for “parts per million”-or one ounce in 7,350 gallons of water.
ppb stands for “parts per billion” - or one ounce in 7,350,000 gallons of water.
ppt stands for “parts per trillion”- or one ounce in 7,500,000,000 gallons of water
pCi/L stands for picocuries per liter. A measure of radioactivity.
NTU stands for Nephelometric Turbidity Units. This is the unit to measure water turbidity.
Turbidity is a measure of water’s clarity. Turbidity has no health effects. However, turbidity can interfere with disinfection and provide a medium for microbial growth. Water with lower turbidity is clearer than water with higher turbidity.
THM is the abbreviation for trihalomethanes, a by-product of disinfection of water. Some people who drink water containing trihalomethanes in excess of the MCL over many years may experience problems with their liver, kidneys, or central nervous system, and may have an increased risk of getting cancer.
HAA stands for haloacedic acid, a by-product of disinfection.
TOC is the abbreviation for total organic carbon. MRL is the abbreviation for minimum reporting level.
TTHM Total Trihalmethanes
Analyte is a substance whose chemical constituents are being identified and measured.
Lead and Copper Date Sampled Action Level (AL) 90th Percentile # Sites Over AL Units Violation Likely Source of Contamination Lead* 2023 15 2 0 ppb No
2023 1.30 0.8 1 ppm No
Analyte Collection Date MRL Average Level Detected Range of Levels Detected Units Likely Source of Contamination PFBA 2023 4.84 7.95 7.3-9.3 ppt PFAS manufacturing and processing facilities, airports, f iref ighting foam. PFPeA 2023 2.9 6.81 5.3-8.1 ppt PFAS manufacturing and processing facilities, airports, f iref ighting foam. PFBS 2023 2.9 3.96 3.6-4.6 ppt PFAS manufacturing and processing facilities, airports, f iref ighting foam. PFHxA 2023 2.9 6.76 5.8-7.4 ppt PFAS manufacturing and processing facilities, airports, f iref ighting foam.
four contaminants tested for during UCMR5. For more information on UCMR5, please visit https://www.epa.gov/dwucmr/fifth-unregulated-
contaminant-monitoring-rule or CityofAllen.org/WaterQuality
(CONTINUED)
RESOURCES FOR SMART WATER USE
Resources are available to learn about smart water use, request a sprinkler evaluation or watering variance, or apply for a rebate on the water-efficient technology you're using at home. For more information, visit CityofAllen.org/WaterConservation.
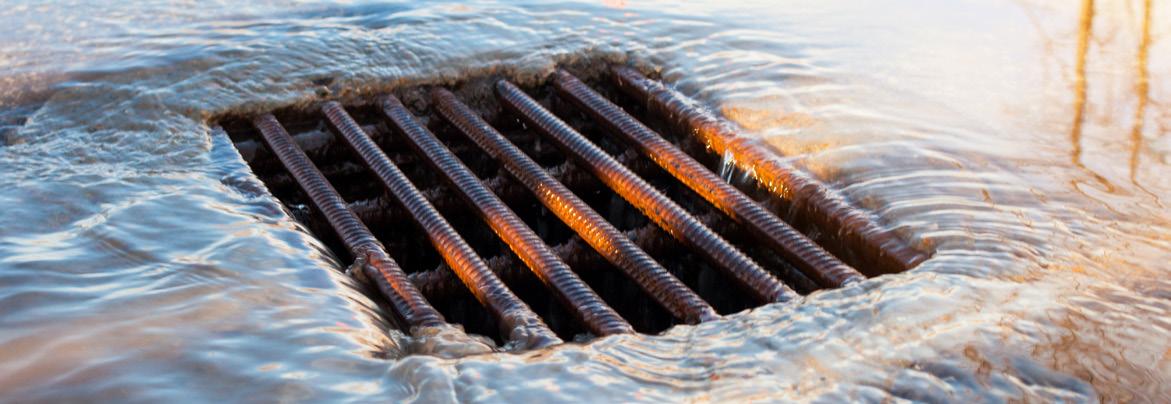
PROTECT STORM WATER
Did you know that runoff and debris collected in storm drains goes directly to local ponds and lakes? Avoid violations and protect local wildlife by keeping these materials out of storm drains:
• Leaves/grass clippings
• Auto fluids and household chemicals
• Pet waste
• Fats, oils and grease
LEARN MORE: CityofAllen.org/StormWater
WATER REBATES
The City of Allen wants to help residents conserve water!
You may be eligible for credits on your water bill if you take advantage of certain watersaving home improvements through the H2Ome Improvement Rebate Program.
Rebates are for residential use only. Applicants must own and live in the home to qualify.
LEARN MORE: CityofAllen.org/WaterRebates

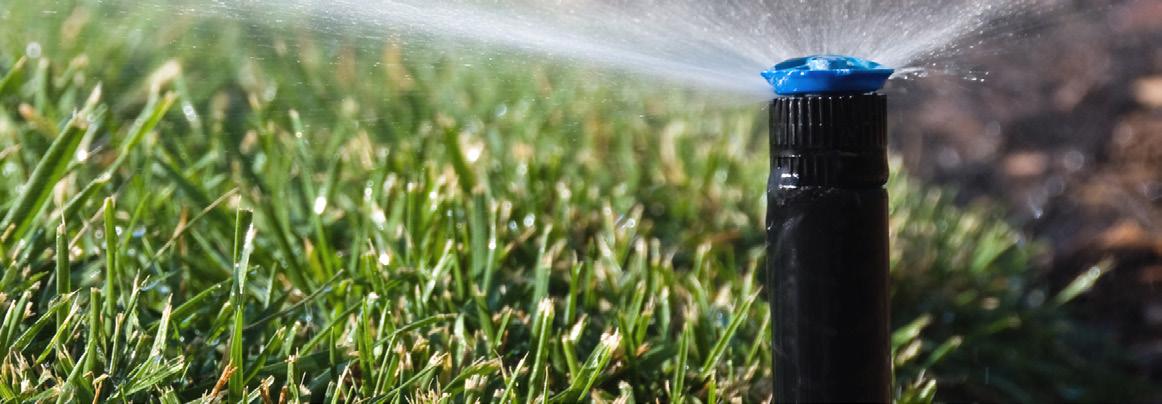
WATERING SCHEDULE SMART WATER METERS
Do you know your watering day and schedule?
Allen water utility customers may use sprinklers or irrigation systems on assigned watering days, as needed and depending on the season during the year.
MORE: CityofAllen.org/WateringDay
Every home in Allen has access to better insights into their water usage with the WaterSmart customer portal. Track near-real time data to see current usage, leak alerts and estimate monthly bills based on current usage.
CityofAllen.org/SmartMeters
PUBLIC INPUT OPPORTUNITIES
Allen water utilities are part of the Community Services Department of the Allen City Government. The Allen City Council meets the second and fourth Tuesdays of every month at 7 p.m. at Allen City Hall.
ATTEND A MEETING
305 Century Parkway Allen, TX 75013
EMAIL US coa@cityofallen.org VISIT US ONLINE CityofAllen.org
LEARN MORE:
LEARN
H2OME IMPROVEMENTS REBATE PROGRAM
