Future Flood Plains 2020 Future Flood Plains 2020 and 2050
Location
Staten Island is a borough of New York City, coextensive with Richmond County, in the U.S. state of New York. Lo cated in the southwest portion of the city, the borough is separated from New Jersey by the Arthur Kill and the Kill Van Kull and from the rest of New York by New York Bay.
Climate Zone 4a is a mixed - humid climate, it means the region recieves more than


or fewer and average
below
of annual precipitation, has approx, 5400 heating degree days

F during the winter

FLOOD
The borough of Staten Island is a home to the highest point of elevation on the eastern shore of the United Staes because of which it faces a significant risk of flooding. Staten Island itself consists of five different flood zones: Zone A, Zone AE, Zone VE, the shaded Zone X, and the unshaded Zone X. Of these zones, Zones A, AE, and VE are areas of high flood risk. The X Zones have a moderate to low risk. 90 Bay St falls in Zone A.
The borough of Staten Island is a home to the highest point of elevation on the eastern shore of the United Staes because of which it faces a significant risk of flooding. Staten Island itself consists of five different flood zones: Zone A, Zone AE, Zone VE, the shaded Zone X, and the unshaded Zone X. Of these zones, Zones A, AE, and VE are areas of high flood risk. The X Zones have a moderate to low risk. 90 Bay St falls in Zone A.


SITE
VEGETATION ON SITE
The Site is surrounded by a mix of Residential and Com mercial buildings within 5 mile radius. This will help to map different sound intensities from the area. Adjacent to site is a Railway Line which creates a lot of Noise Pollution.


January
June
December
I have attached these wind rose diagrams of 5 motnhs as they showd drastic change in the wind direction and temperature. From January to April cold winds( 32 F -69F) are flowing from SW and NE directions. In May , June and July there is a shift of tem perature from cold to moderature temperature( 69 F-81 F) and wind also flows from NW and SW direction. From July to October temp and direction are almost the same. In December extremly cold wind( <32 F) starts flowing from the NE and NW.


Material
Wall assembly which has a total R value of 27.9, con sists of 1/2 in gypsum board, 4 in fibreglass insulation, 2 in extruded polystyrene, 1 in air cavity and 3/4 in wood bevel siding.

Extruded Polystyrene insulation is efficient is resisting moisture absorption and when installed in walls, it shifts damaging dewpoints, which help to minimise the potential for condensation to occur within. This prevents degradation over time due to moisture intrusion, which helps in keeping its energy efficient properties intact.
Thermal bridging is the major source of energy loss in buildings leading to higher utility bills.. It occurs when a more conductive material act as a medium for heat loss across a thermal barrier.


To prevent thermal bridging from happening I have used continuos Extruded polystyrene .
Some of the other solutions include to properly seal the floor-wall, wall-wall, window-wall junctions, avod ing or properly sealing recessed lights that penetrate insulateed ceilings.
Cove Tool baseline requiremnets for U value was 0.36 BTU/h ft² F and SHGC was also 0.36 BTU/h ft² F. But in Cove tool putting U value as 0.28 BTU/h ft² F and SHGC as 0.4 BTU/h ft² F led to decrease in EUI value by 2. This selection minimize summer sun heating gain which led to decrease in 1.2 EUI , 0.07 decrease in cooling and 1 EUI decrease in heating load.


The baseline for Window to Wall Ratio was 40 % for all four sides of the building. For the optimization I reduced WWR to 30 % on East and West facade to reduce the amount of harsh sunlight en tering the building. This led to decrease in 1 EUI. I tried to increase glazing on the South facade for passive heating but that led to 5 EUI increase. Maybe creating a projection to block summer sun and then increase south glazing will be a more efficient option.
Installed EPD = Total installed Watts / sq.ft
Installed EPD = 14940 Watts / 1000 sq.ft = 14.94 W/sq.ft

Operating EPD = [Operating load (kWh/yr)]*[1000 w/kW] / (8763 hrs * Area sq.ft )
Operating EPD = (4438.72 x 1000) /(8763 x 1000) = 0.51 W/sq.ft
Unoccupied EPD = [Phantom load (kWh/yr)]*[1000 w/kW] / (8763 hrs * Area sq.ft )
Unoccupied EPD = ( 509.7 x 1000) /( 8763 x 1000) = 0.058 W/sq.ft
Daylight sensors are changed from sensorx -100 % to partial sensors - 50 % as 100% sensors is not very commonly seen in residential, also it will increase the cost.
Lighting Power Density -


Total Watts per sq.ft = 0.195+0.312+0.26+0.156 = 0.923 Watts per sq.ft ( Bathroom and living area are not included)
Average Watts per sq.ft = 0.923/4 = 0.23 Watts per sq.ft
Taking 10% off from this value to account for control stratergies. 10 % off 0.23 =0.21 Watts per sq.ft
The lighting level is based on the task being performed within the space. Category C is for working spaces where visual tasks are only occasionally performed, Category D is for performance of visual taks of high contrats or large size and Category E is for performance of visual tasks of medium contrast or small size.

Baseline Optimized

After optimizing the building envelope it resulted in 6.08 de crease in EUI. Heating load was decreased by 6.62 EUI and Cool ing load was decreased by 1.66 EUI. Cooling load is decreased as I will be using external blinds during the summer to block out the sun which will result in less heating up of the internal space. During winter I will open the blinds to allow the sun to enter the building to passively heat it which will result in low heating load.
Heating System and Cooling system COP(3.7 and 5.2) is higher than the system DOAS w/ WSHP(0.82 and 4) with Gas Boiler and Cooling Tower. COP is defined as the relationship between the power (kW) that is drawn out of the heat pump as cooling or heat, and the power (kW) that is supplied to the compressor. A high COP value represents a high efficiency.
DC System Size(kW) = 529.6 is just for the roof which is generat ing 717810 kWh/Yr. After putting that value in the Cove tool, EUI reduced to 4.34. So to further reduce the EUI, I am using Photo voltaic Facades on East and West side of the building. I have also used SWH to reduce the Domestic Hot Water Demand, which resulted in decrease in EUI by 6.47 EUI.


From the Psychromteric chart it is clear that out of 8760 hours per year only 939 hours fall in the comfort zone category. Major importance should be given to reduce the solar heat gain from the sun as the building is east-west oriented, that means the larger face of the building will be directly exposed to harsh sunlight throughout the day.

Another important factor while designing the space would be humidity, as there will be relatively high level of humidity as the site is close to the coast. Other than using active design stratergies like using HVAC, fans, controlling air speed, maintaining relative humidity inside the space, pas sive design stratergies should also be considered.
HEATING, VENTILATION, AIR CONDITIONING CALCULATION


A dedicated outdoor air system (DOAS) is a unit supplying cooled, dehumidified outside air to the building in summer and heated outside air in the winter.

Advantages of DOAS are
• They improve indoor air quality by removing contaminants from outdoor air before channel ing it into a building.
People Outdoor Air Rate(CFM/person) was changed from 5 to 12.5 and Area Outdoor Rate (CFM/ft2) was changed from 0.06 to .18. People OA = 5+7.5 = 12.5 and Outdoor OA = 0.06+0.12= 0.18
• DOAS units are effective dehumidifiers, and they help prevent moisture-related problems like sick building syndrome and mold growth.
• Decoupling ventilation from air heating and cooling can also lead to energy savings.


• Enhanced indoor environmental quality ( IEQ)
• They come in variety, so designers have more freedom when selecting local units.
Ground source heat pumps, also known as geothermal heat pumps, are highly effective space heating and cooling technologies that extract heat from the ground.

The ground source heat pumps are literally pumping heat from the ground into a space, often someone’s home. Heat can be extracted from any temperature, no matter how cold, however hotter temperatures result in better performance.
A main benefit of these systems is that they make use of already available heat that is stored with in the Earth, so the heating or cooling for a home does not need to use natural gas or electrical heating.
To discover the repercussions of human alteration on the hydrological cycle of the site.
To discover new aspects of the water cycle, both natural and artificial
Green roofs allow for more water to be immediately filtered during collection as well as increasing the amount of evapotranspira tion. During a rain event, water is filtered using the green roof soil mixture to separate larger objects before passing through a more fine filtration screen.

- Before settlement the water cycle was a bit more simple when compared to to day’s water cycle.
- For a 40” Stormwater calculation, there would be about 29,978,333 Gal/Year of water on the 27.6 acre site.
- 43% becomes ground infiltration
- 10% becomes runoff
- 47% turns into evaporation or evapo transpiration
Once collected, the water passes through a UV light to disinfect it of any bacteria. Because such a large amount is collected, we can utilize gravity to power small hydroelectric turbines within the pipe to add to the buidlings energy grid, reducing their reliance on other forms of energy.
- The roofs onsite are assumed to be storm water drained and evaporation (75%R -25%E)
- The exception is the sloped roof on Pillsbury, assuming that all water is shed and added to the groundwater calculation

- Hardscape Characteristics:
- Concrete makes up 84% of the site’s hardscapes and has a ratio of 80%R -20%E
- Asphalt makes up 15% of the site’s hardscapes and has a ratio of 70%R-30%E
- Brick makes up 1% of the sites hardscapes and had a ratio of 75%R -25%E
- For these hardscape calculations, we had to assume that all water that ran off went directly to the storm sewer as there isn’t an accurate metric that deter mines the amount of runoff onto greenscapes.
PERVIOUS AND IMPERVIOUS AREA ON SITE
Orignal Site
Having green roof helps to decrease the impervious area. It slows down the stormwater runoff rate for the area

Urban Land- Udipsam ments (cut and fill land)

Complex, 0-2 % slopes
Area: 2440508.5 sq.ft

Percentage: 100 %
Some Urban land exeption: lawns, green roof, rain garden area
Impervious Paving
Buildings with drainage at the corner/top of the roof
Hydrological Soil Group A Hydrological Soil Group N/A Hydrological Soil Group N/A

Area: 559724.953 sq.ft
Percentage: 29.62 %
Run off coefficient : 0.12
Area: 1095530.5 sq.ft
Percentage: 39.13 %
Run off coefficient : 0.70
- The remaining parcels of land have a soil hydrological classification ‘A’ - infiltration of .8 inches per hour
- The major changes in the runoff/infiltration/evap are caused by an increase in hardscapes, creating runoff, and decrease in vegetation, less evaporation and evapotranspiration.
- A common side effect, unfortunately, of the human creation of structure.
- Desertification in particular. When capping off the landscape, infiltration is prevented which dries the soil and low ers the water table. This has negative effects on the nutrients and biological life within the soil ecosystem.
- This also leads to a simplification of the environment where the variety of species has decreased and has been replaced with a lot of turf grass.
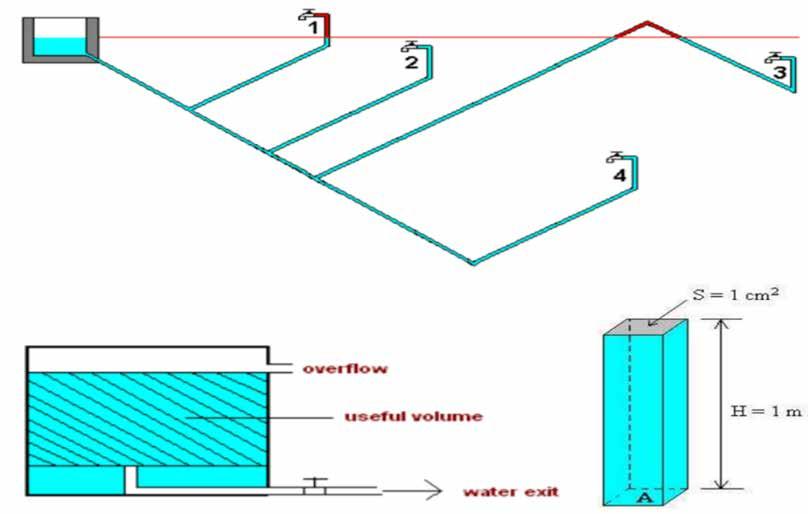
GRAVITY-FED RECLAIMED WATER SYSTEM
Tap1: water does not run out because the tap is on a higher level than water level in the tank.
Tap2: water runs out from the tap but with low pressure (i.e. low power) because the tap is close to water level in tank.
Tap3: water does not run out because part of the pipes is found in the top of water level in the tank.
Tap4: water runs out from the tap with a good pressure
For a 7.5” rain event, you can expect the following gallons collected from each building roof, excluding evaporation:

Ford: 49,488 Gal (4%) Vincent/Murphy: 98,977 Gal (8%)

Morrill: 49,488 Gal (4%) Nolte: 37,116 Gal (3%)
Bell: 86,605 Gal (7%) Rapson: 173,210 Gal (14%)

Lind: 74,233 Gal (6%) Armory: 98,977 Gal (8%)
Tate: 136,094 Gal (11%) Amundson: 98,977 Gal (8%)
Mechanical Engineering: 334,052 Gal (27%)
Total water: 5,620,937 Gal
Building Catchment: 1,237,217 Gal (Excluding runoff from the Armory and Pillsbury.)
Area: 785253.05sq.ft
Percentage: 31.25 %
Run off coefficient : 0.71
FLUSH FIXTURE DATA

Interior Perspective
- Treated rainwater falls to create a wall of water that you can touch.
- Water is filtered, exposed to the sun, and treated to UV light to purify it.
- The addition of a green wall allows a biofilic connection with the inhabitants.


- The green wall will also help regulate humidity by both absorbing and transpiring mois ture in the air.
- A portion of the collected rainwater goes towards watering the plants.
- Replaced building fixtures with low flow, high efficiency fixture to reduce water consumption
- Capture and redirect rainfall
- Treat through filtration and UV light to remove particles and kill bacteria.
- Natural percolation through filtration layering systems.

- UV Lights kills bacteria and other living organisms in the water.
- Catchment amount is greater than that of the building demand and the rest is sent into the storm sewer.


- Redirect/Reuse grey water for irrigation.

- Reduced the overall water usage by 51%


- Ability to replace all potable water demand with treated rain fall, outside of data for drinking fountains excluded in this.
By pumping the collected rainwater through roof mounted pipes, you are able to simultaneously heat the water and disinfect it using the natural heat of the sun itself.


