
4 minute read
CMS Actuary Details 2018 National Health Expenditures


Jonathan M. Gold, JD, AMRPA Director of Government Relations & Regulatory Counsel
Highlights: » Hospital Spending Remains Biggest Outlier Across all Payers » Overall Medicare Spending Rises 6.4%
26 AMRPA Magazine / February 2020 Late last year, the Centers for Medicare and Medicaid Services (CMS) Office of the Actuary (OA) released its annual report on National Health Expenditures. The report details overall expenditures by providers and payers, and offers comparisons in growth to prior years. This article will cover some highlights from the report.
Overall total spending increased 4.6% in 2018 compared to 2017 according to the OA. This brought total national spending to $3.6 trillion, with per capita spending of $11,172 per person. The growth rate was faster than 2017, when spending rose only 4.2% over the previous year. The OA attributed the increased growth to a private health insurance tax put in place by the Affordable Care Act (ACA), which was reinstated in 2018. However, when compared to gross domestic product (GDP), health care spending actually dropped from 17.9% of GDP in 2017 to 17.7% in 2018.
Hospital spending remained the leading type of health care spending in 2018, making up 33%, or $1.2 trillion, of the total spending for the year. Hospital spending growth was nearly on par with overall growth, rising 4.5% over 2017 levels. The OA stated that it observed high rates of growth in hospital prices in 2018, but some reduction in utilization during the year as well. Medicare spending growth on hospital care also remained steady, rising 4.6% compared to 2017.
The second largest type of spending after hospital care was physician and other clinical services, which totaled $725.6 billion in 2018. The growth rate for 2018 was 4.1%, lower than the 4.7% growth seen in 2017. OA attributed the slowdown in spending growth to utilization declines, and not to a slowdown in price increases. Medicare spending growth was higher for physician and clinical services, growing at a rate of 7.8% in 2018. This is notably higher than the 5.9% and 3.3% growth for Medicare seen in 2017 and 2016, respectively.
Nursing facility and care in retirement communities made up 5% of total spending in 2018 for a total of $168 billion. The 1.4% growth seen in 2018 was lower than the 2% rate for 2017. Medicare spending growth on nursing facility and related care was lower than the national average, rising 1.6% in 2018. However, Medicare spending growth was still higher than 2017, when the OA reported a 1% increase in spending for nursing facility and care in retirement communities.
Home health care was 3% of total national spending in 2018, totaling $102 billion. The growth rate for 2018 was 5.2%, notably higher than the 4.5% increase in 2017. Medicare spending growth on home health care was even higher, rising 5.6% in 2018, compared to only 3.2% in 2017.
Spending on what the OA categorized as “Other Professional Services,” which includes non-physician practitioners such as physical and occupational therapists, also made up 3% of total spending in 2018. The total spending in this category was $103 billion nationally, which was an increase of 6.5% from 2017. Medicare spending growth was also higher in the category, rising 10.5% in 2018, compared to 9.6% growth in 2017.
Prescription drugs made up 9% of total national spending in 2018, totaling $335 billion. This reflects a 2.5% growth in spending over 2017, compared to 1.4% growth from 2016 to 2017. The OA noted that overall retail drug prices dropped by 1% in 2018, so the overall increase in spending was attributable to utilization increases. Medicare spending growth on prescription drugs rose at a faster rate of 5.9% in 2018, also higher than the 4.8% growth rate for 2017.
Among payers, private health insurance was the biggest spender in 2018, accounting for $1.2 trillion nationally. This was an increase of 5.8%, and accounted for 34% of all spending. The OA attributed this increase to the reinstatement of the ACA health insurance tax. On a per enrollee basis, private health insurance spending increased 6.7% over 2017. Medicare spending saw an even higher growth rate of 6.4% in 2018, and on a per enrollee basis growth rate of 3.7%. The OA attributed the growth in Medicare spending to Part C and Part D plans raising premiums due to the ACA health insurance tax. In total, Medicare made up 21% of all spending by payer, for a total of $750 billion in 2018. Medicaid and consumer out of pocket payments were the next two biggest sources of funding, making up 16% and 10% of total funding for 2018, respectively.
More information and detailed data is available at: www.cms.gov/Research-Statistics-Data-and-Systems/ Statistics-Trends-and-Reports/NationalHealthExpendData/ NationalHealthAccountsHistorical
1 Includes Noncommercial Research and Structures and Equipment. 2 Includes expenditures for residential care facilities, ambulance providers, medical care delivered in non-traditional settings (such as community centers, senior citizens centers, schools, and military field stations), and expenditures for Home and Community Waiver programs under Medicaid. Note: Sum of pieces may not equal 100% due to rounding.

1 Includes worksite health care other private revenues, Indian Health Service, workers' compensation, general assistance, maternal and child health, vocational rehabilitaiton, Substance Abuse and Mental Health Services Administration, school health, and other federal and state local programs. 2 Includes co-payments, deductibles, and any amounts not covered by health insurance. Note: Sum of pieces may not equal 100% due to rounding.
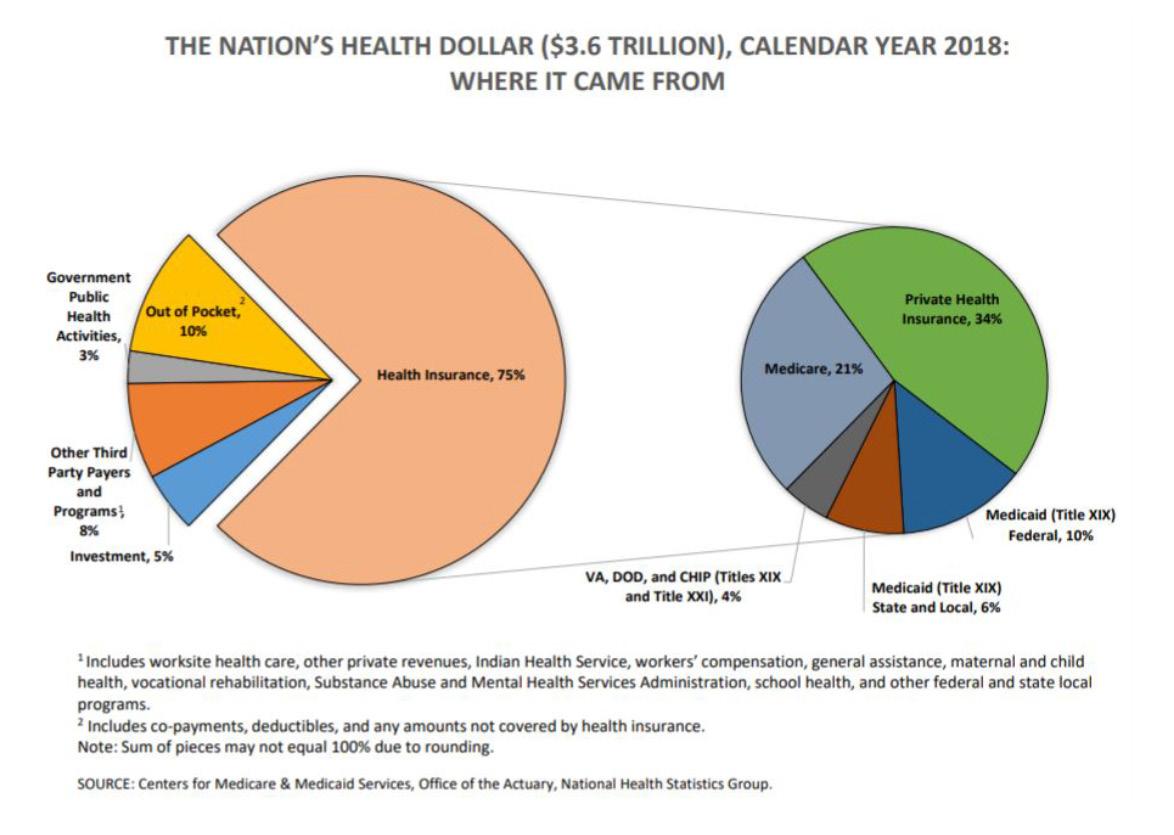
SOURCE: Centers for Medicare & Medicaid Services, Office of the Actuary, National Health Statistics Group.


