1.
PORTFOLIO ANDREW YU 2020-2024
CONTENTS
[1] MACHINE INEFFICIENCY
Anachronistic Dim Sum // Salton Sea, California
Princeton University School of Architecture
Professor Jesse Reiser
[2] CLIMATE HAVEN: DETROIT
A Projective Approach to Climate Change // Detroit, Michigan
Syracuse University School of Architecture Professor David Shanks, Yutaka Sho, and Nina Sharifi
[3] TRENTON ISLES BARN
Collaborative Barn Raising // Trenton, New Jersey
Princeton University School of Architecture Professor Erin Besler
[4] RE:HAVEN
Revitalizing Mott Haven // Mott Haven, New York Syracuse University Fisher Center Professor Angela Co
[5] BORGO DIGITALE
Schoolhouse Collective // Castiglione d’Orcia, Italy
Syracuse University Florence Study Abroad Program Professor Daniele Profeta
[6] A BOWL OF NUCLEAR SOBA
Embracing Contradictions // Inujima, Japan
Princeton University School of Architectuer Professor Jesse Reiser
[7] ENSEMBLE THEATRE
Renegotiating the Theatre // Auburn, New York
Syracuse University School of Architecture
Professor Terrance Goode
[8] VAULTING WALLS
Brick Computational Fabrication // Princeton, New Jersey
Princeton University School of Architecture
Professor Arash Adel
[9] INTERNSHIP EXPERIENCE
Dallas, TX | Shanghai, China | New York City, NY
Intern at Numerous Firms
2.
Anachronistic Dim Sum Spring 2024
Type: Urban Design / Farm-To-Table Restaurant
Location: Salton Sea, California
Category: Academic Work
Instructor: Jesse Reiser
Role: Individual Work Machine Inefficiency

Machinic efficiency reduces the human role in production by lowering energy expenditure in favor of productivity within a process. This thesis challenges the notion of engineered efficiency by “architectural-izing” the machine and its byproducts to create a series of happenings that merge industrial processes with human rituals. Sited in the man–made accident that is the Salton Sea, this thesis approaches crisis, not through resolution, but rather by redistributing the existing site conditions.
[1] 3.
Machine Inefficiency
Equilibrium is not Static // Salton Sea, California
This thesis is sited in the Salton Sea, a man-made body of water 35 miles in length and 15 miles in width that was accidentally created when the canals that irrigated the Imperial Valley burst. While the Salton Sea was once a desert, after it flooded, it became a terminal lake because it had no evident outlet. This condition proved to be detrimental in the long-term because the Salton Sea, fed by the outflow of the Imperial valley, became the final destination for salt and pesticides. Whereas in the mid twentieth century, the sea hosted a new ecology and became a tourist destination, by the seventies the saline proved to be fatal to fish and the sea started to have an odor. Furthermore, because of the strict water restrictions, the outflow of the Colorado river was redirected to cities in California such that the Salton Sea began to evaporate at a rate faster than it could be replenished. The sea is problematic because if it were drained or flooded, this would only exacerbate issues already present in the area. While solutions have been discussed for decades, the state of California remains at a stand still. This notion of resolution is, however, always conceptualized as a means to an end. Whereas equilibrium is often misconceptualized as a moment of stasis, it is in actuality a state of constant contention, requiring precise forces to counterbalance one another. Machine Inefficiency proposes an inherently inefficient water desalination plant that removes salt from the sea at the same rate that the sea receives salinated water to keep the sea in its perpetual state; a state of equilibrium. In its preservation, opportunities for human ritual can arise.

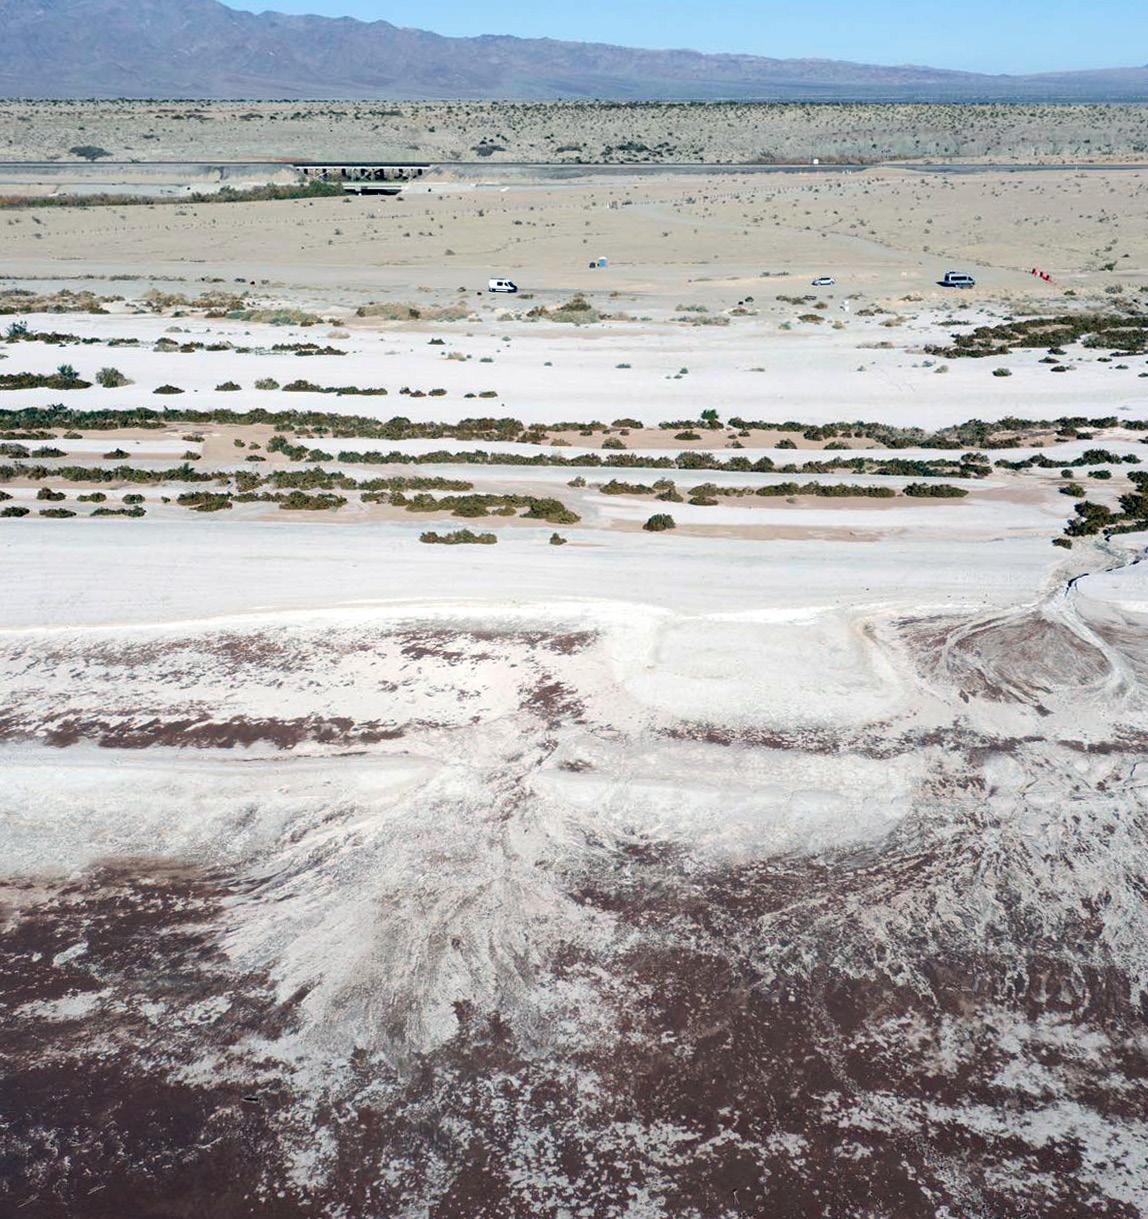

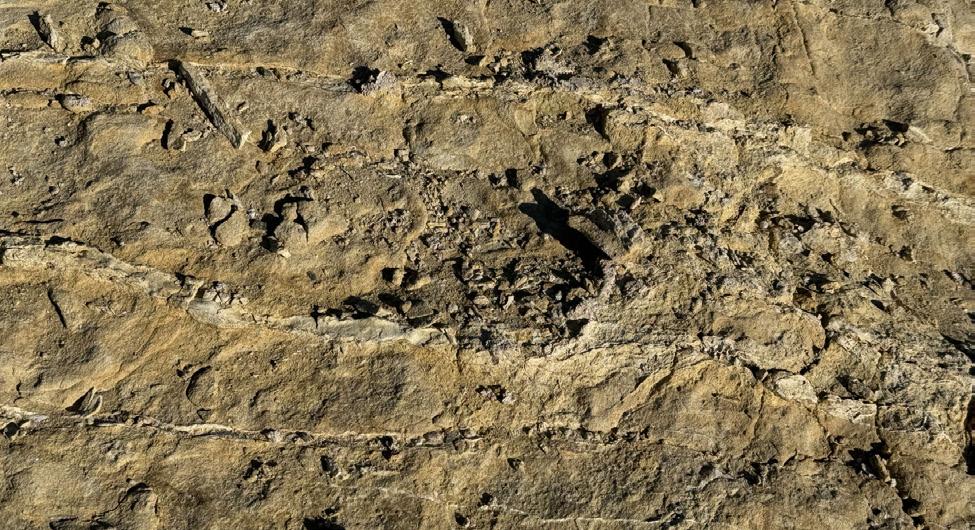

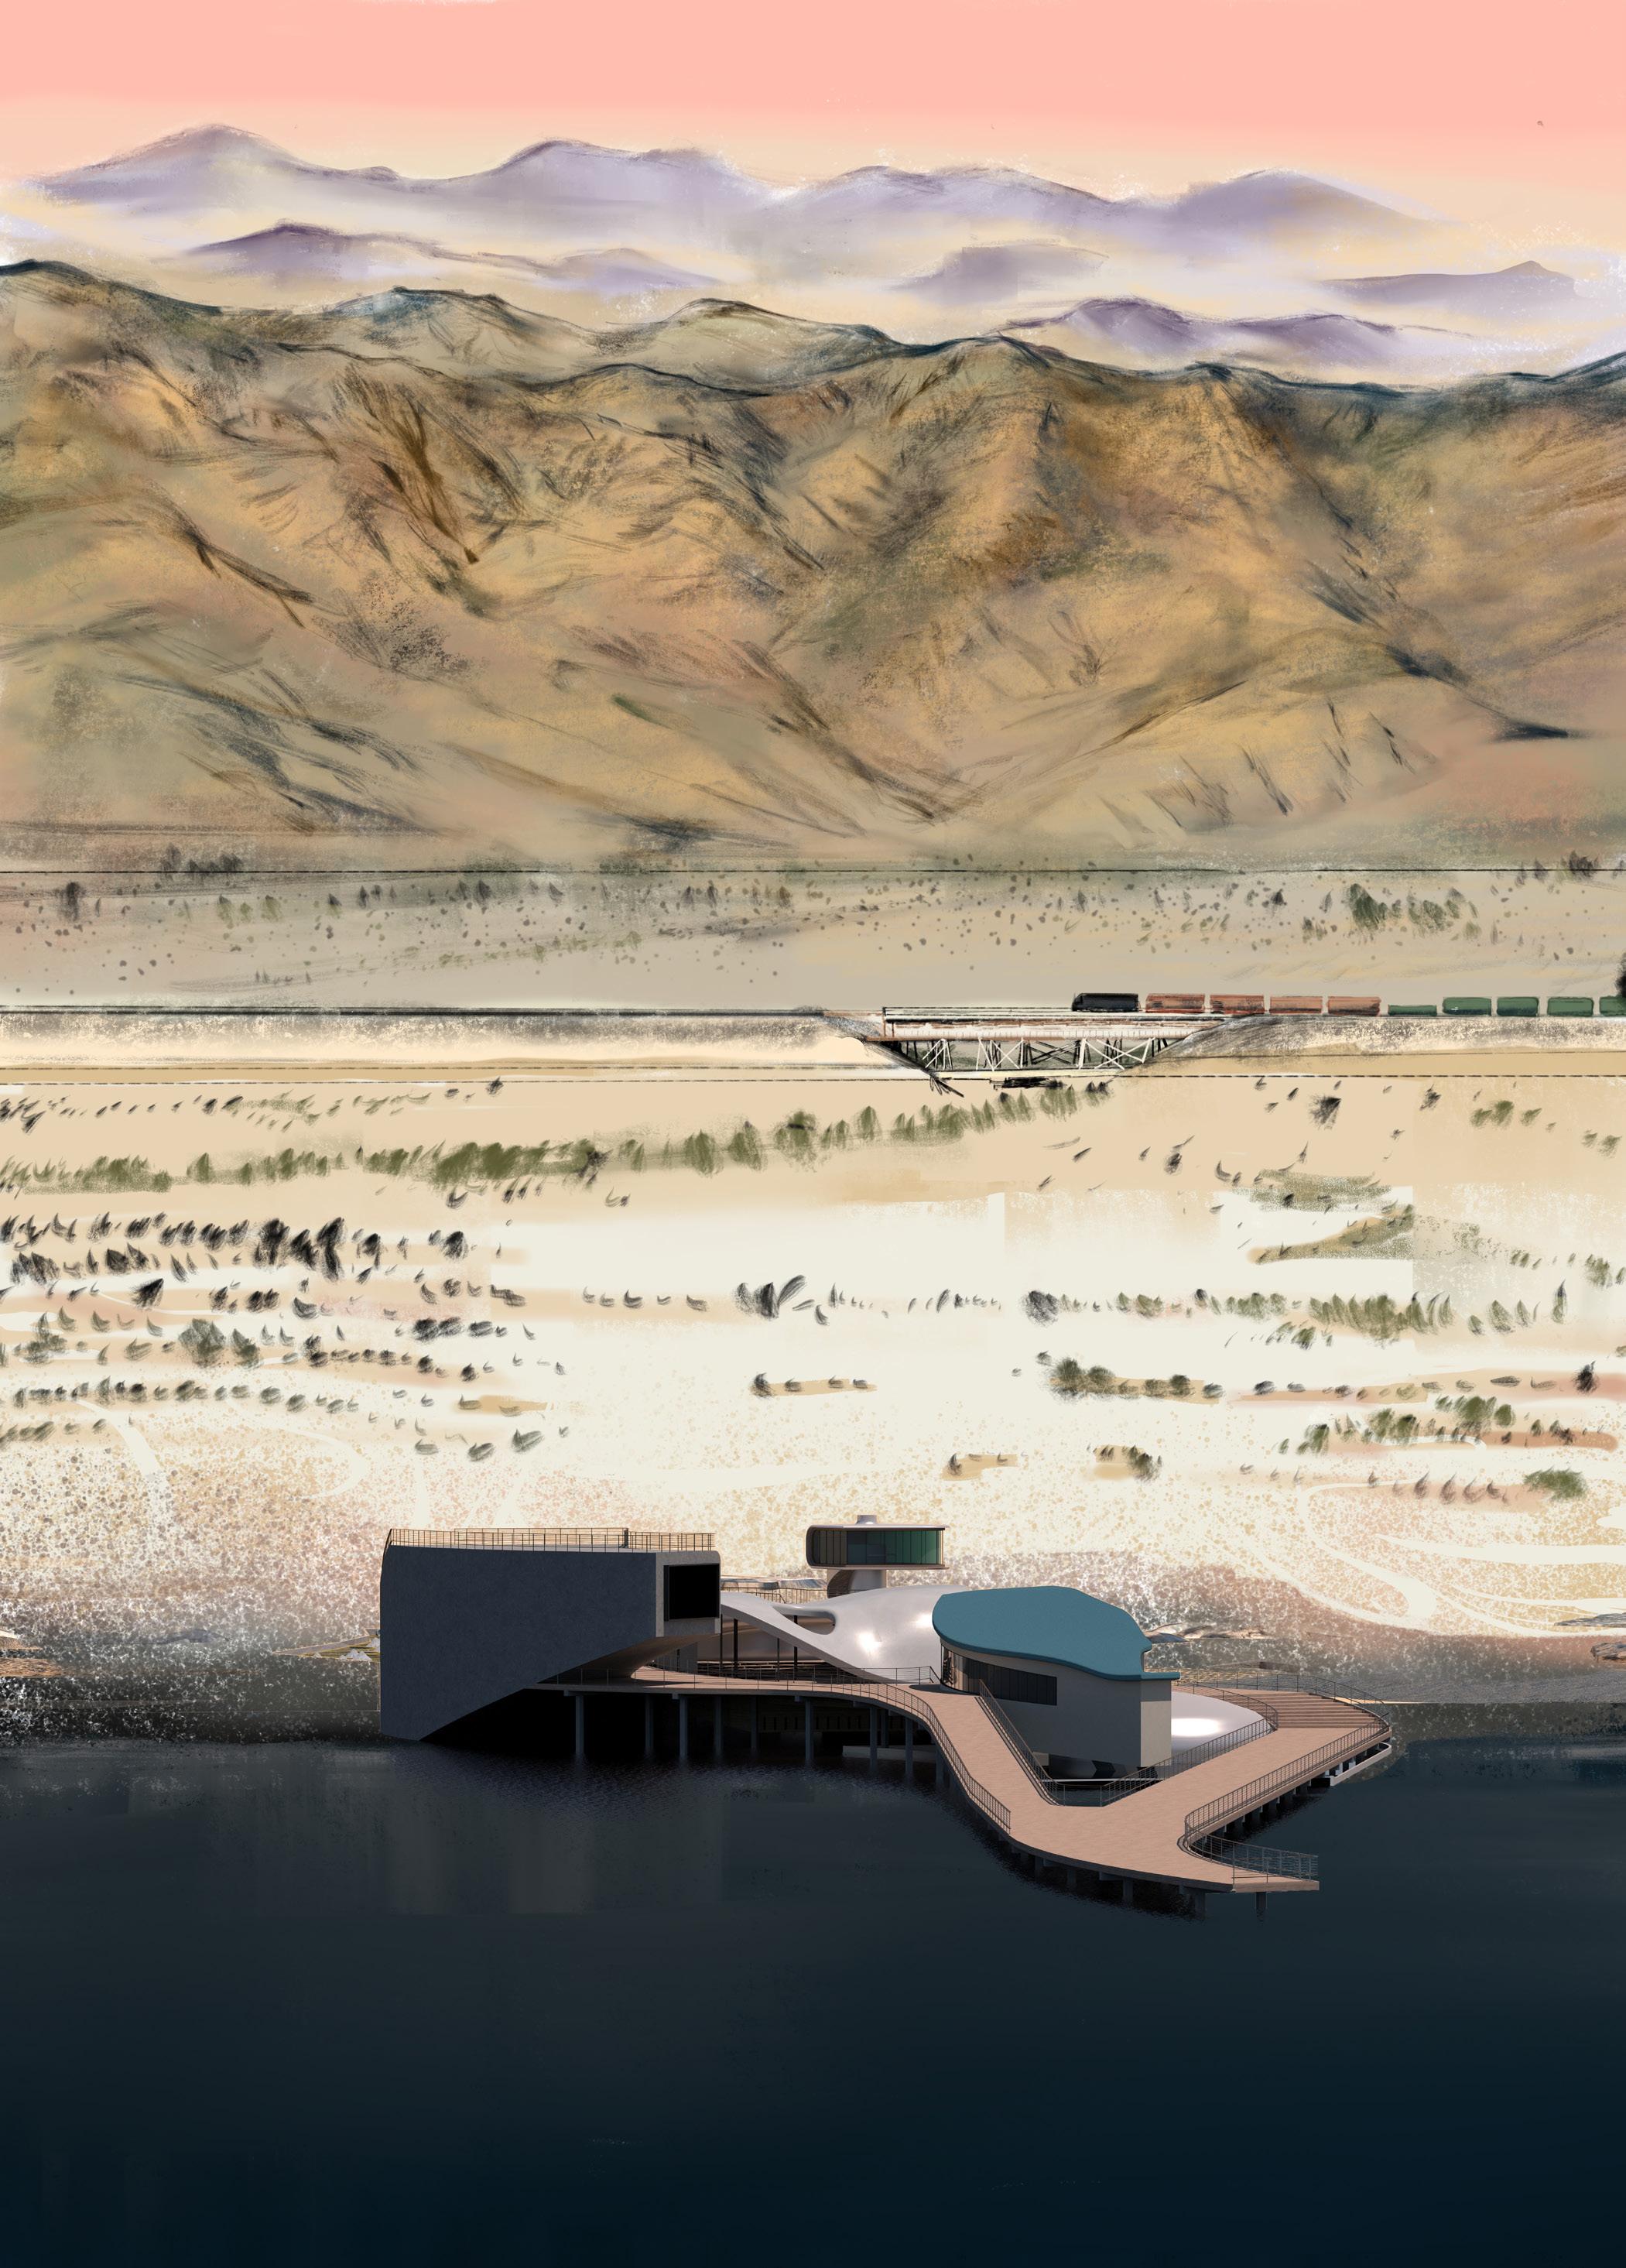 The Inefficient Machine from Beyond the Salton Sea
Photographs from the Salton Sea, Photographed by Andrew Yu
4.
Sprawling
Machine Inefficiency
Broken into components, the industrial process of desalination involves the filtered intake of water, followed by the addition and subsequent mixing of a coagulant to the water, which acts as a bonding agent for solids present in the water. When passing through the flocculation channels, the water is then further mixed so that the solids clump together before getting pumped through an anthracite filter. At this stage, anything solid within the water has now been extracted from it and what remains in the water is only the saline and chemicals from the sea. The water is then passed through a series of reverse osmosis filters that use high pressure pumps to force water across a semi-permeable membrane so that fresh water can be separated from the remaining contaminants. Because these pumps can only filter around 95% of its intake, the 5% left behind becomes hypersalinated. The separated freshwater is pumped into a collection pool heated by a series of geothermal heat exchangers before it returns back to the Salton sea.
As fresh water is returned to the sea, the goal is to reintroduce species of fish and rebuild an ecology that can be sustained by the effort of the desalination plant. As for the hypersalinated brine water, it flows into a series of salt pans, one foot in depth, so that when left to evaporate, an immense amount of salt can be harvested. Evaporating brine within salt pans, which is a practice that dates back to the Roman Empire, relies on an exchanging of energy with the sun, the progenitor responsible for life as we know it. Furthermore, depending on the chemical composition that the salt was exposed to, it can affect the flavor of the salt similar to the concept of a terroir with respect to wine. What results is a unique type of salt that can be harvested from the Salton sea.
For my thesis project, I paired this method of harvesting salt with the curing of fish, a method of preserving fish in Chinese culture that further brings out the umami flavors. Fish are covered and marinated for several days in a vat of salt before being wrapped and spread out across a plate to be dried out by the sun. Not only does this method of curing preserve the fish but as a result, it becomes sweeter and more aromatic. Cantonese people often use preserved fish in fried rice dishes for these very reasons.


 The Inefficient Desalination Processing of the Salton Sea keeps the Salton Sea in Permanent Stasis
Oasis from Beyond the Salton Sea
5.
in the Salton Sea // Salton Sea, California Oasis from Beyond the Salton Sea
6.
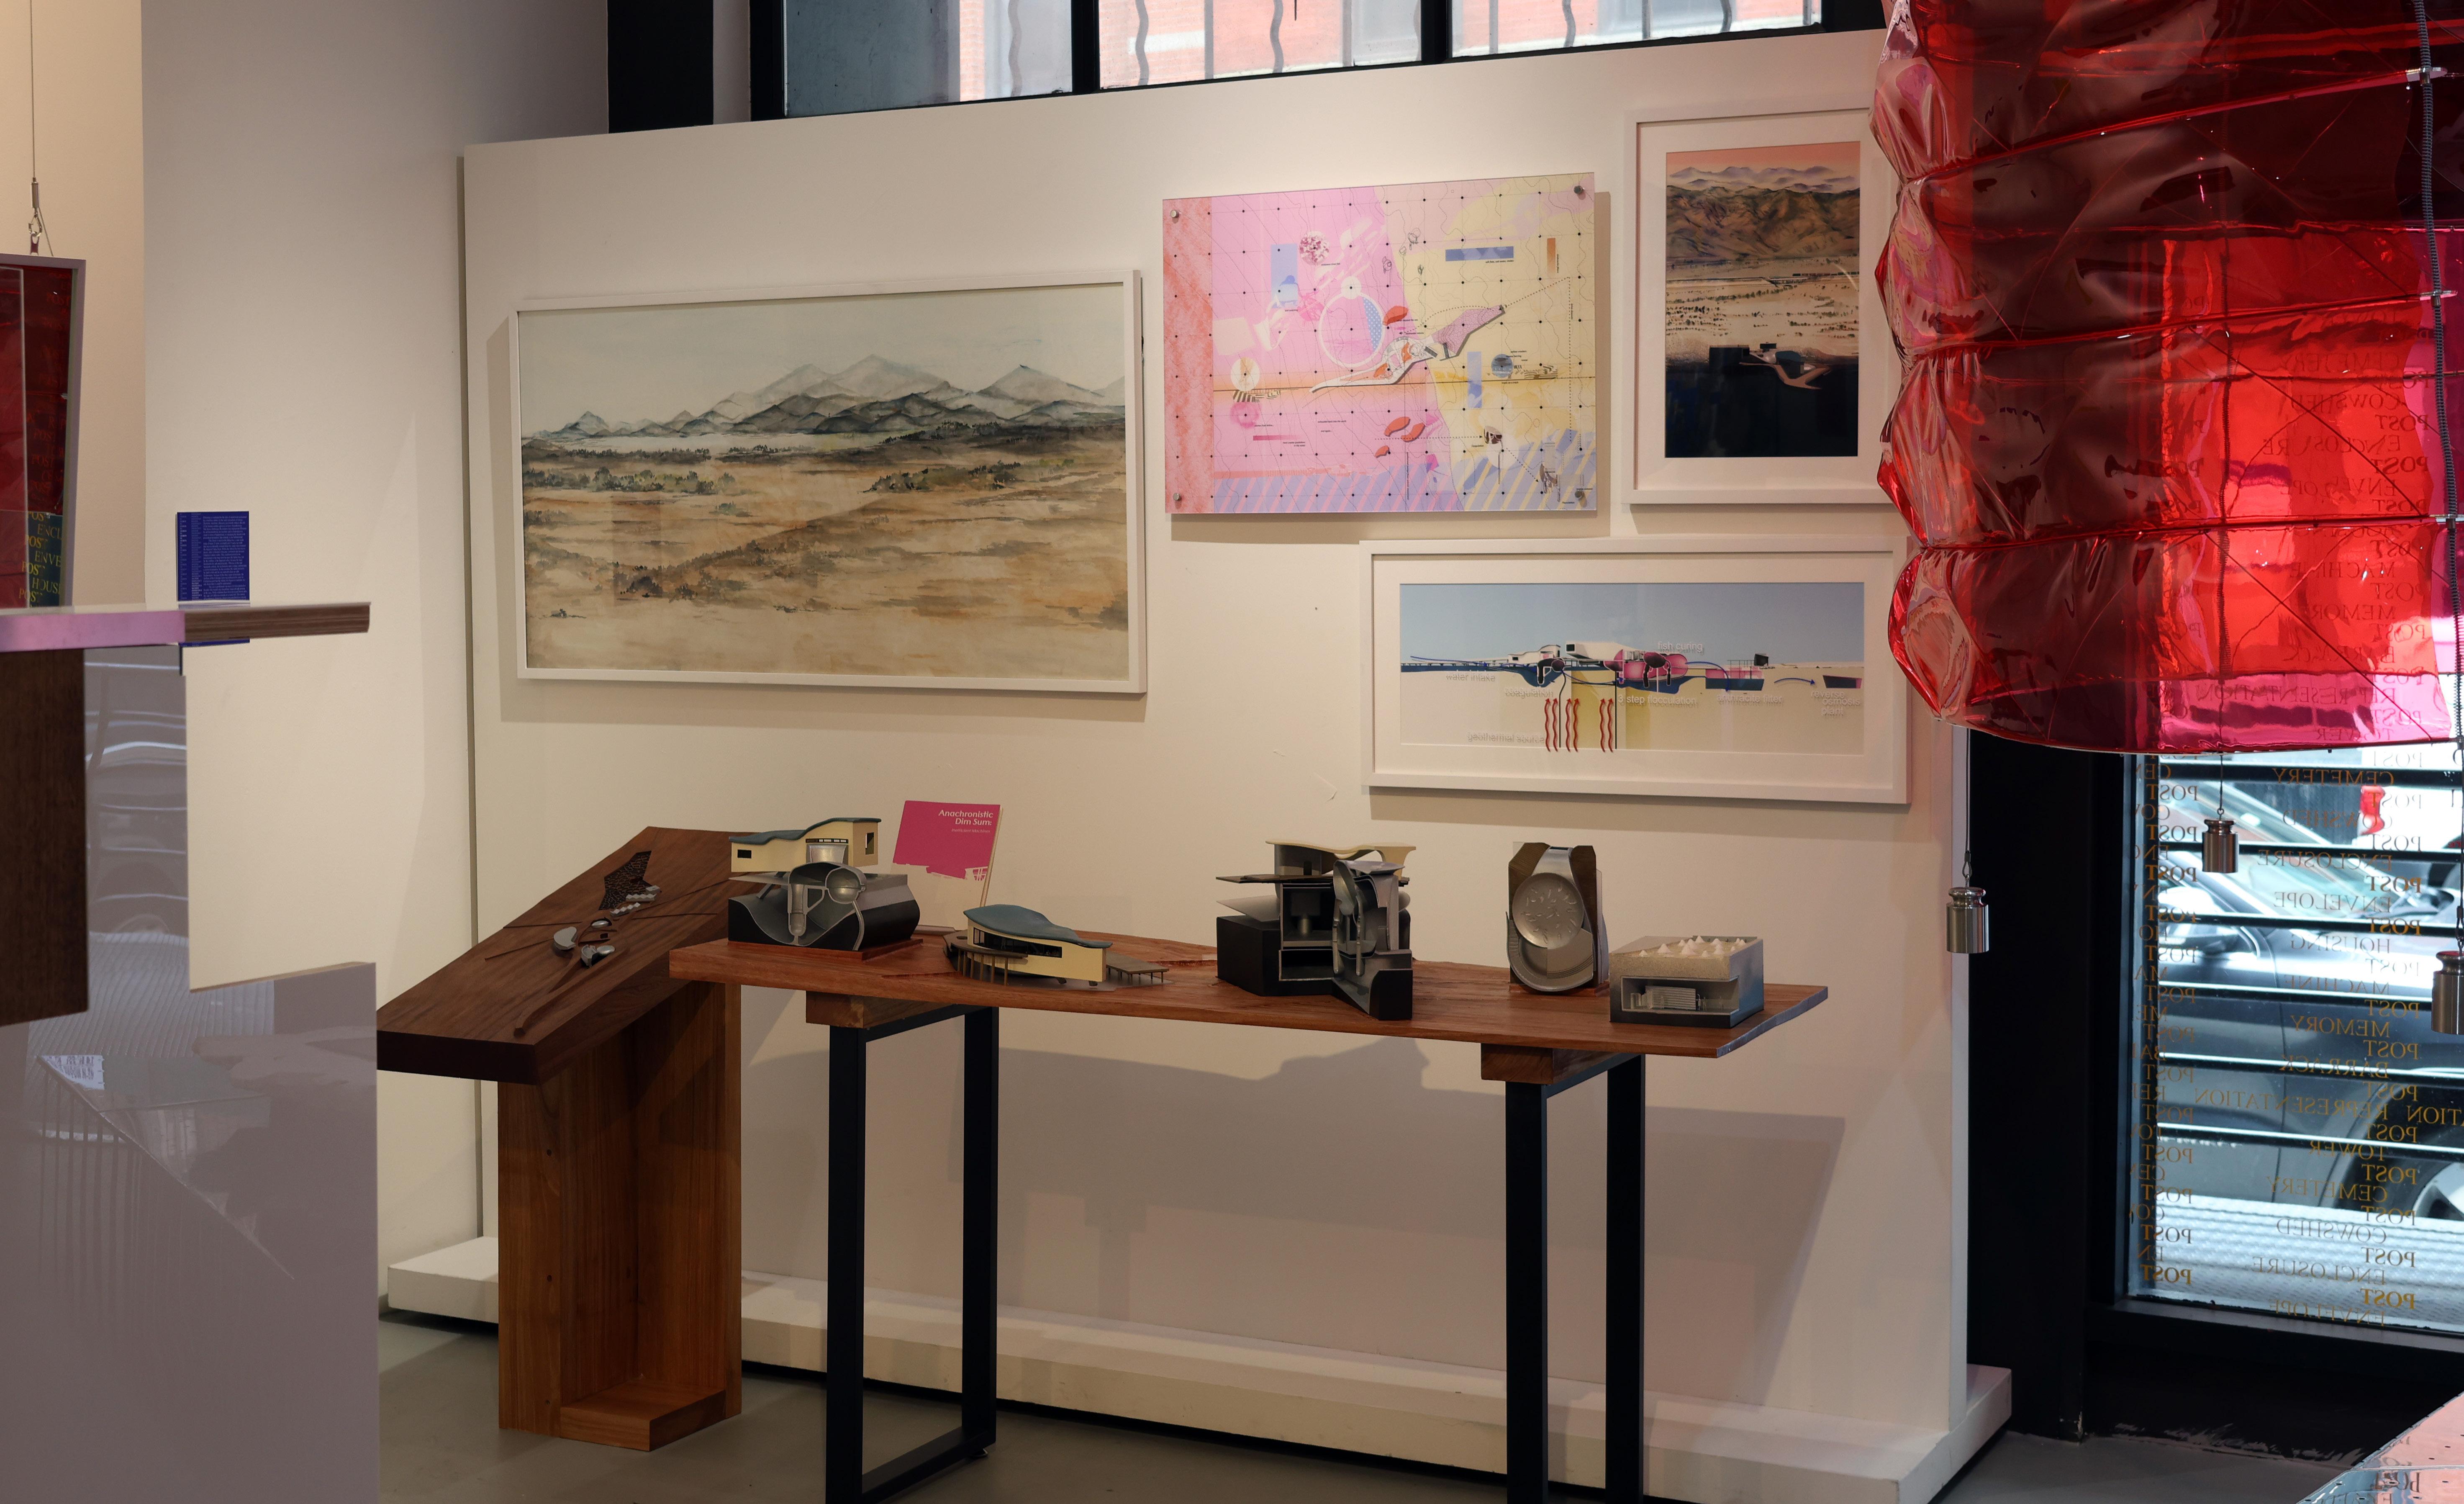
Machine Inefficiency Exhibited at Cheryl Hazan in Tribeca, New York City, March 29th - April 19th

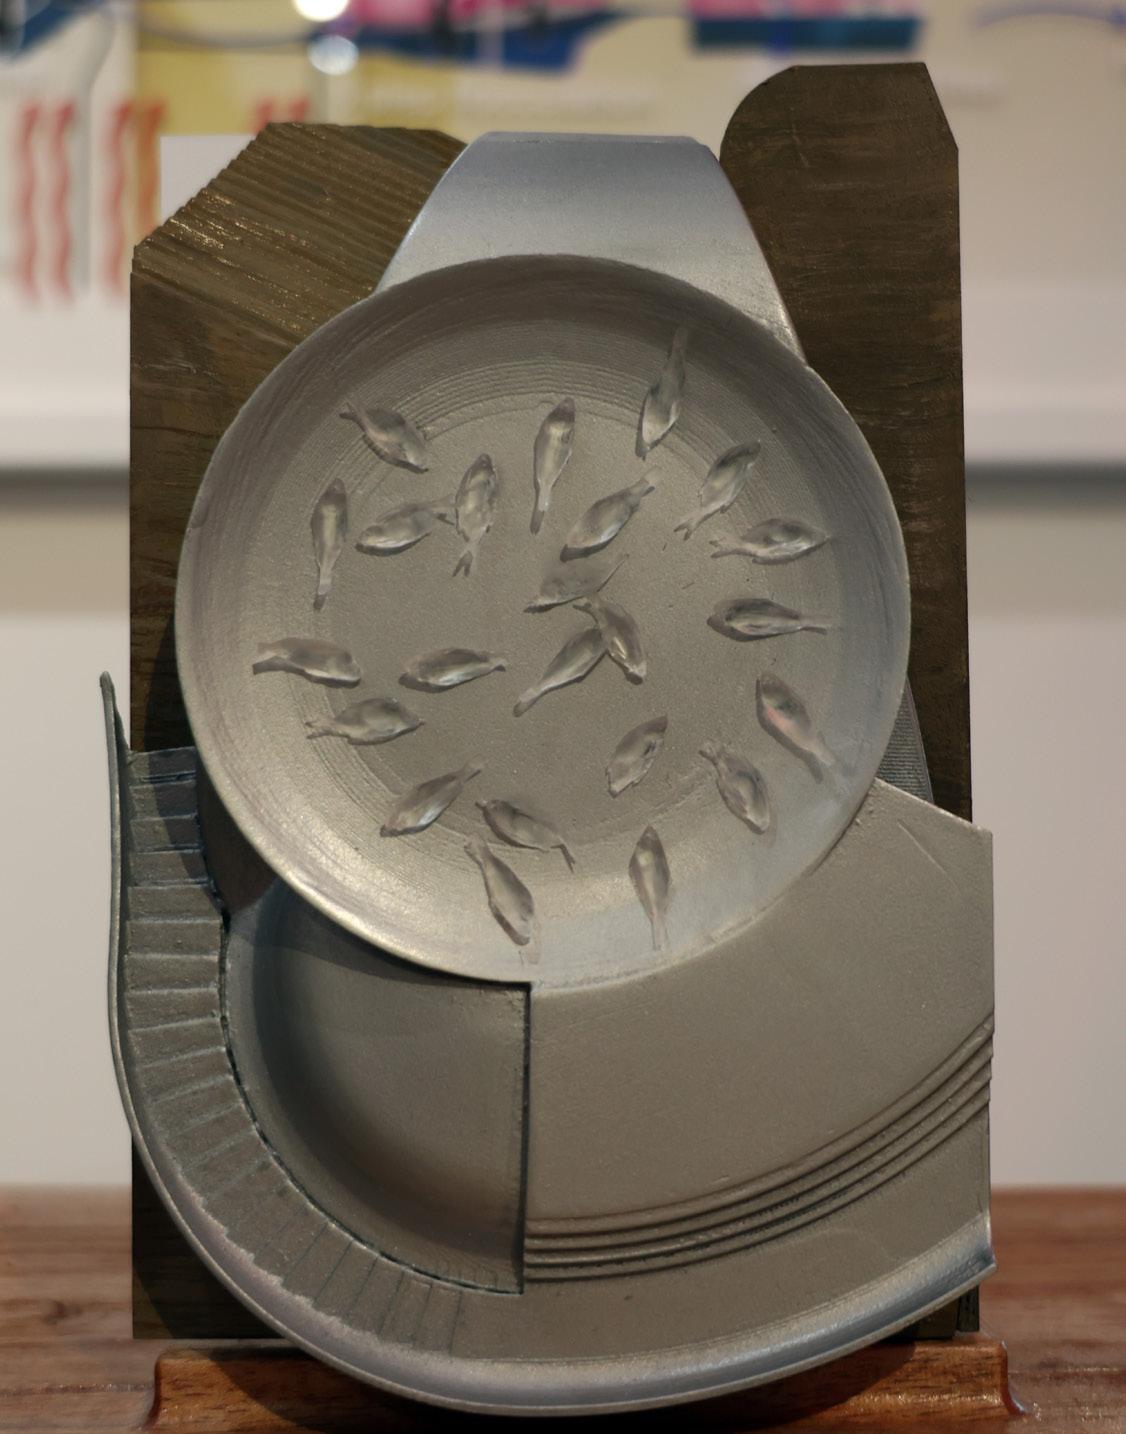


 Site model Milled into Walnut
The Space for Sun Drying FIsh
The Flocculation Machine
The Coagulation Machine
7.
Model Table Milled into Mahogany
CLIMATE HAVEN: DETROIT
A Projective Approach to Climate Change
Fall 2021
Cities, particularly along the coast of America, have been growing at a rapid pace throughout history. Places like New York City, LA, and Houston take in hundreds of thousands of migrants every year; they become integrated into the life force that sustains these cities. The migration towards these megacities is the result of the poor economic conditions and lack of employment opportunities, all too typical across America. However, rather than addressing the losing situation that is the degradation of the rest of the country, architects, politicians, and planners remain fixated on remedying the needs of expanding cities. While the importance of these cities cannot be underestimated as they are essential to the current American economy, the lack of attention given to the American heartland has led to a polarity in the quality of cities outside of the limelight. However, the Midwest is extremely relevant to America, especially when planning for the future. American megacities are flawed; their geographical locations make them extremely vulnerable to climate change. Warmer summers and drier conditions along the west coast have led to an increase of 800% in high-severity wildfires since 1985. Cities along the West coast are also at threat of being affected by earthquakes. Meanwhile, on the East coast, as the annual sea levels rise, flooding is becoming increasingly common. New York’s sea level, for example, increases by an inch every 7-8 years. Additionally, hurricanes have cost cities along the East Coast $138 billion dollars in damage in just 2018 and 2019 alone. The density of these cities has also made them extremely vulnerable to issues such as pandemics, as has been demonstrated with the ongoing COVID-19 pandemic. Finally, with 40% of the United States being susceptible to desertification, the majority of which is located around the breadbasket, the country is set to lose a lot of fertile land. With the current infrastructure not being capable of handling these massive implications, at what point is the investment no longer worth the returns?
Type: Urban Planning / Urban Design
Location: Detroit, Michigan
Category: Academic Thesis Project
Instructor: David Shanks, Yutaka Sho, Nina Sharifi
Role: Collaborative Work with Wentao Liu
[2]
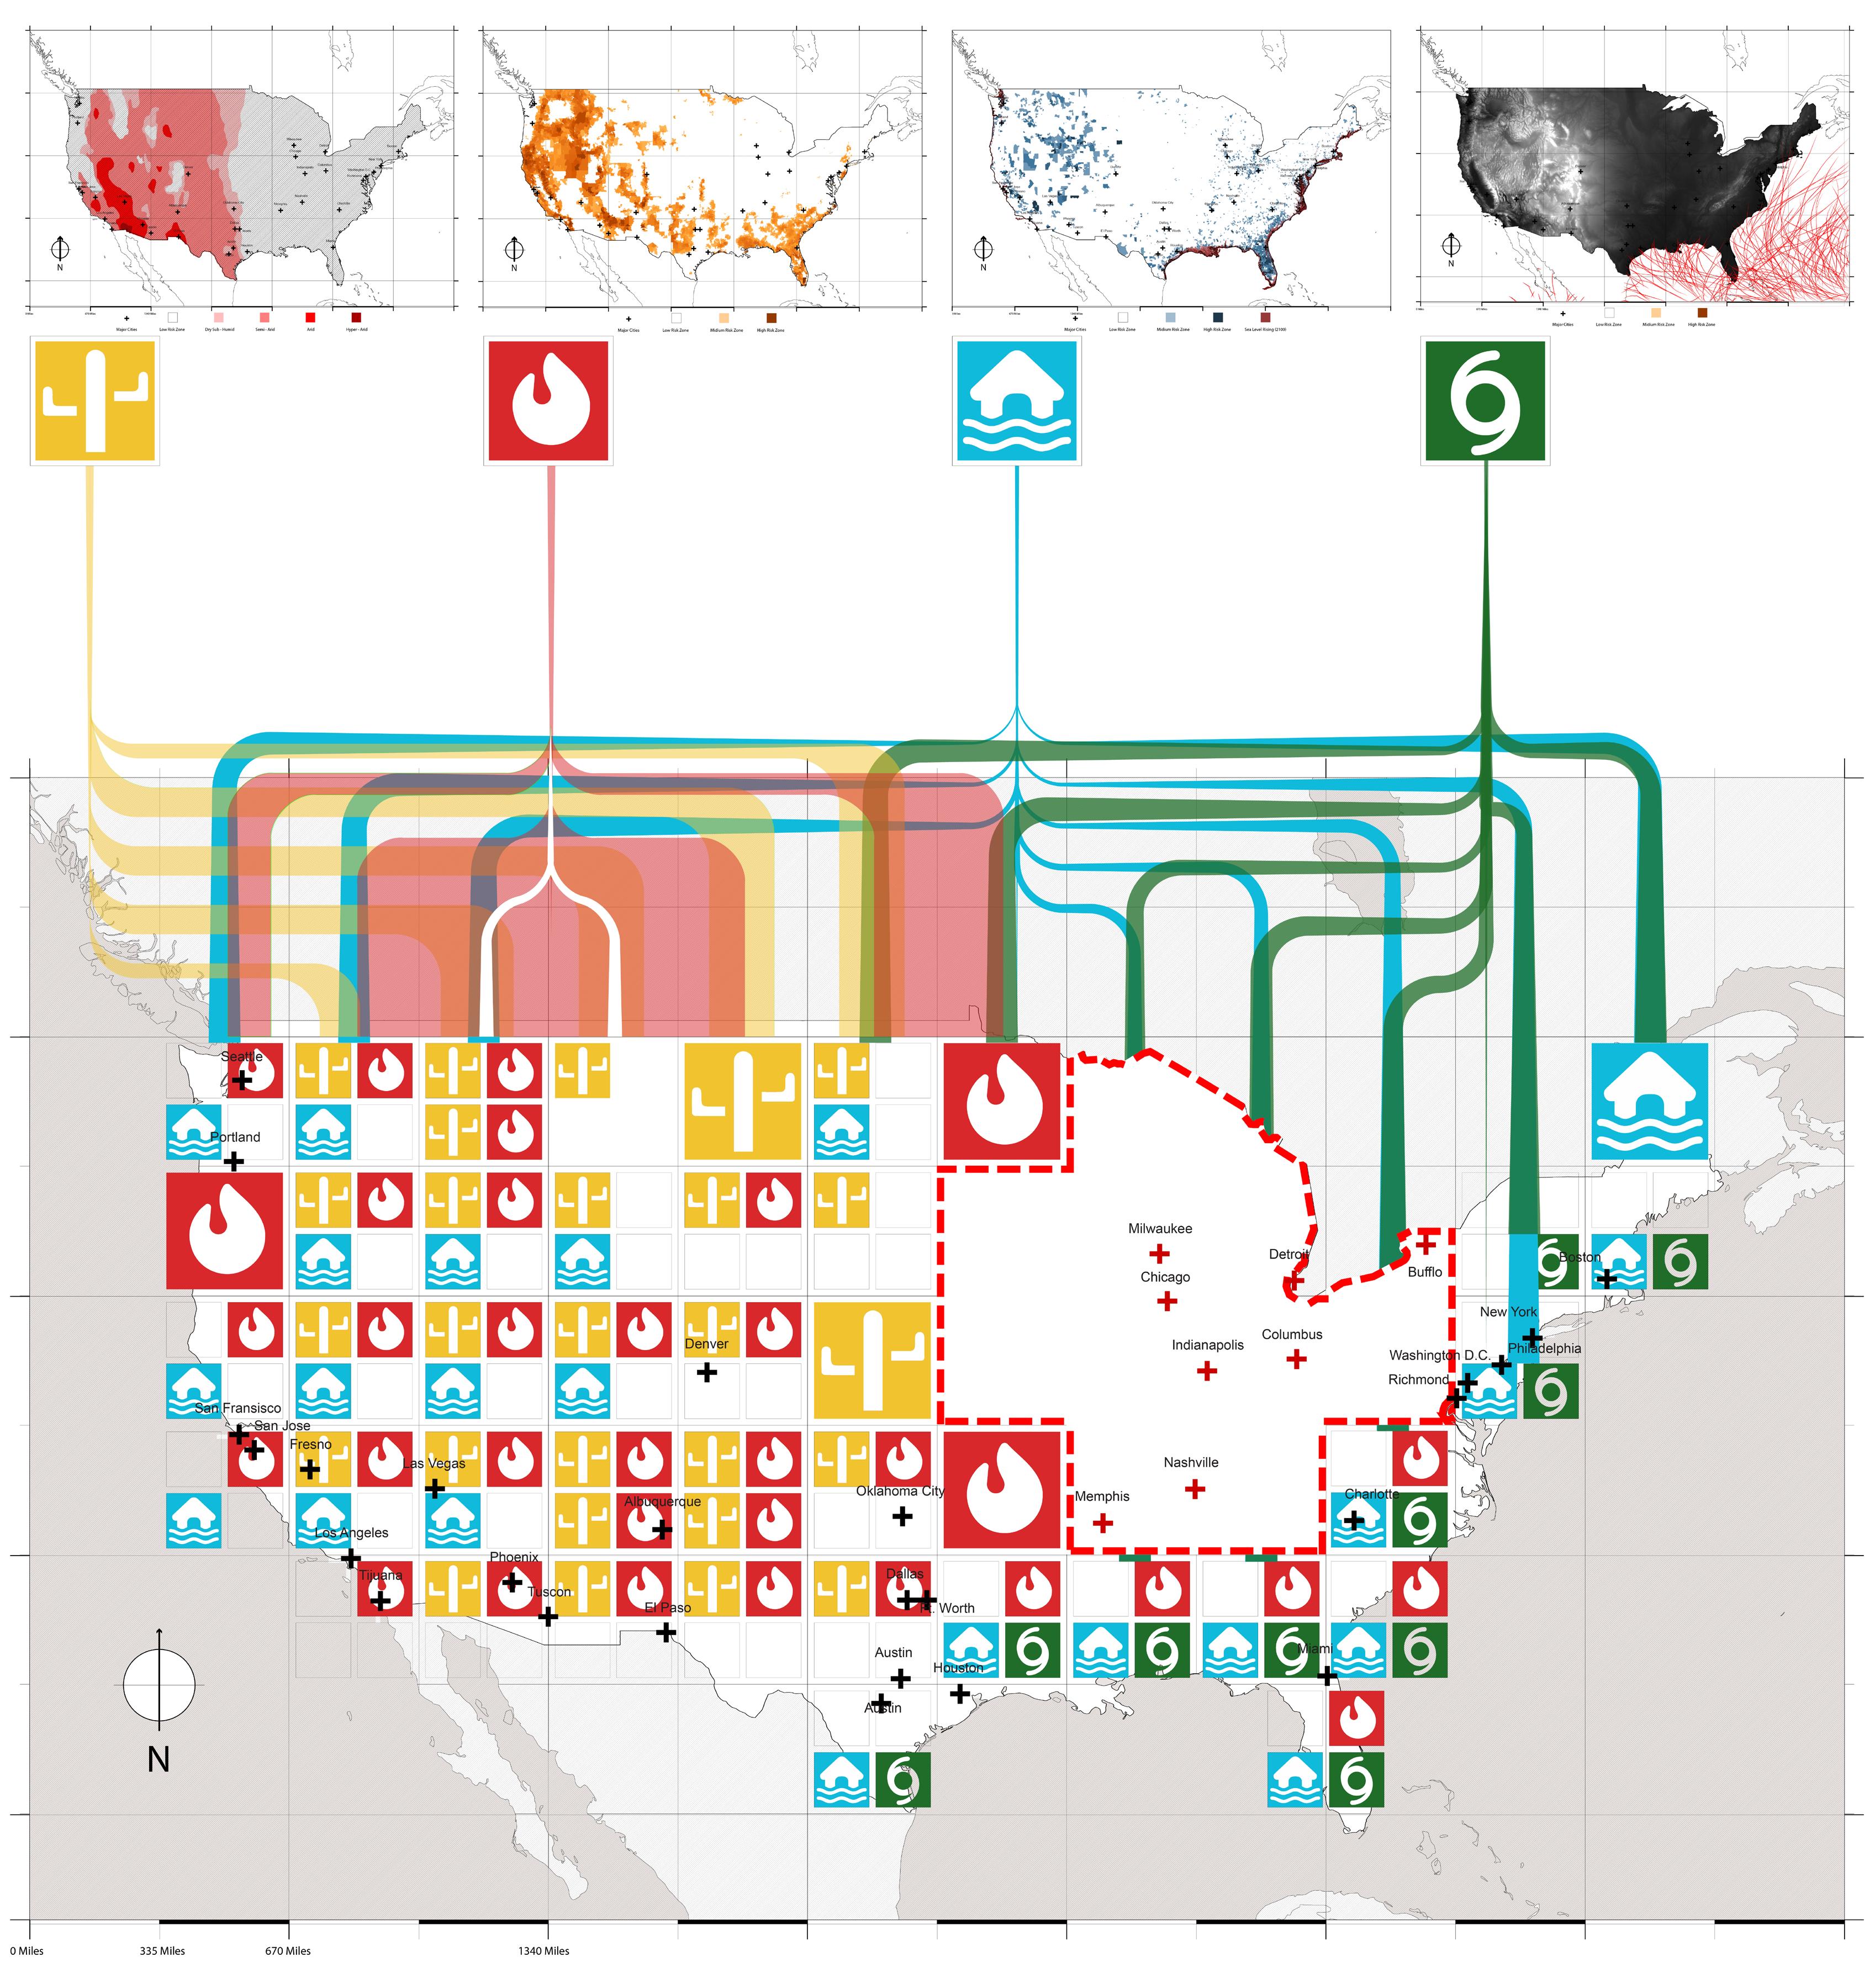
US Climate Data Comparing the Coast to the Midwest A Projective Approach to Climate Change
It is estimated that by 2100, as many as 13.1 million Americans will be at risk of losing their homes as a result of climate change, potentially resulting in a population upheaval similar to the Great Migration of the 20th century.Midwestern post-industrial Rust Belt cities are the least susceptible to climate change because they’re geographical distance from the coast, their elevation hundreds of feet above sea level, and their proximity to the Great Lakes, the largest source of freshwater in the world. Furthermore, the large amount of existing infrastructure and vacancy that has come to define these cities could be adapted and reimagined for incoming climate refugees. Therefore, the post-industrial Rust belt city could become a potential safe, climate haven for the future of the United States. The issue is that these cities are widely dilapidated; they have some of the lowest household incomes and the highest emigration rates in the country. Cities like Detroit, Cleveland, and Pittsburgh have shrunk tremendously in population and wealth since their peaks in the 20th century.
Flooding Data
Main Map Drawn by Andrew Yu; Supporting Diagrams Drawn by Wentao Liu

The failure of the city has to do directly with the failure of the infrastructure to serve the city. The infrastructures of these cities were built for the use of millions of people; however, urban planners didn’t predict the mass exodus of hundreds of thousands of majorly white families toward suburbia during the 50s and 60s. The loss of tax revenue directly affected their productivity and economy because they didn’t have the funds to maintain their infrastructure. Additionally, their infrastructure was planned in correlation with the redlining of American cities. As such, minorities who were already disproportionately segregated, saw their communities get seized by the government and torn apart for highways. Thus, when white families left the city in flocks and occupied the surrounding suburbs, they left the city in the hands of those that they had disenfranchised. Additionally, a lot of properties defaulted, making urban blight commonplace within the post-industrial city.
Hurricane Data
Main Map Drawn by Andrew Yu; Supporting Diagrams Drawn by Wentao Liu

Wildfire Data
Main Map Drawn by Andrew Yu; Supporting Diagrams Drawn by Wentao Liu

9.
Diagnosing Detroit: Infratstructural Degradation Climate Haven // Detroit, Michigan
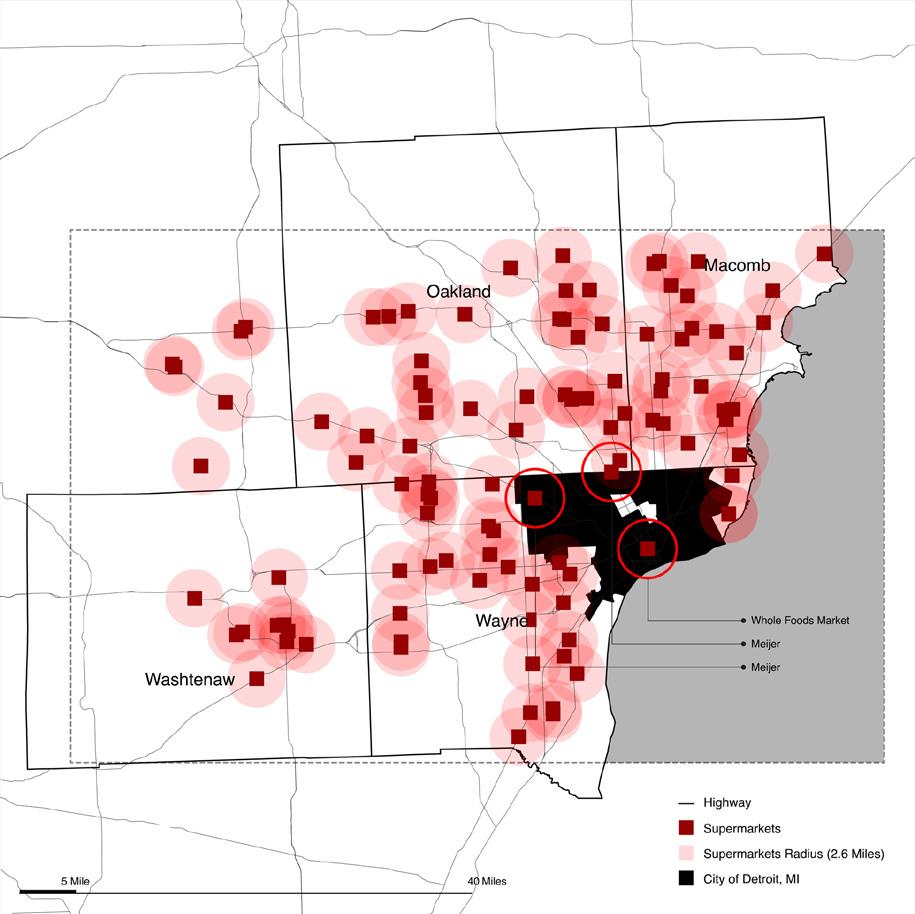
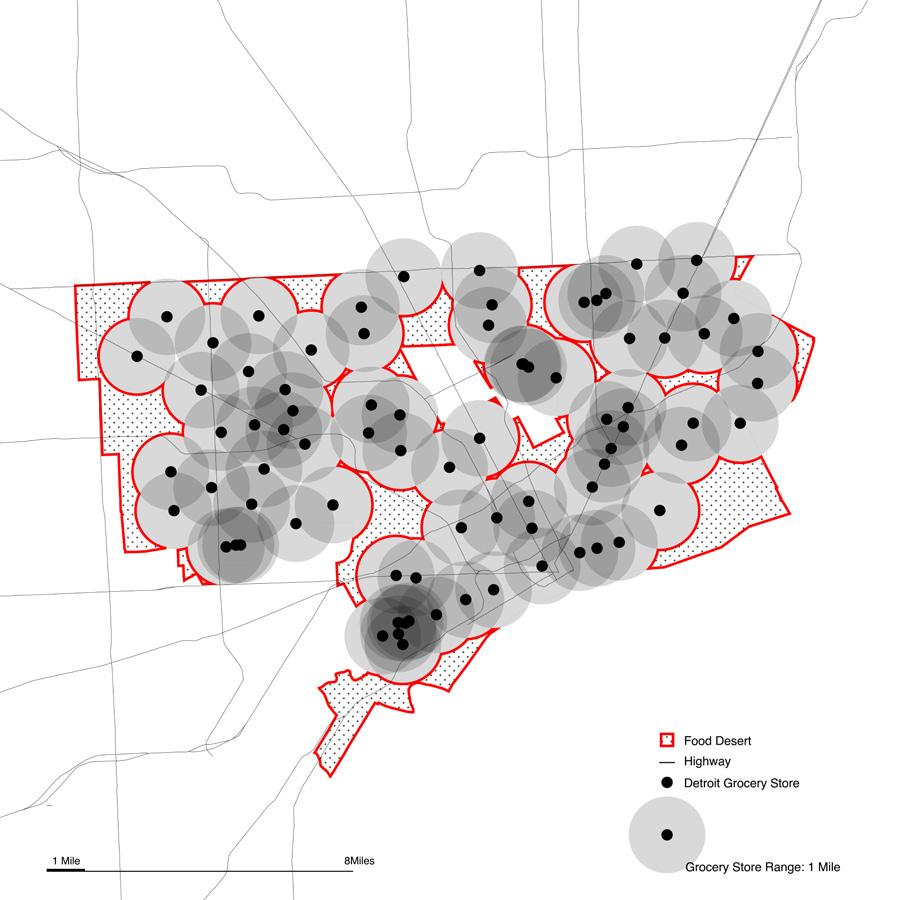
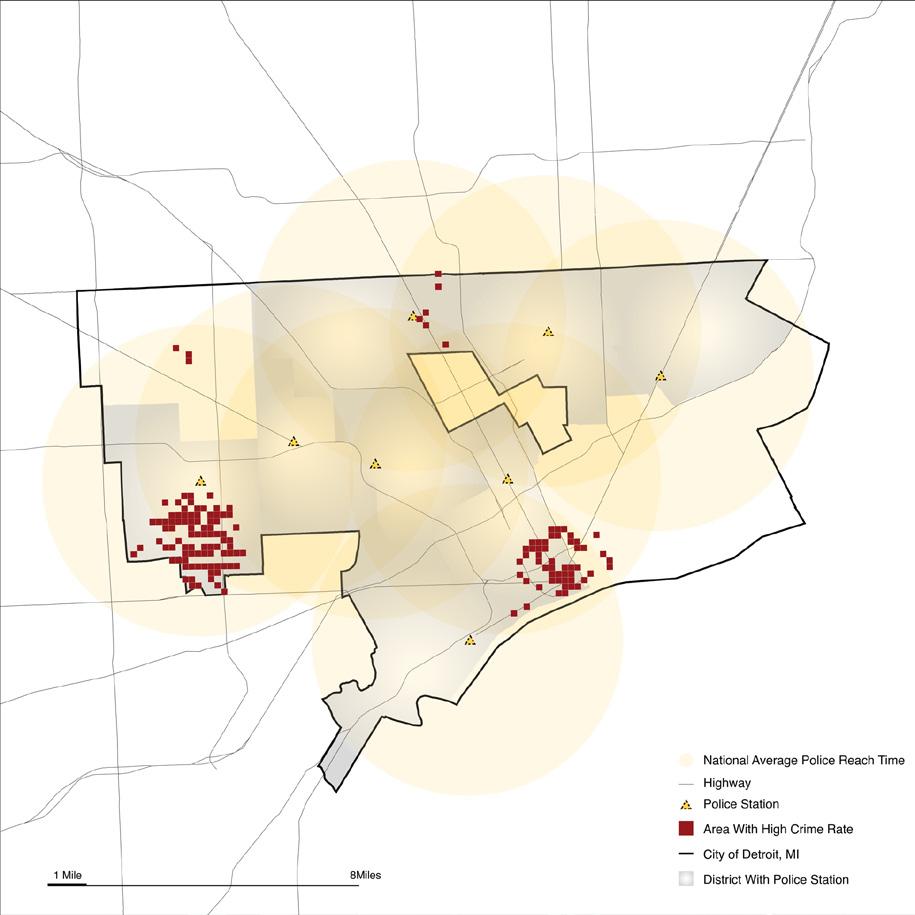
We looked to Detroit to understand the typical Post-Industrial city. Quickly, we identified that its decline correlated with the building of highways. This is because the highways facilitated the emigration of middle class families out of Detroit. Additionally, these highways were planned over redlined communities; Corporations like the Federal Home Loan Bank Board (FHLBB) and the Home Owners’ Loan Corporation (HOLC) redlined communities that were deemed hazardous. Communities that fell under this category were denied access to financial services such as banking or insurance, services such as health care and even access to supermarkets. As such minority communities have been torn apart. The loss of strong communities like the Black Bottom neighborhood and Paradise Valley has led to a disinvestment within minority populations. After the white flight, the city was left in the hands of the communities that have endured the most discrimination. This has led to poor education, low income, a lack of access to fresh foods, and a lack of access to public facilities like hospitals, among many other issues within the city.

10.
Michigan National Grocery Map Detroit Food Desert Map Detroit Police Access Map
Timeline, Data, and Research Done by Andrew Yu; Graphical Style Done by Wentao Liu Maps and Research by Andrew Yu
All Roads Lead to Detroit
Climate Haven 2100 // Detroit, Michigan
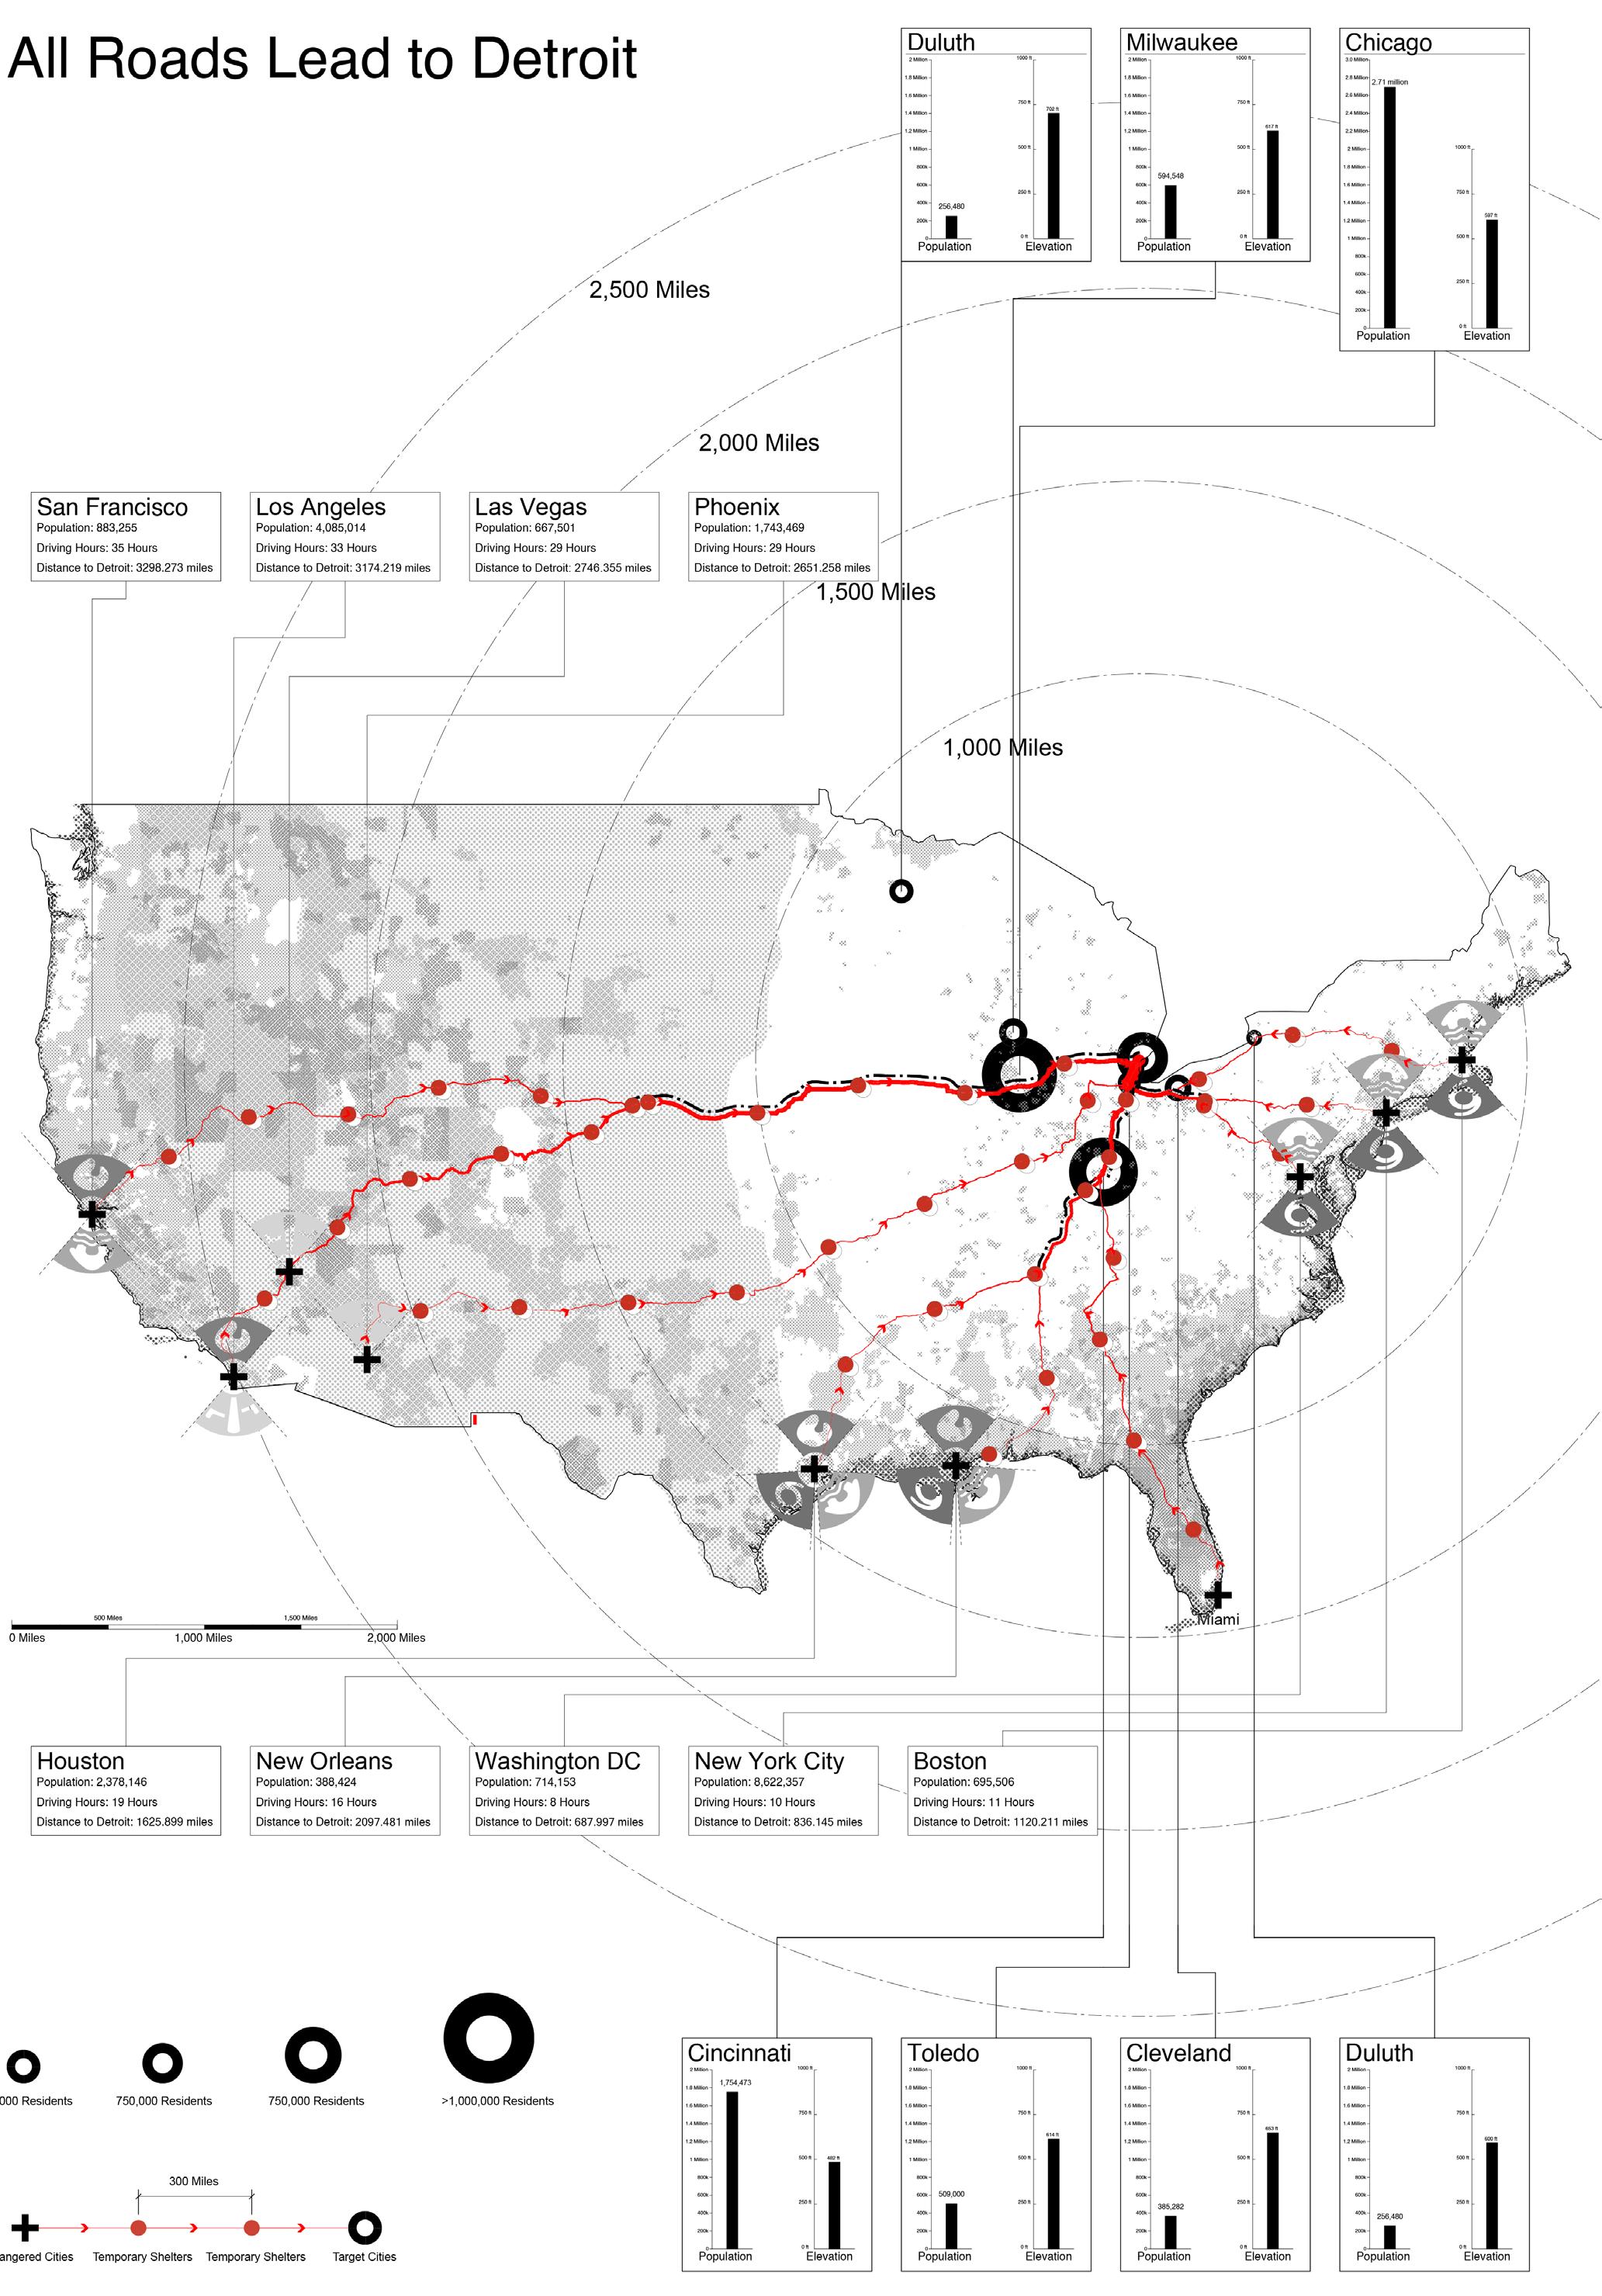
Research and Data Diagrams by Andrew Yu; Map Diagram by Wentao Liu
Protecting Lake Erie
The Great Lakes // Detroit, Michigan
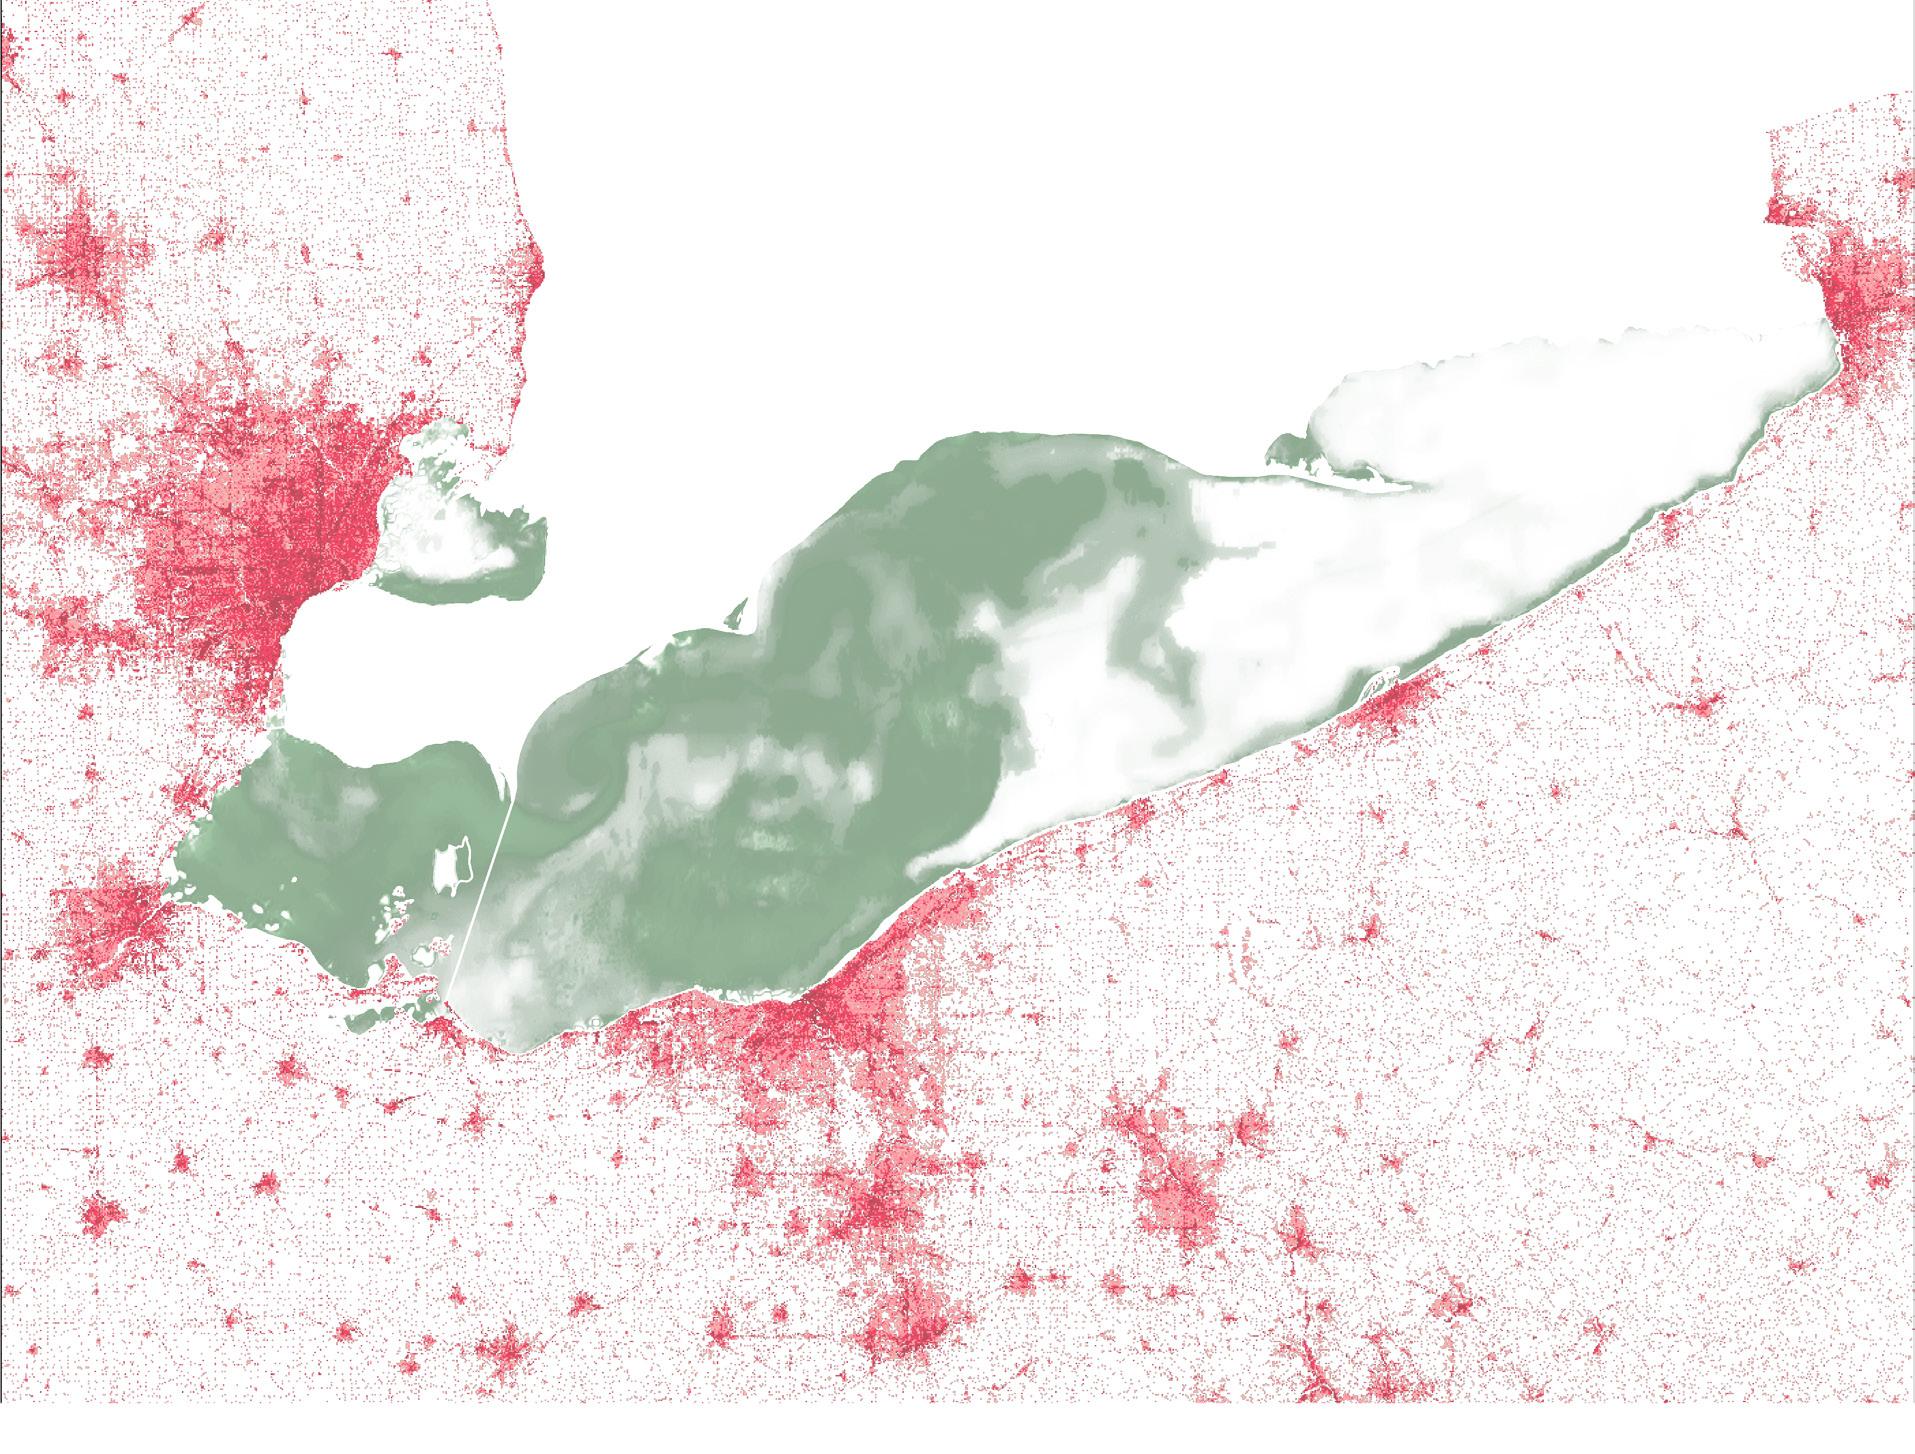
Rust Belt Cities Urban Developed Space Harmful Algae Bloom
Lake Erie Temperature Comparison 1995-2004 vs. 2011-2020 Detroit
The Great Lakes provide drinking water to millions of people, serve as habitat for hundreds of species of fish, birds and invertebrates, and provide countless opportunities for recreational activities.
Harmful Algae Bloom (HAB) results from pollutants and residue from factories. Unlike regular algae, they have a chemically film and are toxic to humans and animals. They directly affect the fish population within the lake and destroy the Lake Erie habitat.
Harmful Algae Bloom (HAB) results from pollutants and residue from factories. Unlike regular algae, they have a chemically film and are toxic to humans and animals. They directly affect the fish population within the lake and destroy the Lake Erie habitat.
The temperature in Lake Erie has gradually increased as climate change made our Earth warmer. Such subtle changes drives the indigenous species out of their habitats; furthermore, the migration of species have been affected by temperature changes.
1995 2000 2005 2010 2015 2020 30°F 40°F 50°F 60°F 70°F
Average Surface Temperature
Comparison
vs. 2011-2020
2000 2005 2010 2015 2020 30°F 40°F 50°F 60°F 70°F The Great Lakes provide drinking water to millions of people, serve as habitat for hundreds of species of fish, birds and invertebrates, and provide countless opportunities for recreational activities.
Lake Erie Temperature Comparison 1995-2004 vs. 2011-2020
The temperature in Lake Erie has gradually increased as climate change made our Earth warmer. Such subtle changes drives the indigenous species out of their habitats; furthermore, the migration of species have been affected by temperature changes.
Comparison
vs. 2011-2020
Temperature by Month 2011-2020 Temperature by Month 1995-2004
Rust Belt Cities Urban Developed Space Harmful Algae Bloom Temperature by Month 2011-2020 Temperature by Month 1995-2004 Average Surface Temperature
DANGERS
TO LAKE ERIE
Research and Diagrams on Lake Erie Done by Andrew Yu
DANGERS TO LAKE ERIE
1995
Lake Erie Temperature
1995-2004
Lake Erie Temperature
1995-2004
Detroit Cleveland Toledo Erie Buffalo J F M A M J J A S O N D 20°F 30°F 40°F 50°F 60°F 70°F 80°F
Cleveland Toledo Erie Buffalo
J F M A M J J A S O N D 20°F 30°F 40°F 50°F 60°F 70°F 80°F
11.
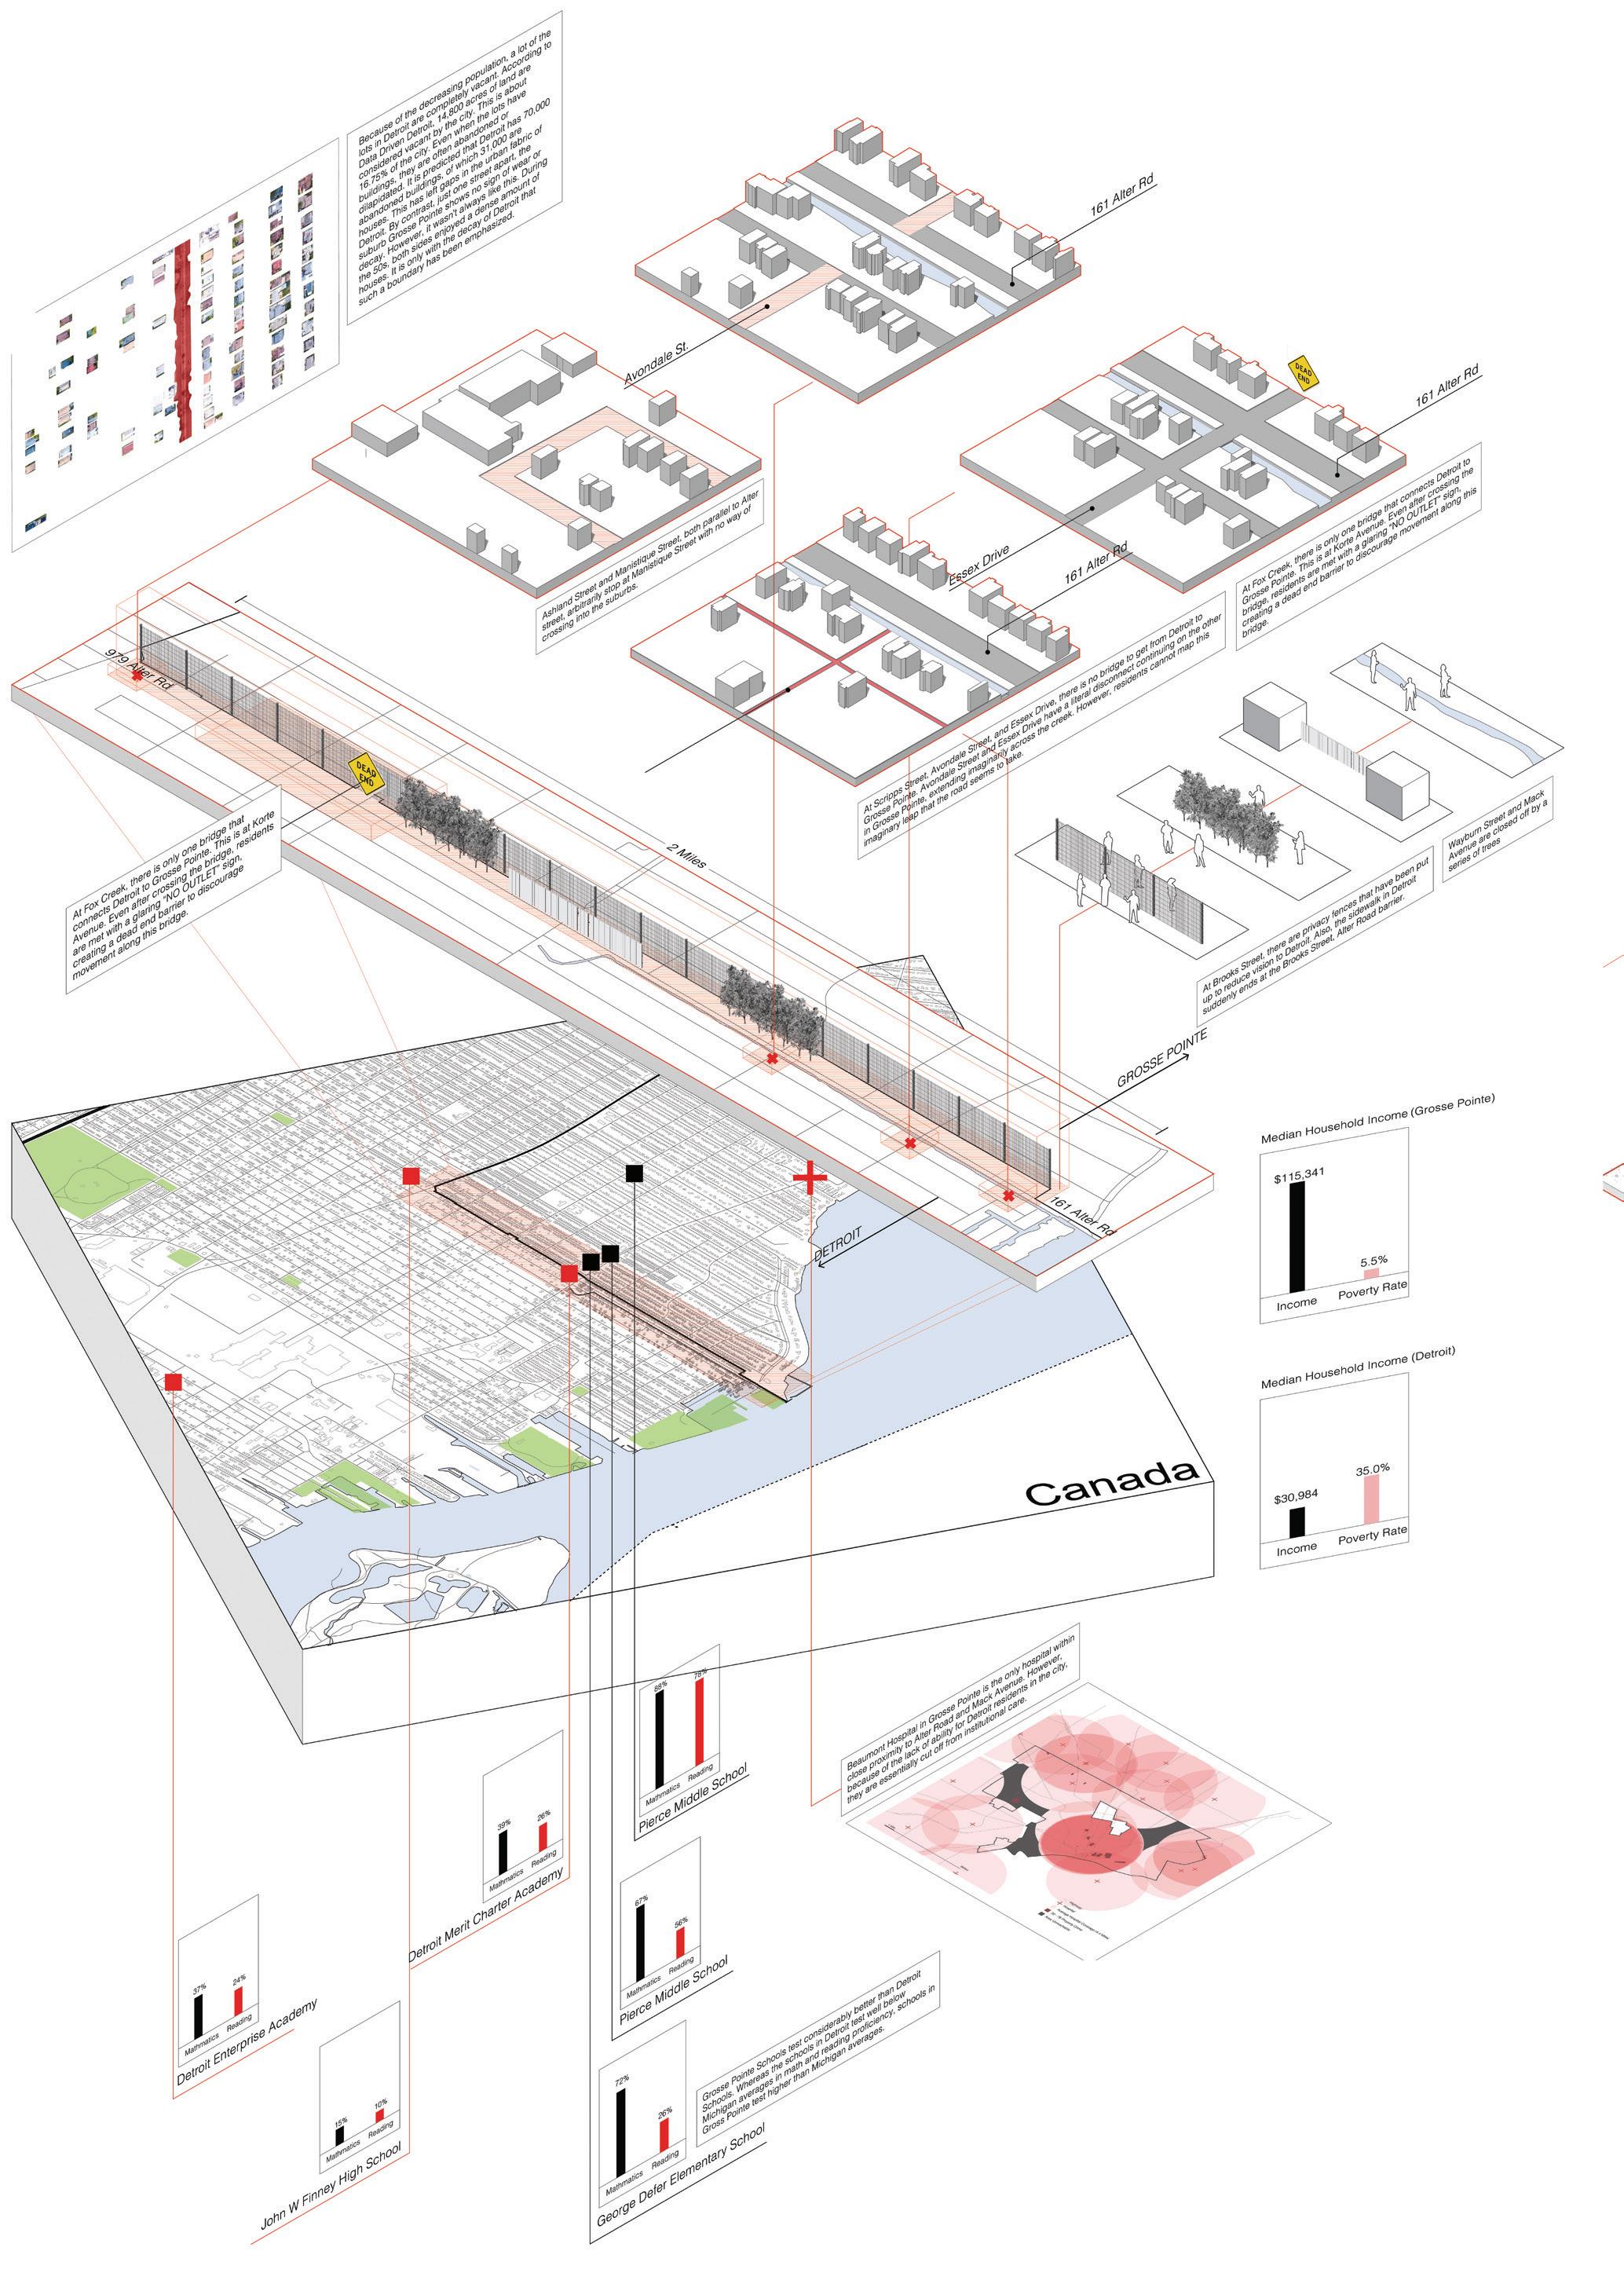
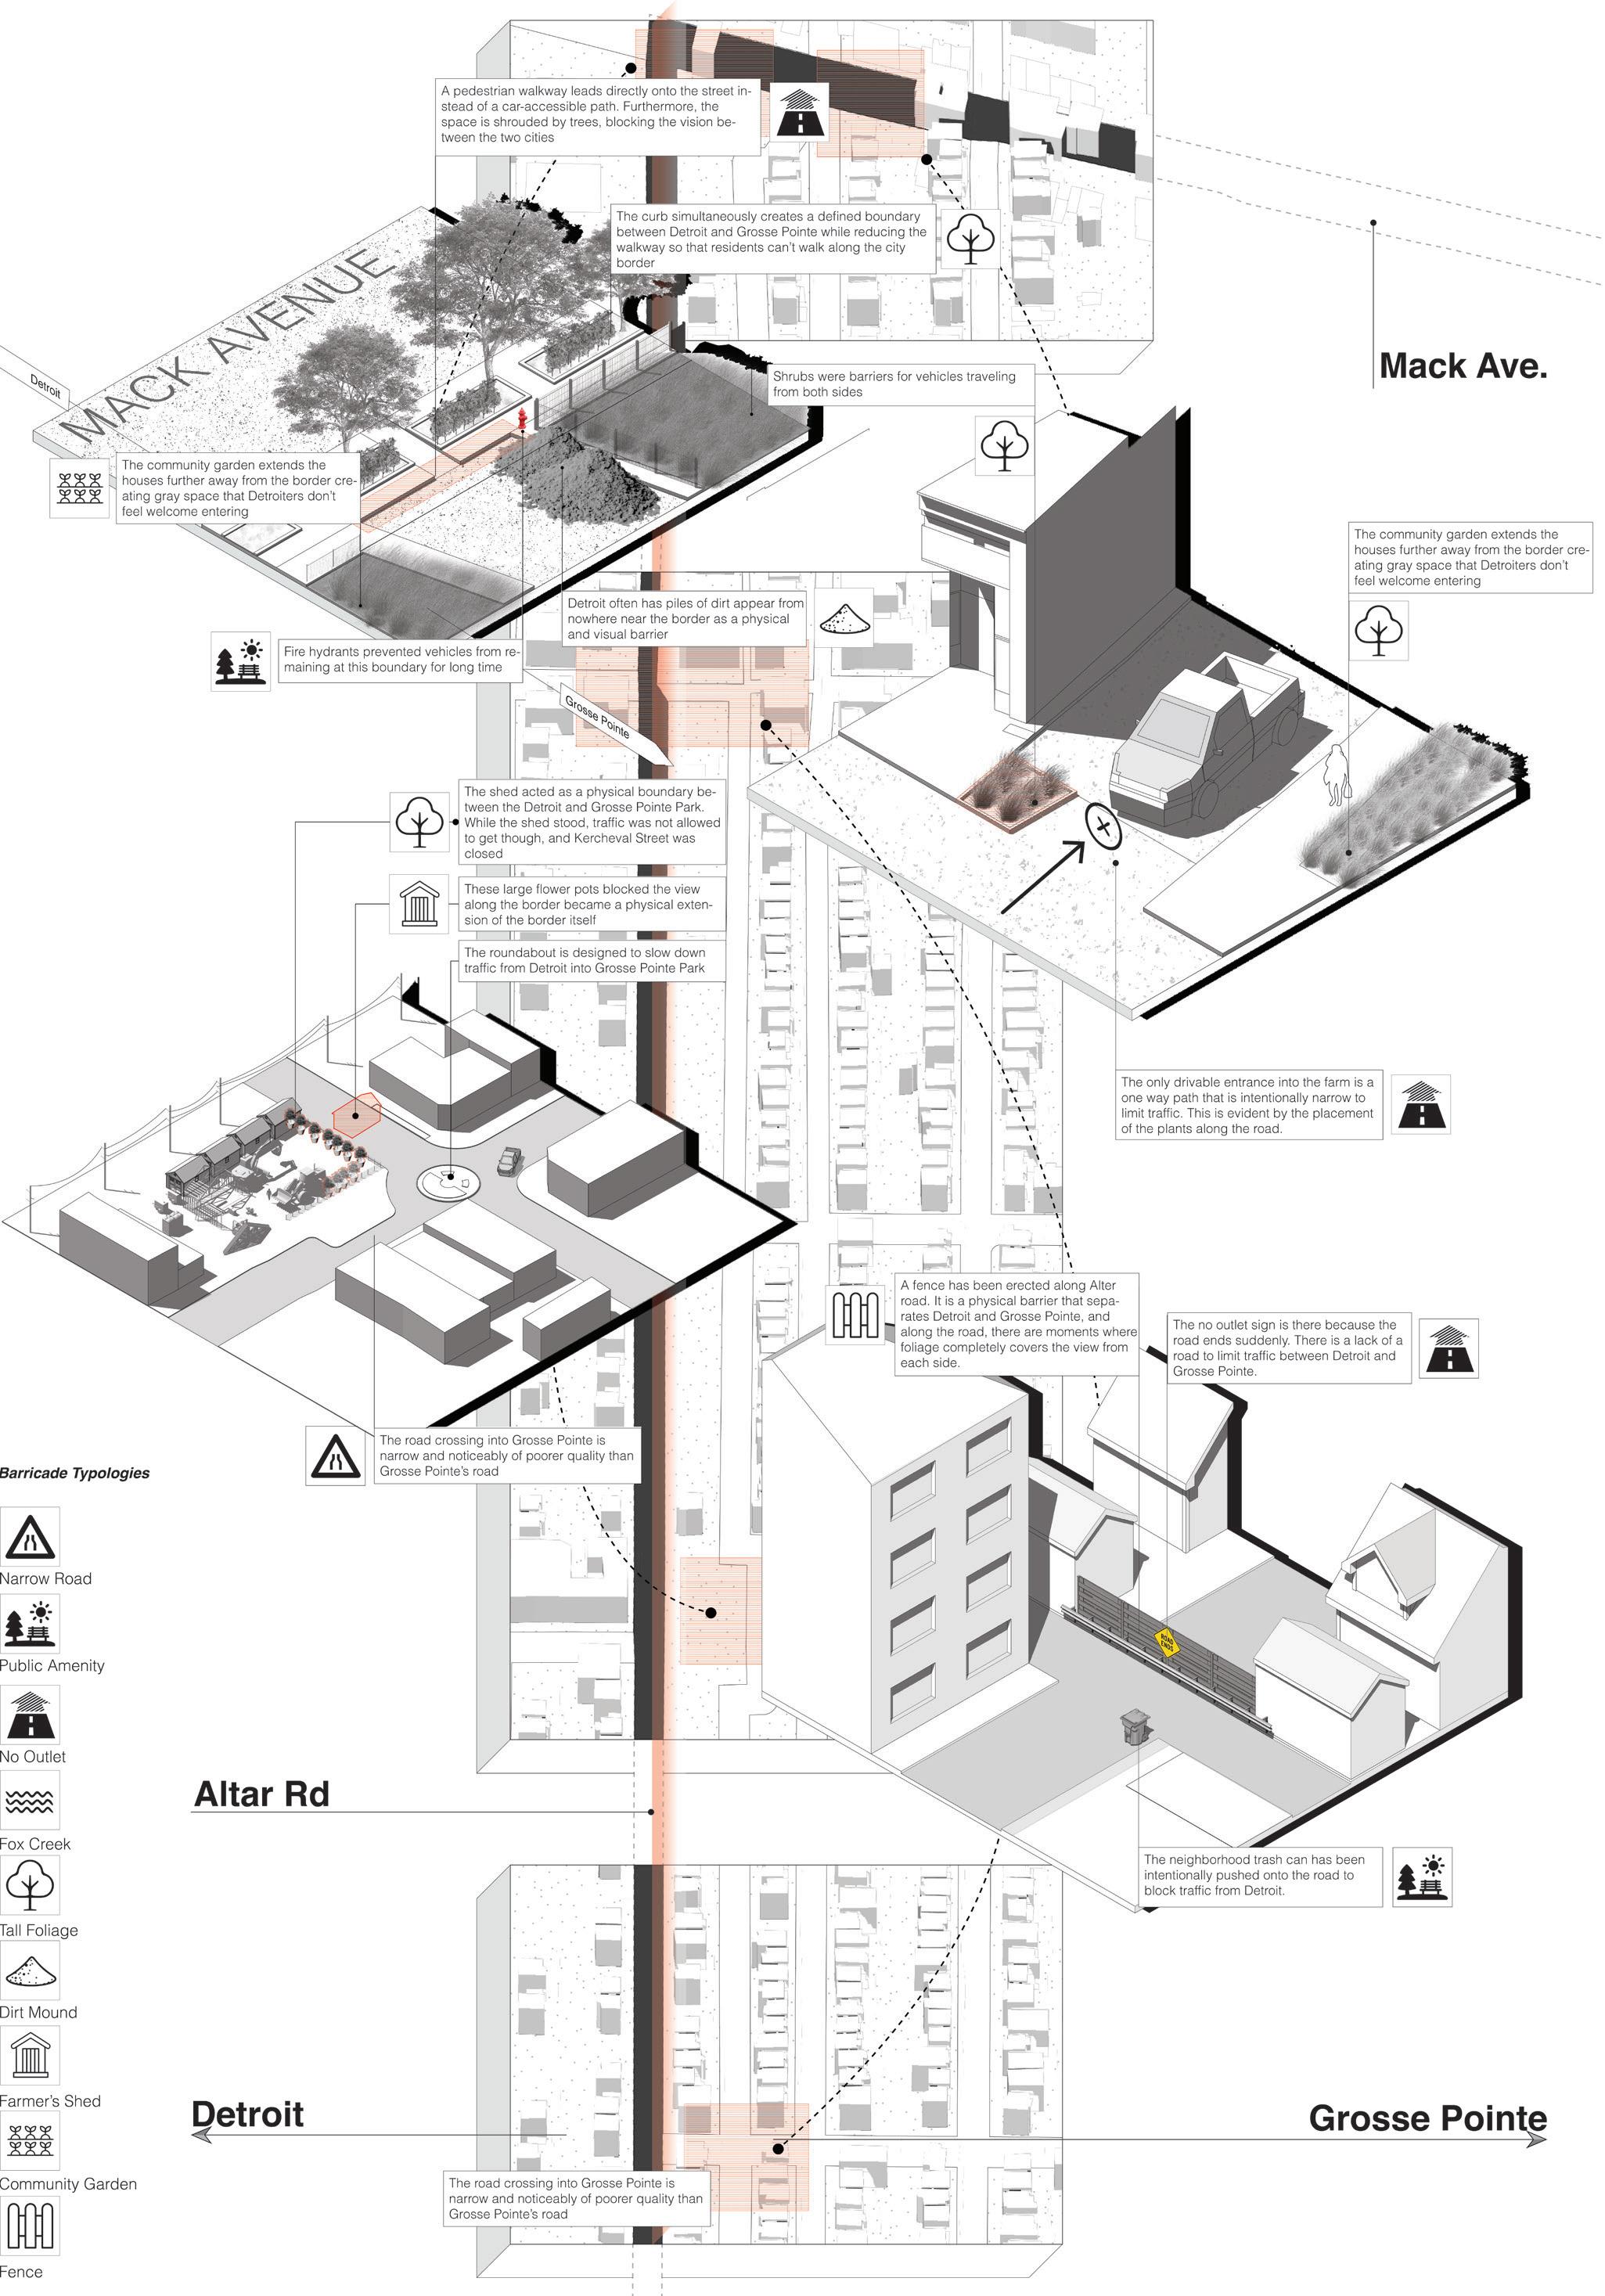
The Detroit - Grosse Pointe Boundary
Boundary Conditions // Detroit, Michigan
12.
Research and Supporting Diagrams Drawn by Andrew Yu; Map Axon Drawn by Wentao Liu
Research and Supporting Diagrams Drawn by Andrew Yu; Map Axon Drawn by Wentao Liu
TRENTON ISLES BARN
Collaborative Barn Raising
Fall 2023
Type: Community Garden Barn
Location: Trenton, New Jersey
Category: Academic Work/Community Outreach
Instructor: Erin Besler, David Cronin, Peter Mačák, Marie Baretsky
Role: Collaborative Work with Kirill Volchinskiy, Isabela Doberenz, Joshua Pisors, and Alàn Acevedo
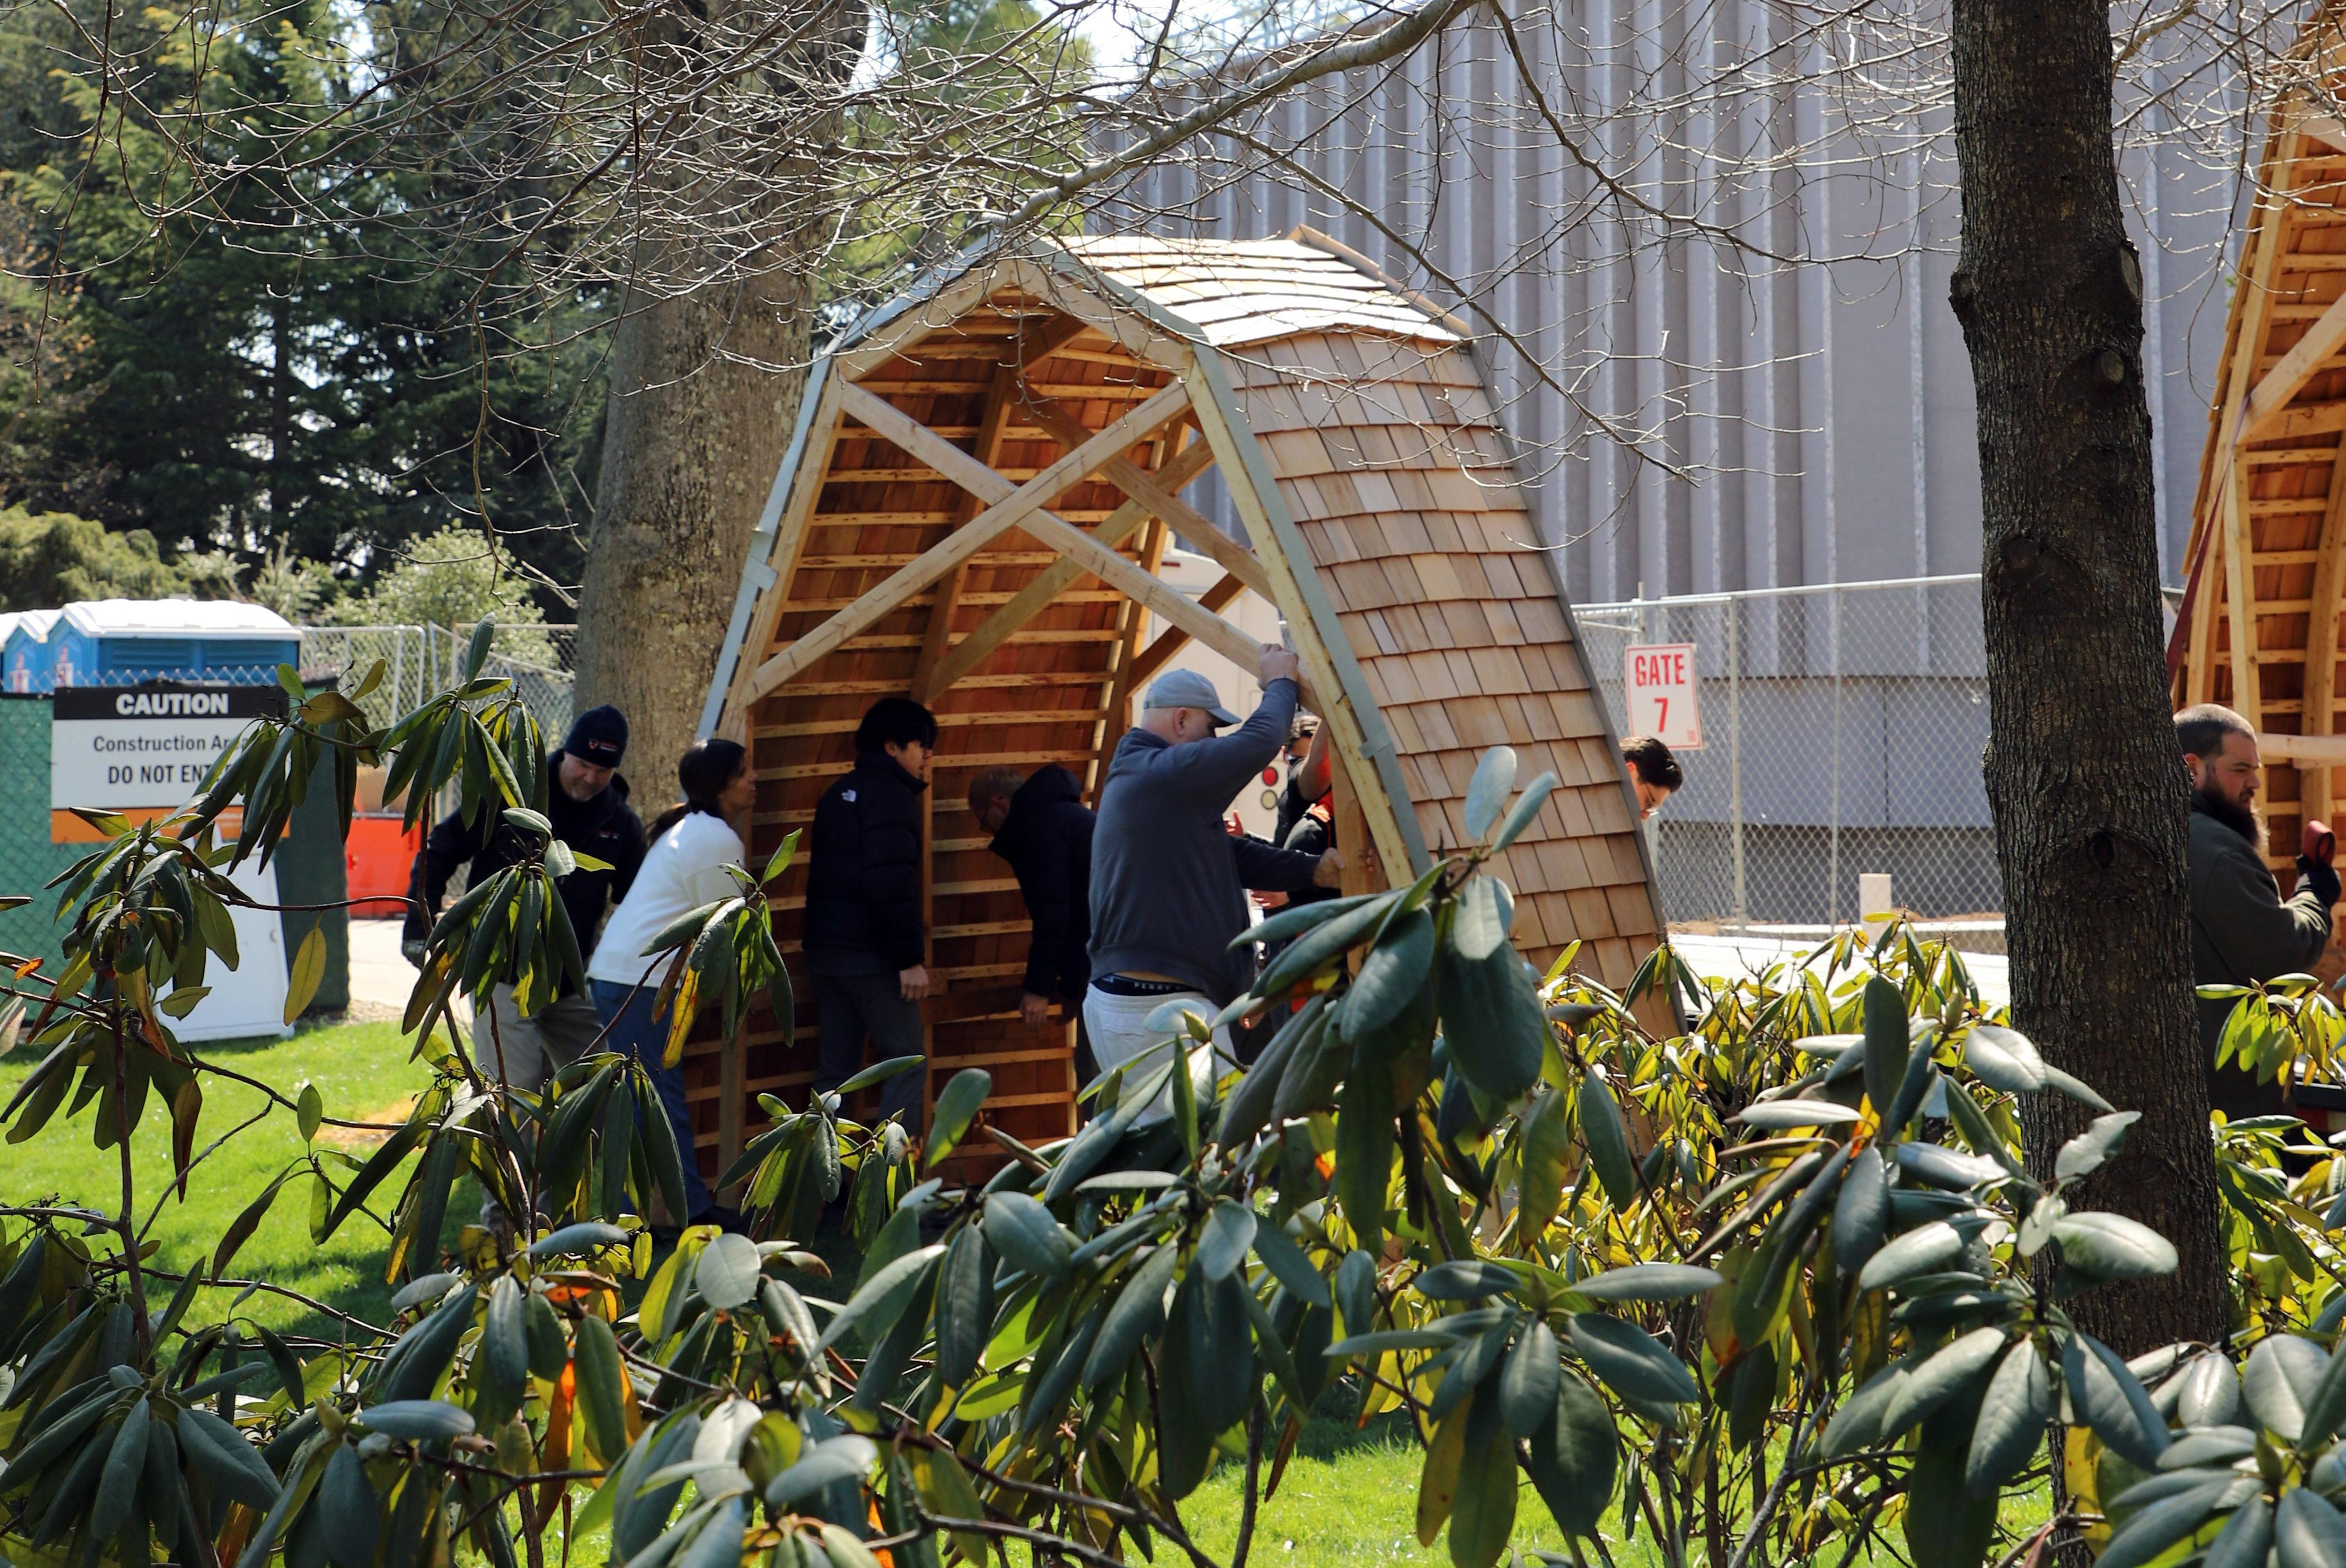
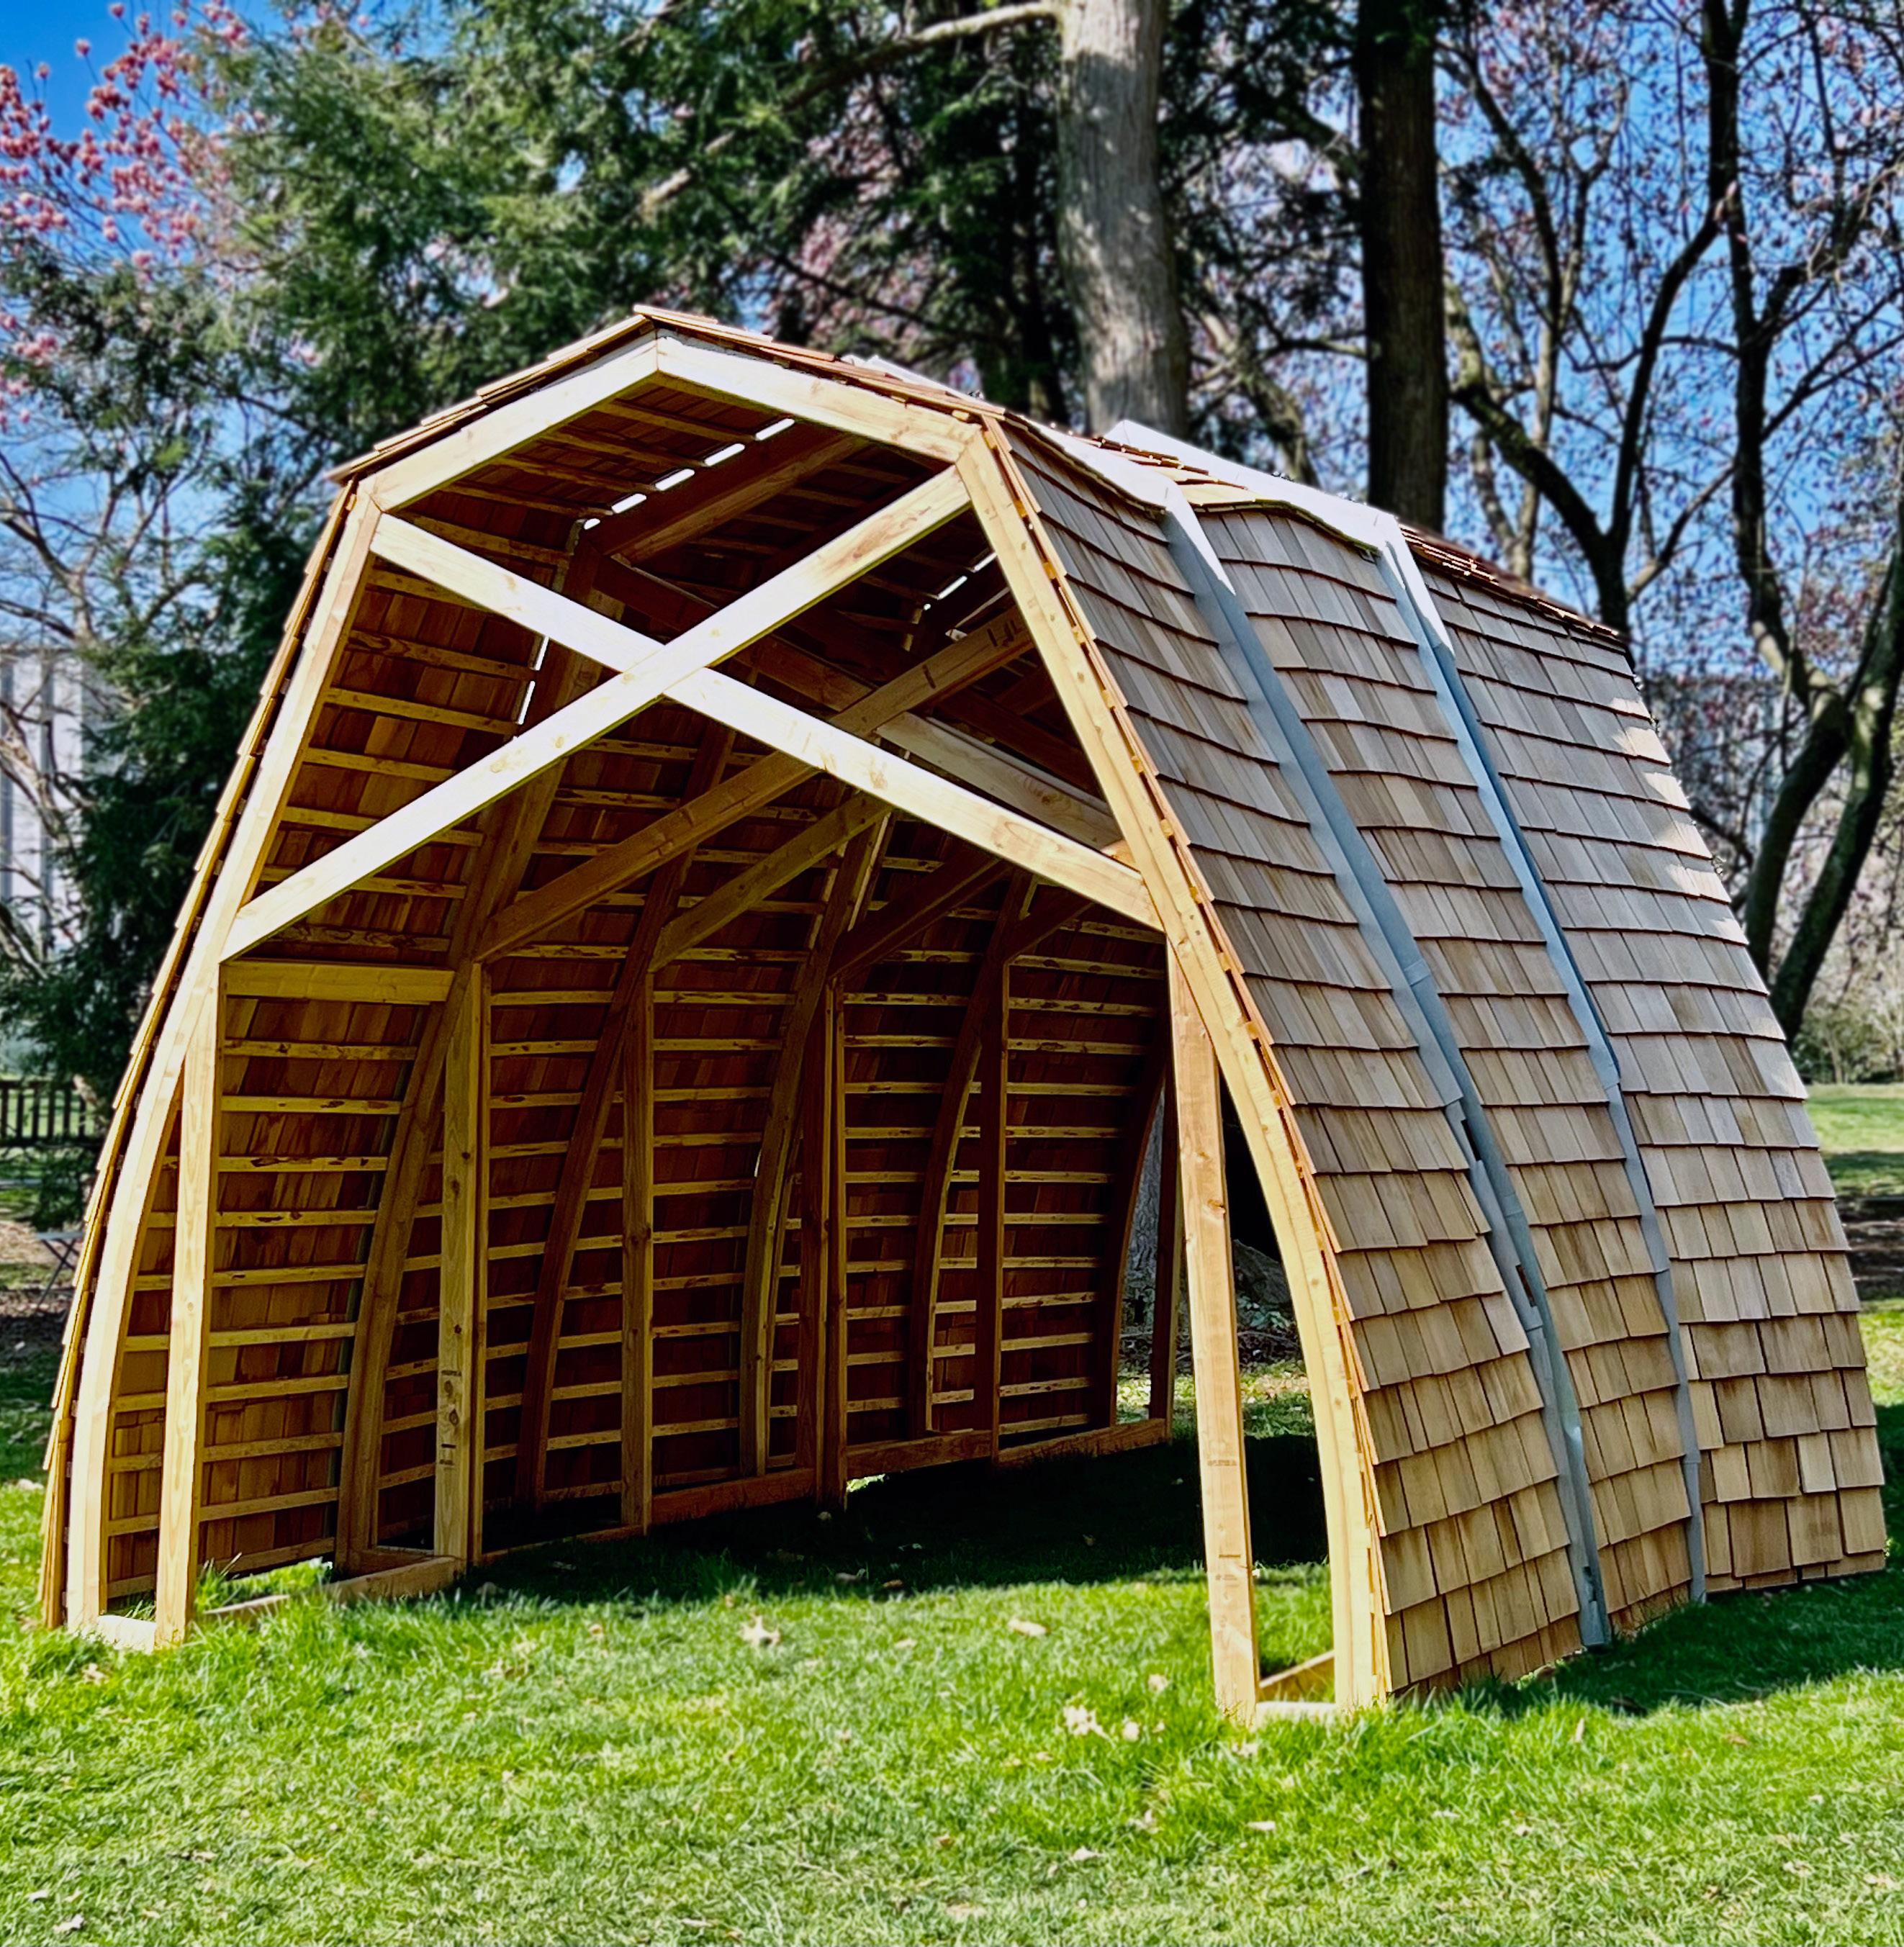
This raising of the barn was simultaneously a pedagogical exercise and performance itself. Because we were a large group assembling a single object, we were cognizant of how the amount of work that each of us contributed to the project would not be reflected once the barn was assembled because our names would be listed next to each other as equals despite the inevitability of the inequivalent distribution of work. This loss of agency upon accreditation influenced us to design and build this barn in a purposeful and performative way. Throughout the process of the project, we played caricatures of ourselves, leaning into our emotional and educational bias. We also tried to eliminate autonomy by explicitly defining everybody’s role. For example, with the design of the barn, we assigned one person to model out the project while the rest of us four would rotationally give instructions on how to design the barn. The explicit nature of us, the designers and builders, was muddled by the amount of time and different degrees of dedication required to learn how we would assemble the barn that we designed. The barn, thus, became pedagogical, literally requiring us to learn how to shingle and steam bend to complete the design, but also demonstrating the disconnect between design, material, and fabrication. It was donated to the Trenton Isles in Spring of 2024.
[3] 13.
Trenton Barn: Fabrication Collaborative Barn Raising // Trenton, New Jersey
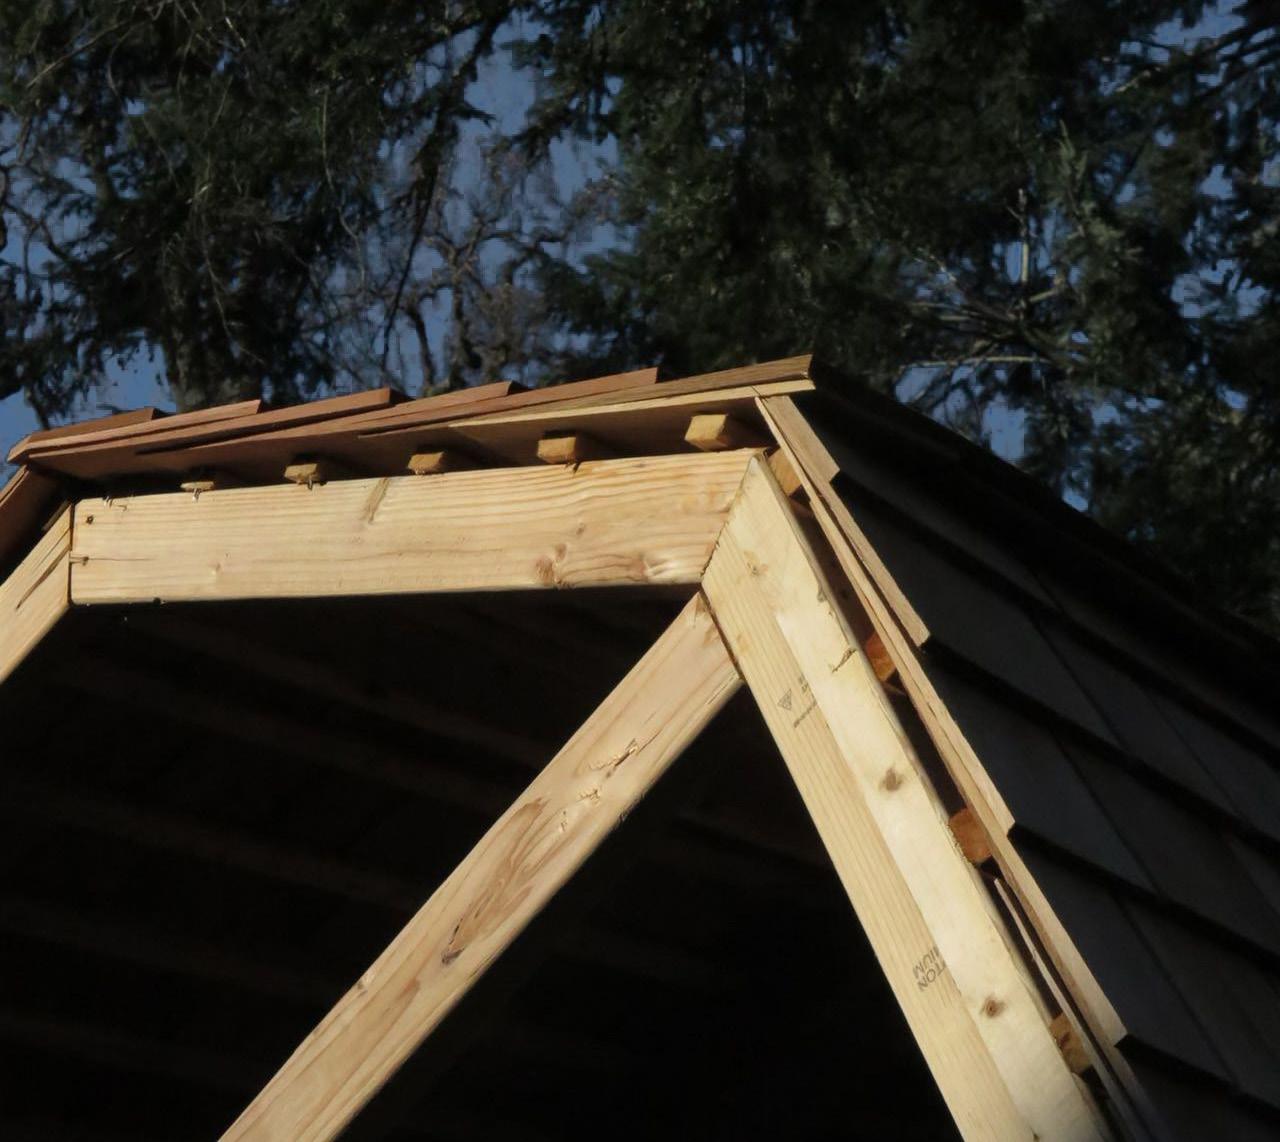
In our design process, we proposed a doubly-curved barn that would then have to be shingled and pierced by a silo built from larson trusses. WHowever, the silo was lost to budget and time constraints on our part. Nonetheless, the construction of the doubly-curved barn required a great amount of ingenuity on our parts to be realized. We split the barn into three modules so that it would fit on a moving truck. Otherwise, we were focused on realizing as much of the design as possible with the rhino model as sacrosanct. Because the maximum size of plywood on our CNC was 4’x8’, we could not CNC out the trusses for our barn. Instead we resorted to steam bending to achieve the curve for our trusses. This process involved splitting the 2x4 into two smaller joints because we were attempting to bend the wood along its long side, against the grain. As such, the wood also required a day of soaking in detergent, which made it more pliable.

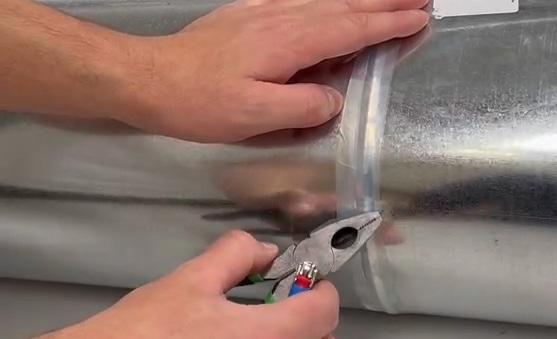

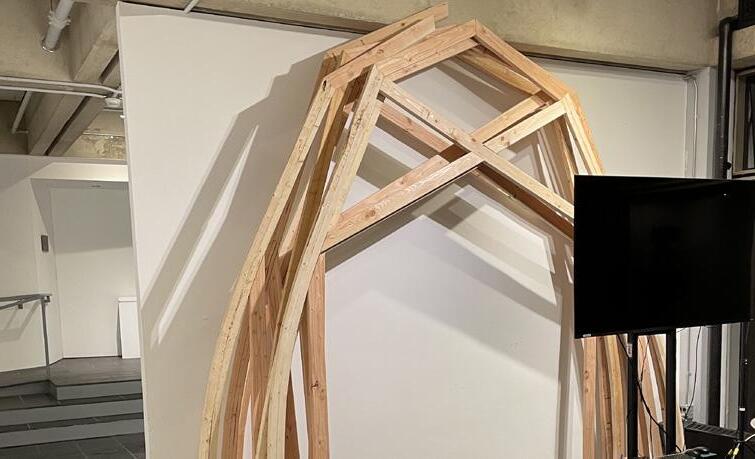
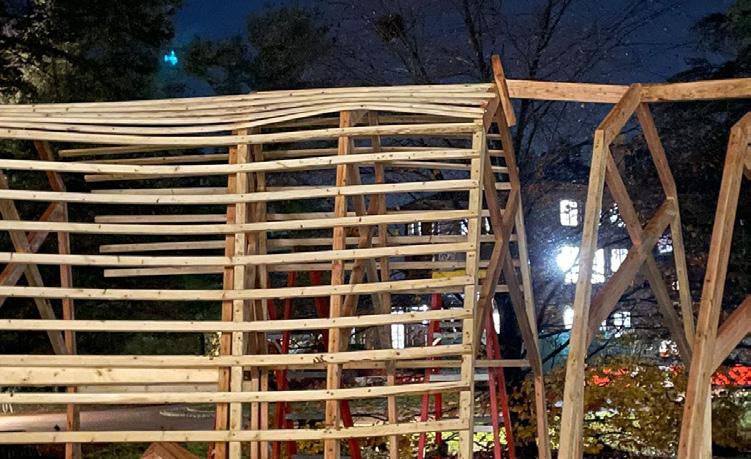
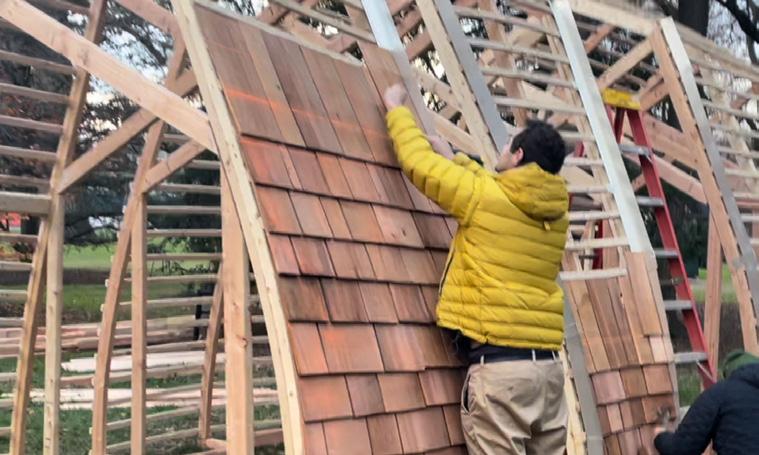
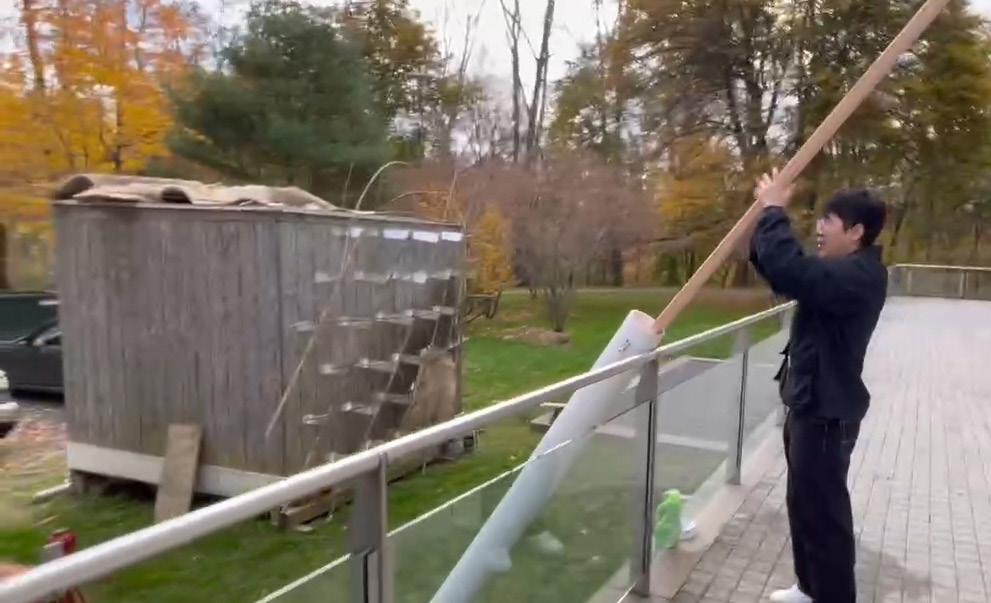


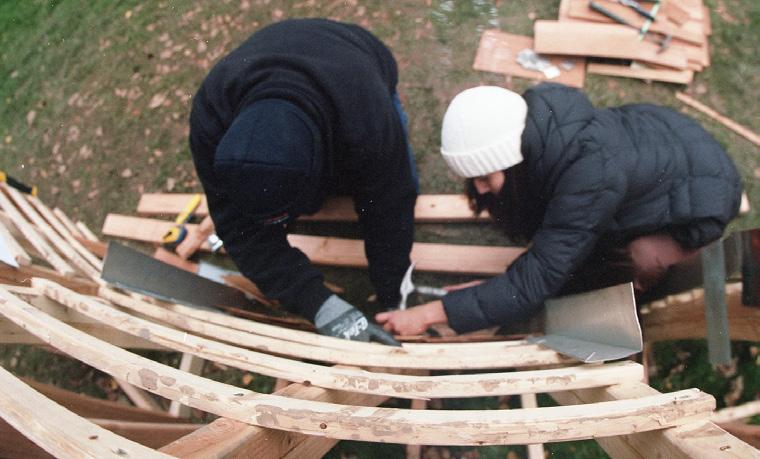
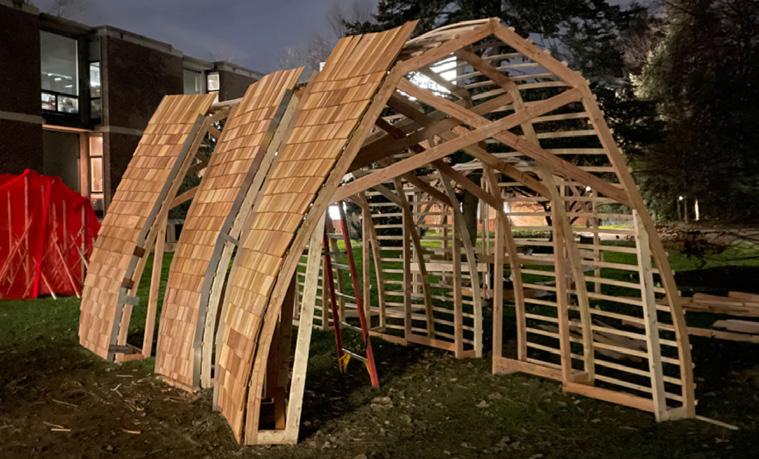

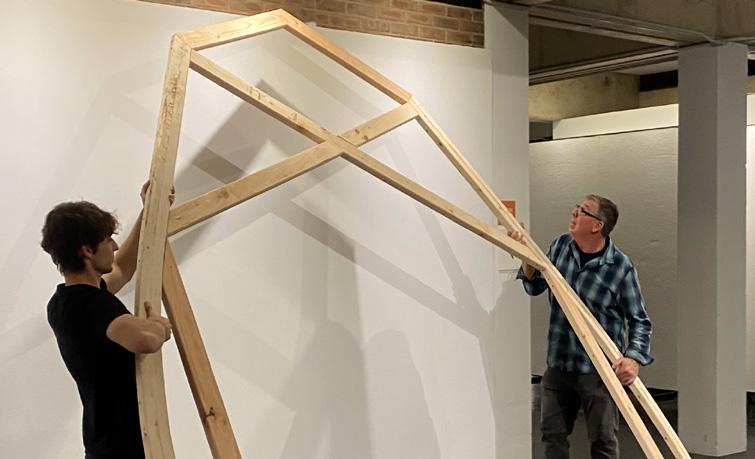
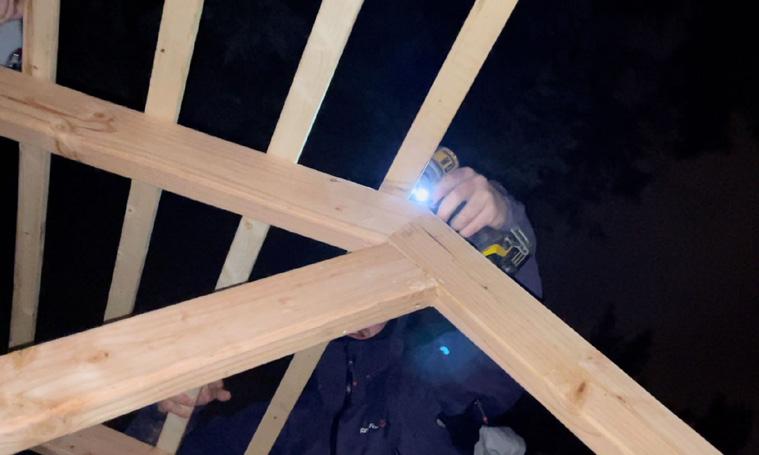
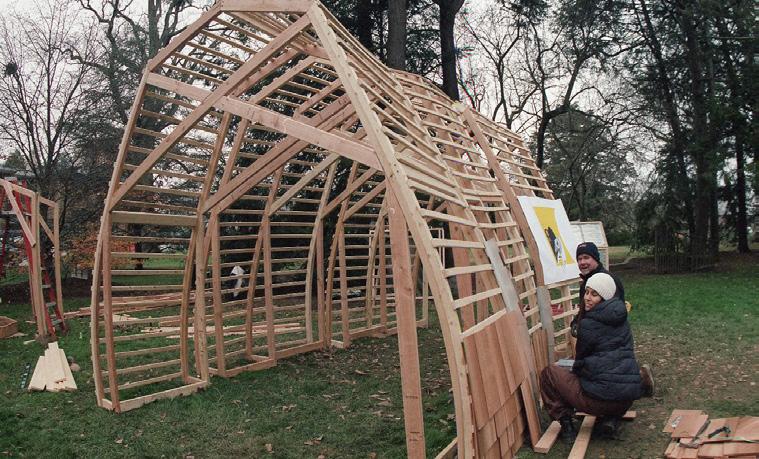

After it was bent, the wood needed to be clamped to a jig to obtain the curve and then screwed with other pieces that we had to angle and finagle with at the shop to create the trusses. Then we had to mark out the placement of the trusses on the ground, followed by the addition of a frame so that the singles could be attached. To build the frame, we found pliable weathering strips, which sometimes also required on-site steam bending to achieve the curve in plan. Furthermore, because of deadlines, we built our barn during the winter months at Princeton, frequently working through the night in rain, mud and chilly weather. Once we completed the frame, we started shingling the barn. We also installed metal plates so to weather proof each side of the modules. The barn was completed in March of 2024.
14.
Fabrication of the Barn: Assembly of Steam Bender, Splicing 2x4s, Soaking of Wood, Steam Bending, Clamping, Shingling
The Circular Tying of the Barn; Drawing by Kirill Volchinskiy

15.
The Trenton Barn Fully Assembled
Shingles at the Trenton Barn
Uncompromised Structural Joints Made Possible through Steam Bending

16.
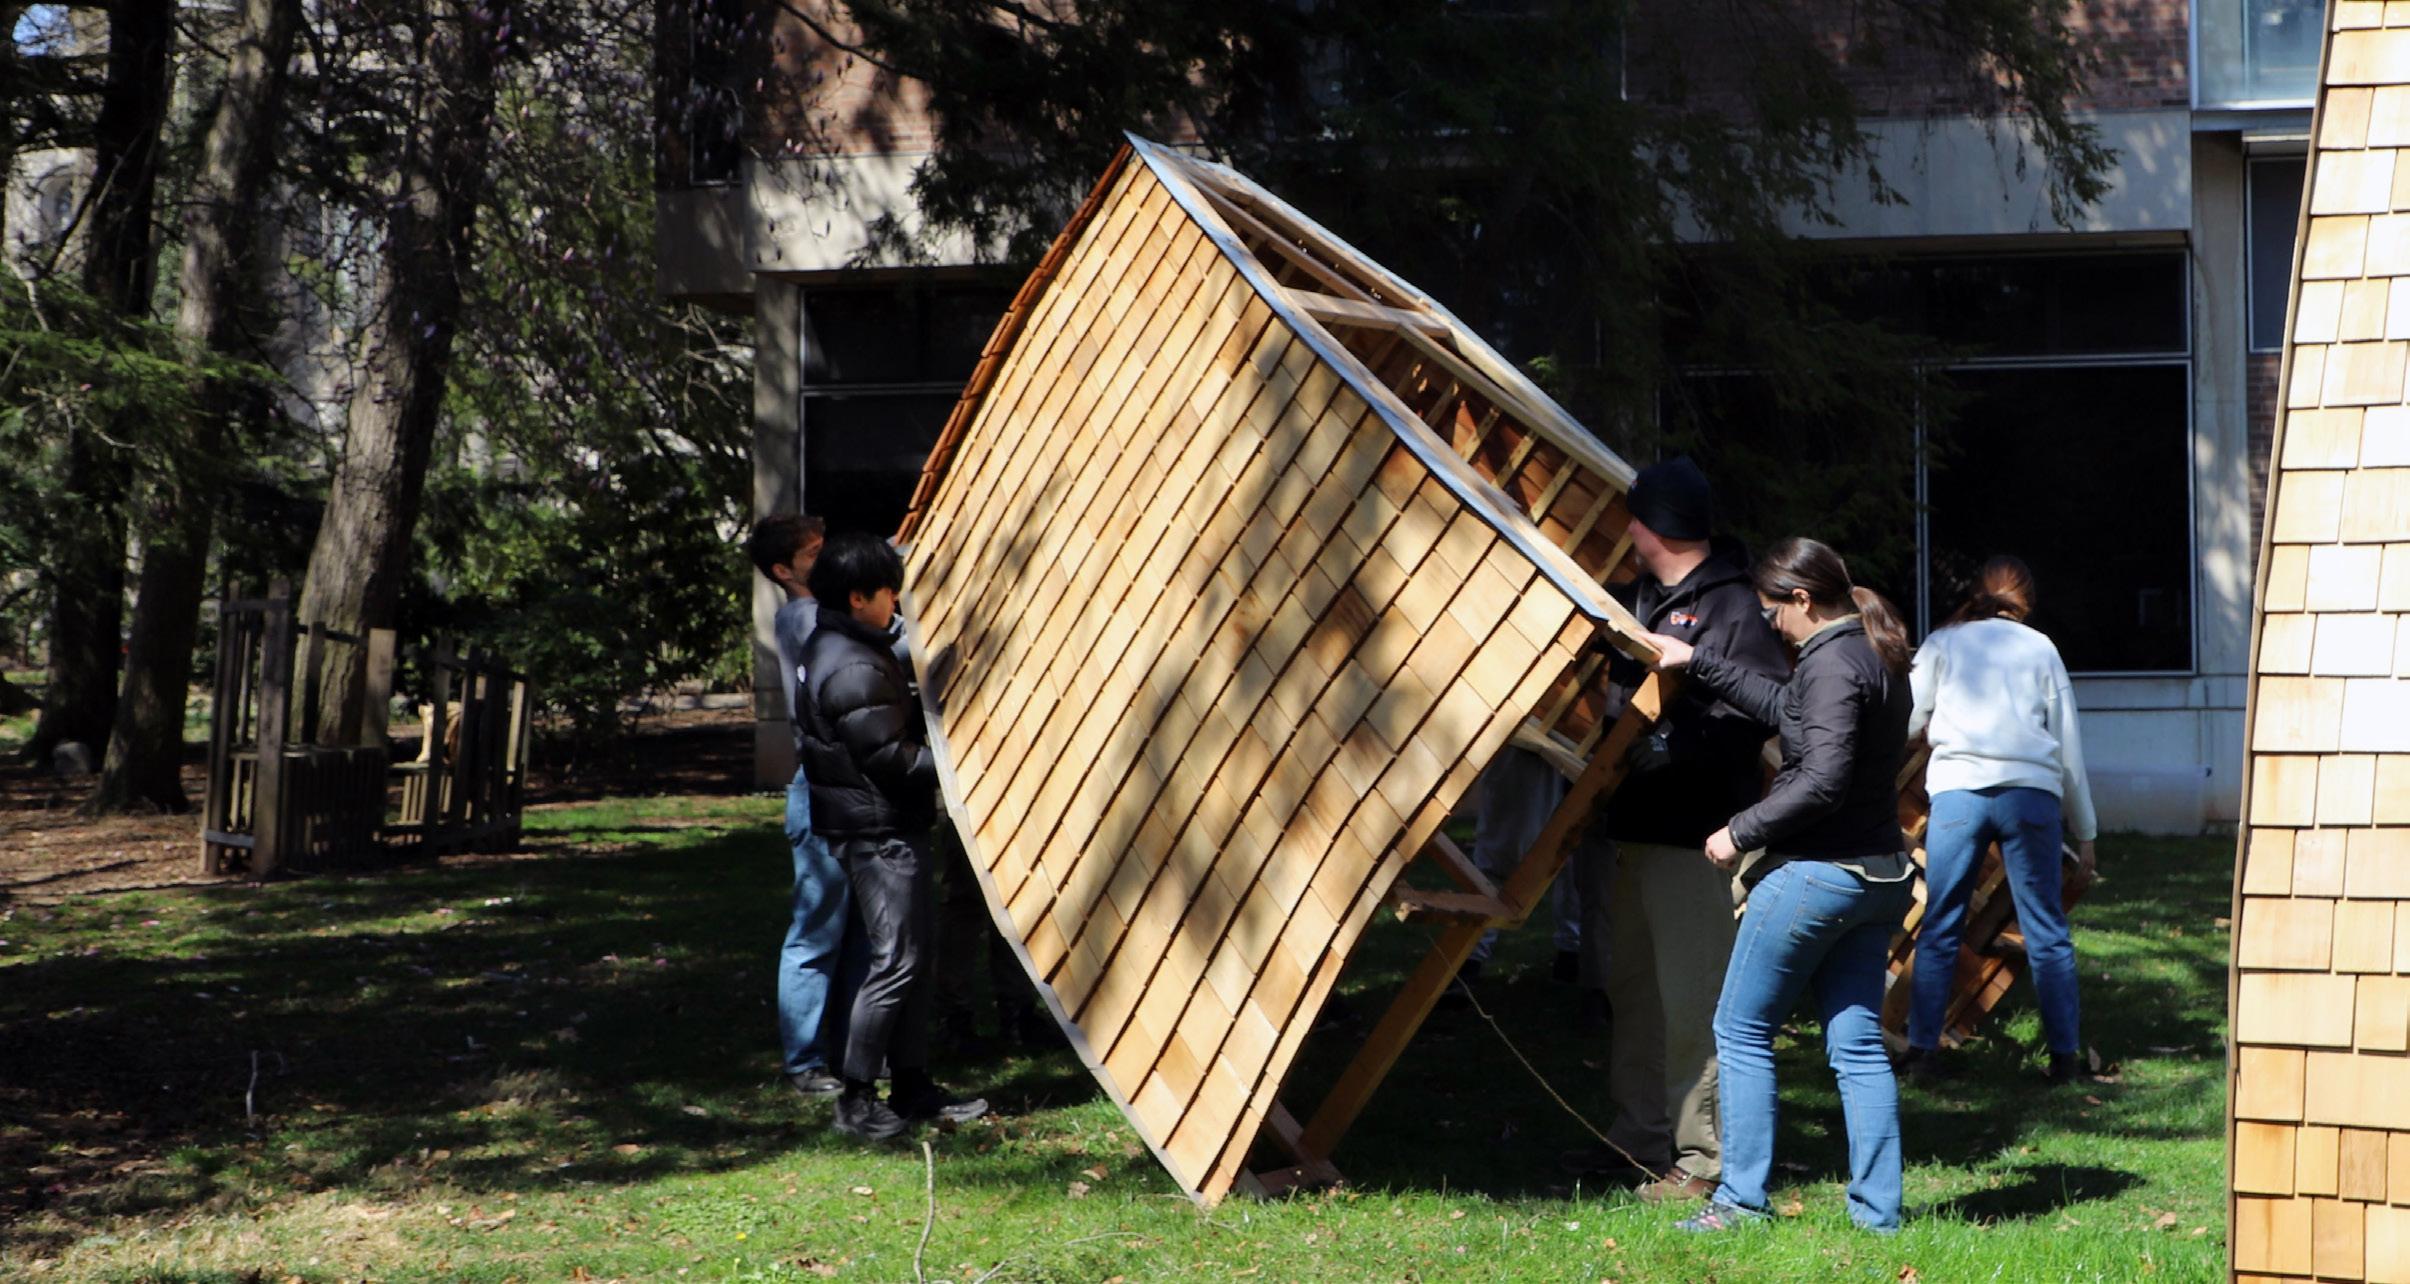
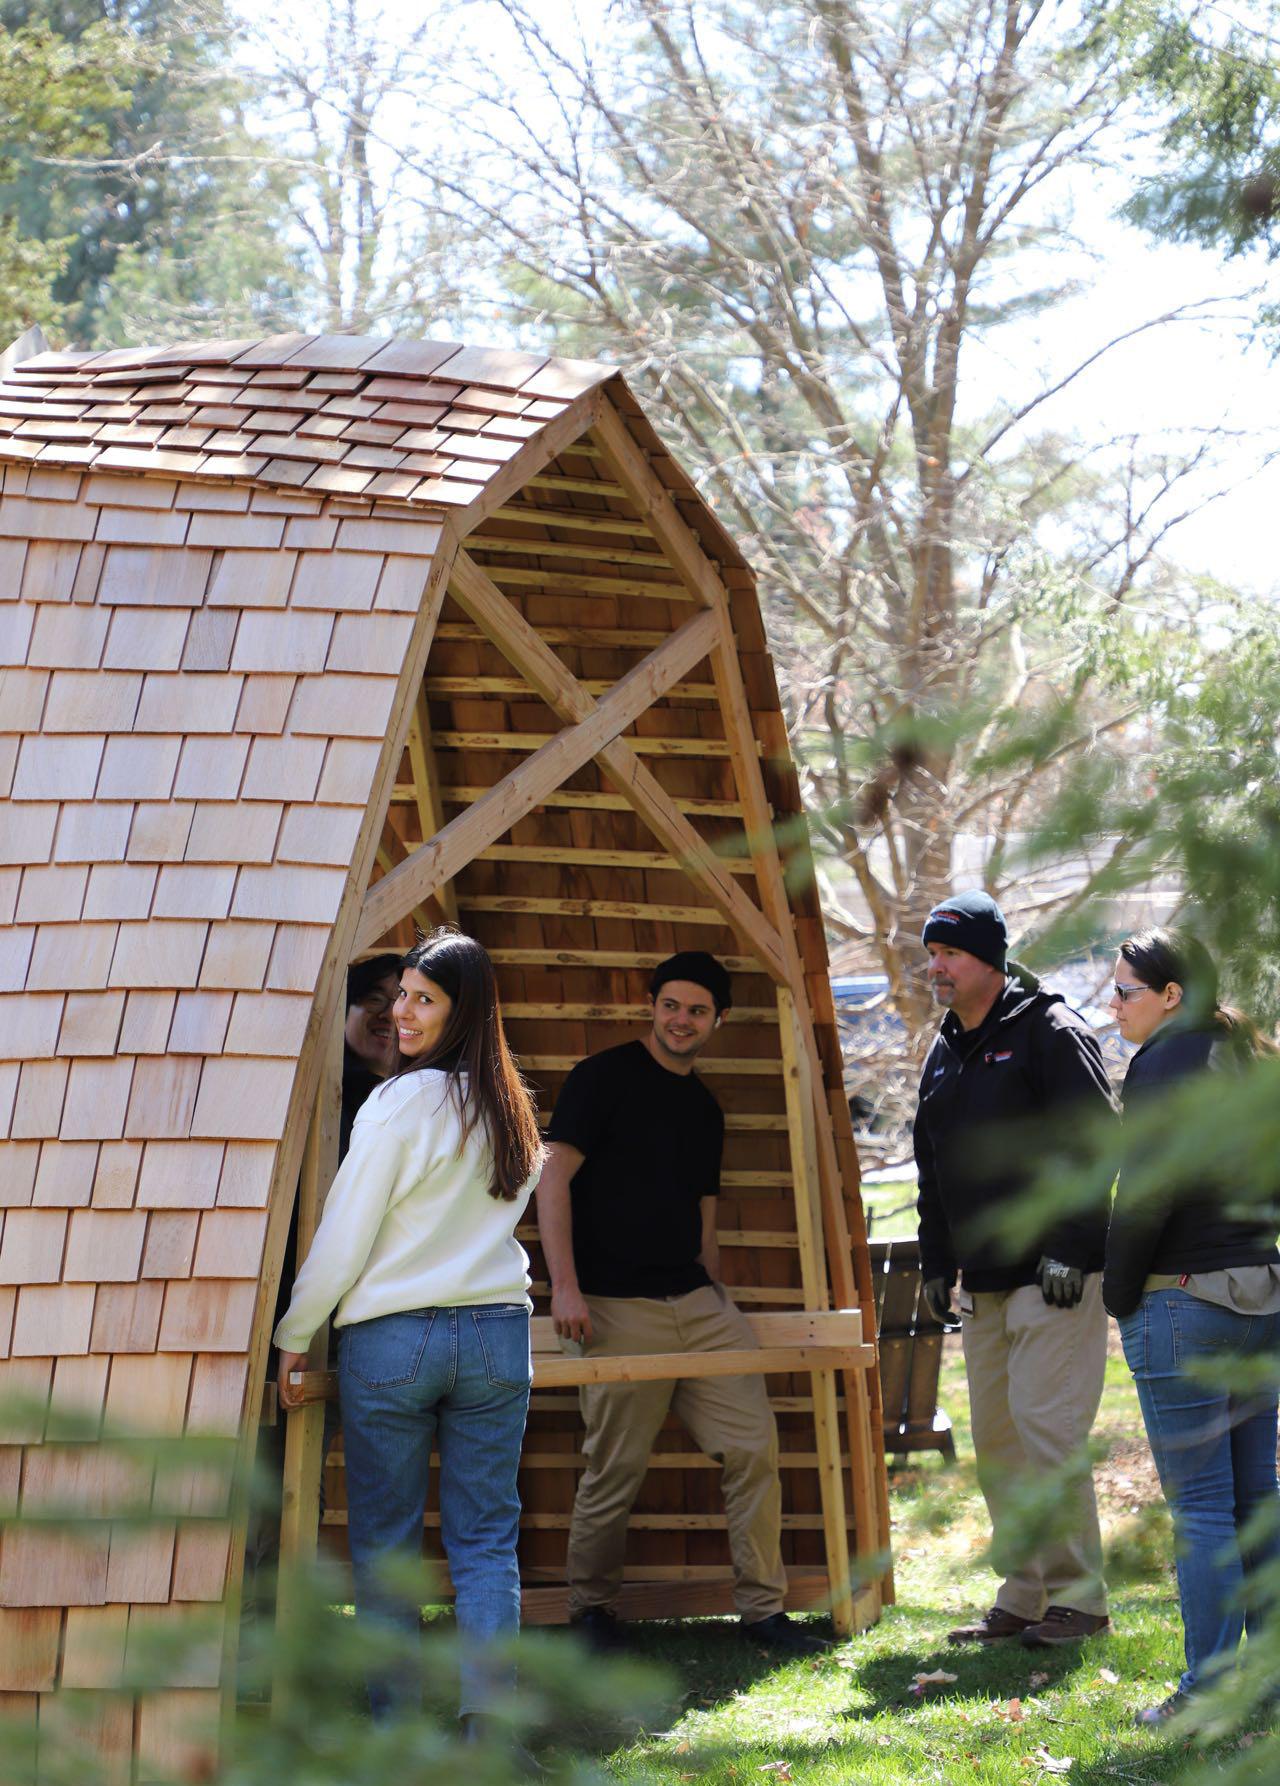
Attachment of 2x4 handles to Aid in Transport of Barn to Loading Truck
Turning the Barn so that it could be Lifted
Lifting the Barn under Historic Saucer Magnolia Tree
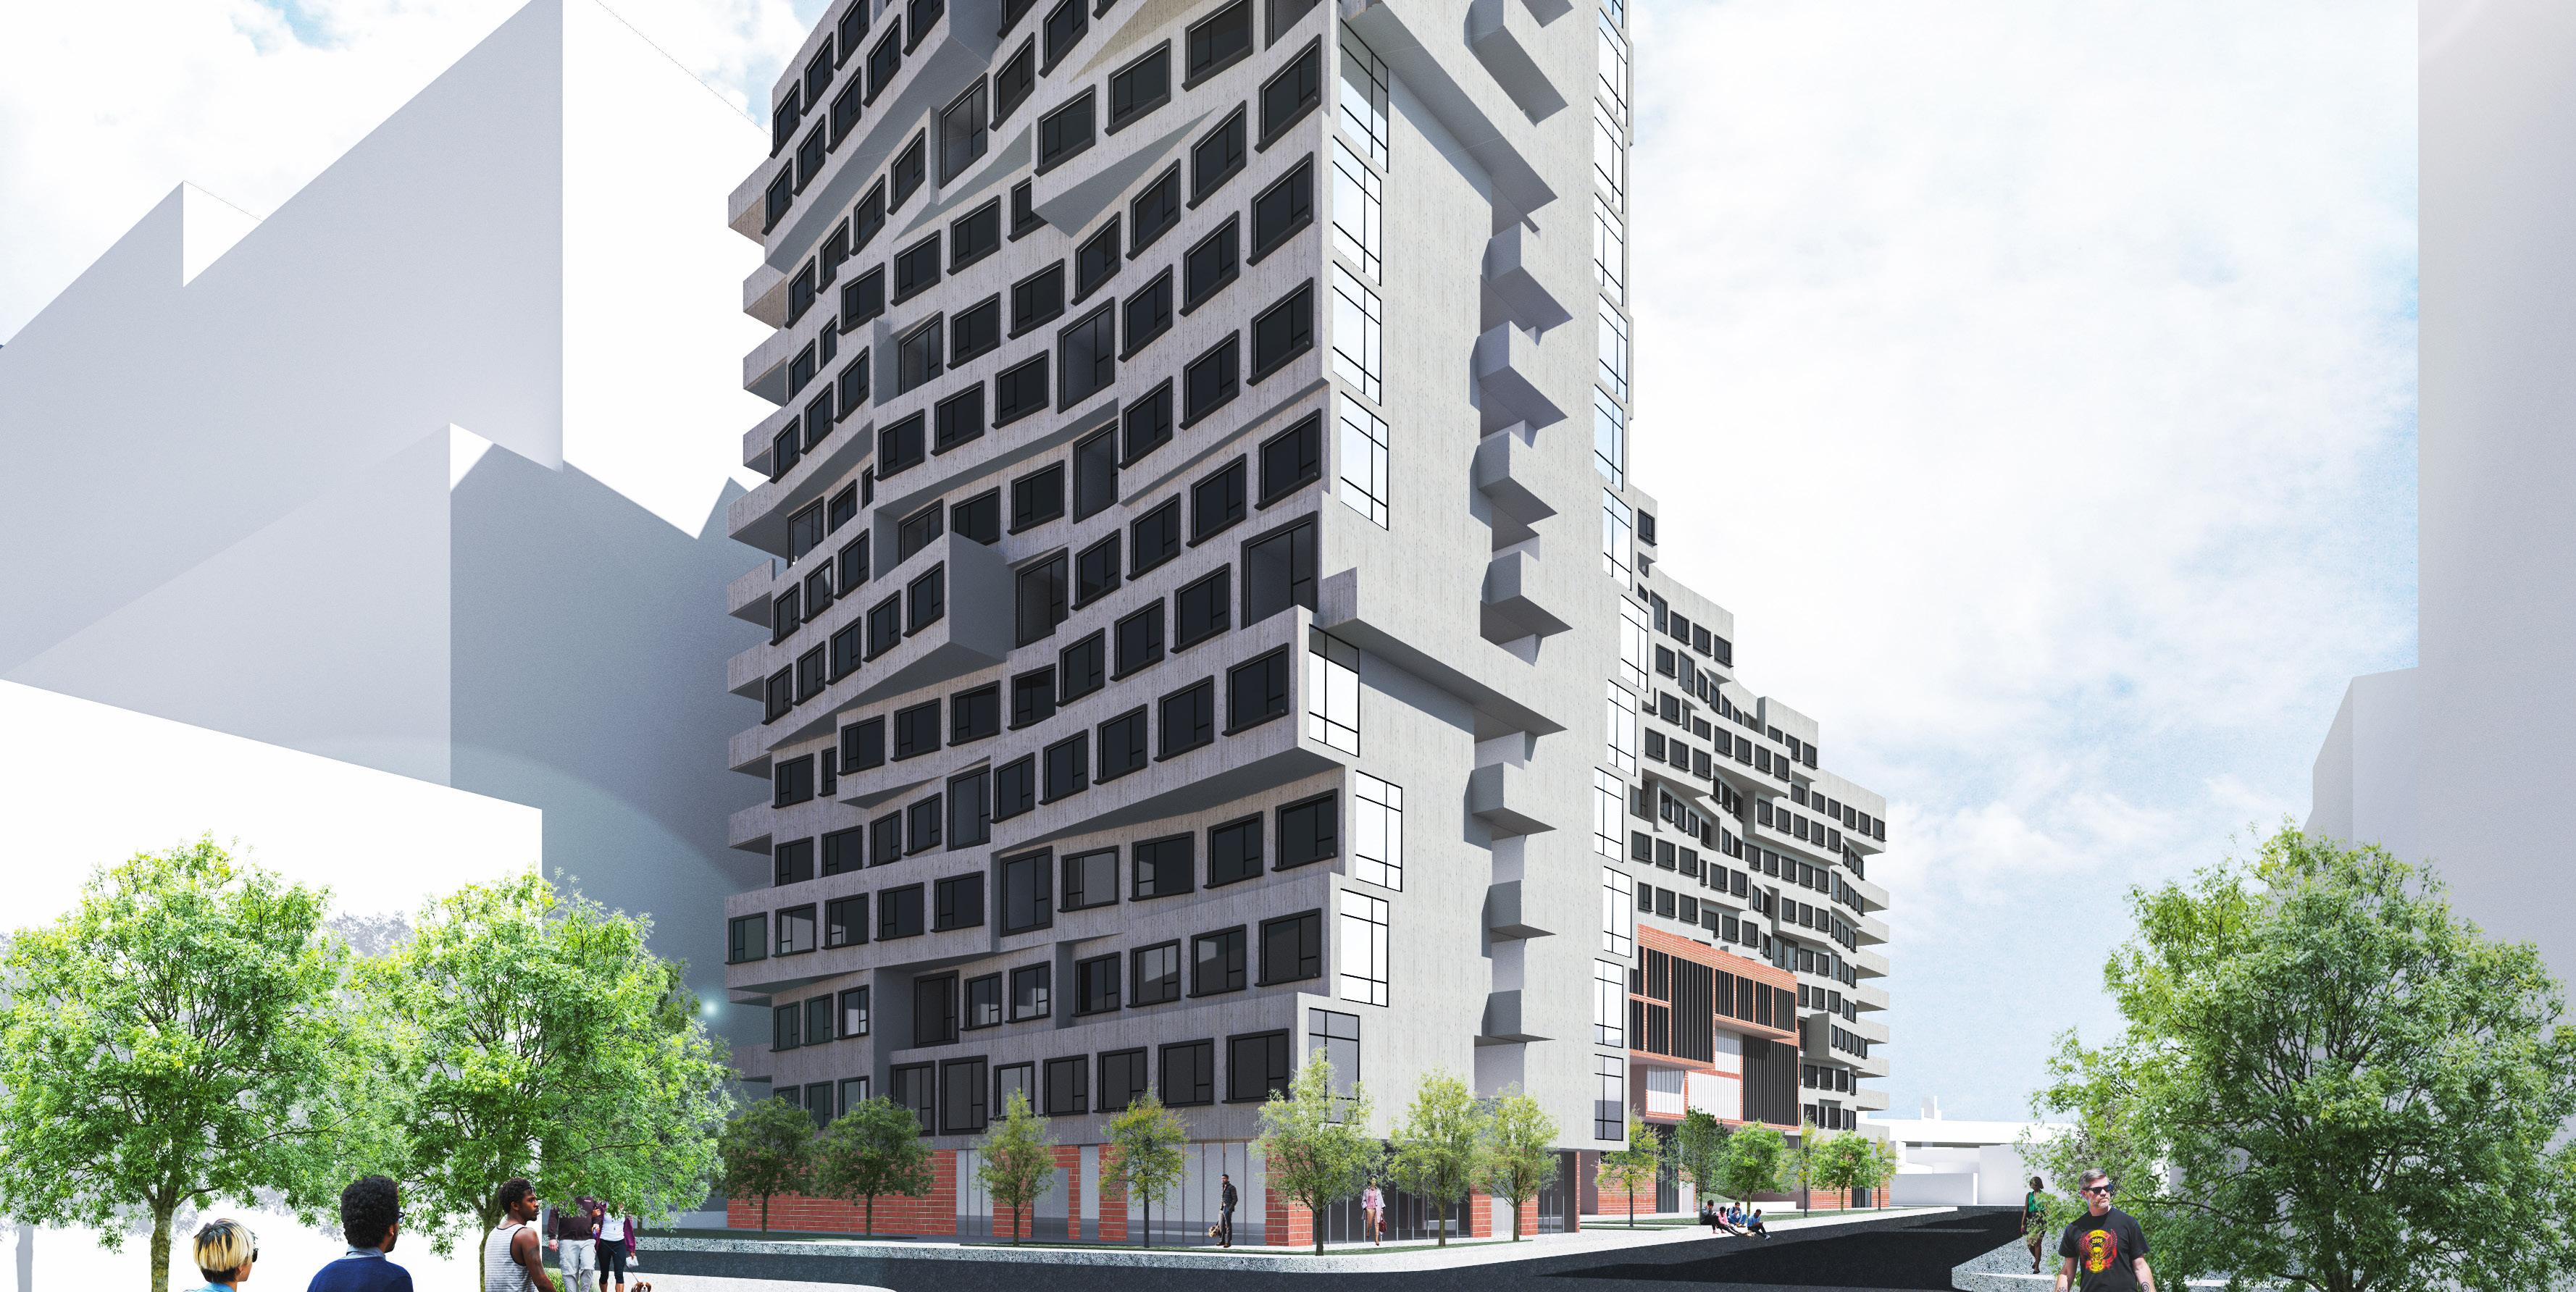
RE:HAVEN
Revitalizing Mott Haven Spring 2020

Type: Housing/Mixed Use
Location: New York City, New York
Category: Academic Work
Instructor: Angela Co
Role: Collaborative Work with Dara Jin
RE:Haven, a project done in collaboration with our New York Study Abroad Studio and a Real Estate Class, was an integrated studio that required a comprehensive understanding of architecture and real estate. We were tasked with developing a project that could take on the systemic issues in Mott Haven, follow New York zoning guidelines, and be economically viable. The duality of interests raised by the, at times, conflicting roles of the architect and developer presented an interesting challenge for us because the altruistic (and albeit slightly narcissistic) purpose that architects often envision themselves having is often limited by the pragmatic, monetarily driven field that is Real Estate.
[4]
17.
Understanding Mott Haven: Analysis of Mott Haven Demographics
RE:Haven // Mott Haven, New York
In Mott Haven, there is a 42% poverty rate, the median household income is only 25,489 dollars, and only 59% of the population has a high school diploma. In fact, Mott Haven has the lowest income and education rates while having the highest and obesity rates and exposure to pollution in the state of New York. These issues are only amplified by the high crime rate in Mott Haven. These issues, propogated by underlying institutional racism, have only pushed the wealth gap further apart.
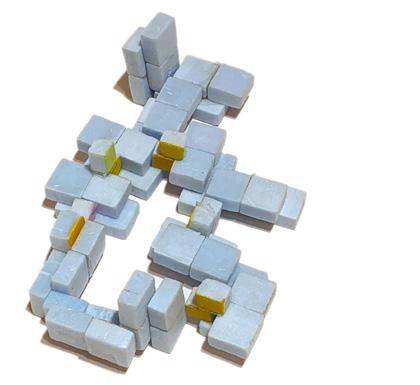


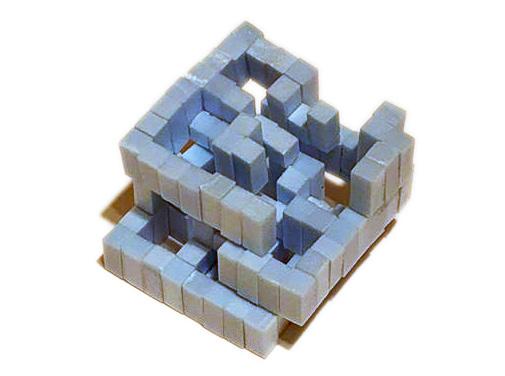
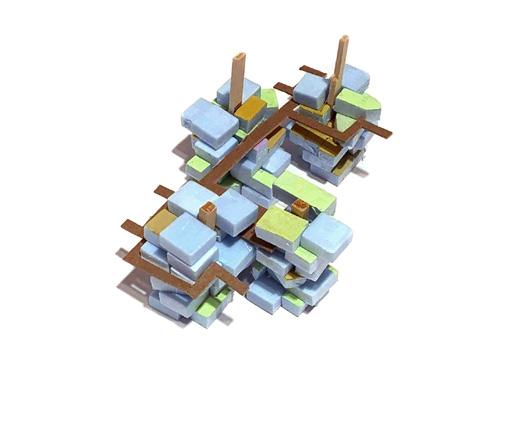

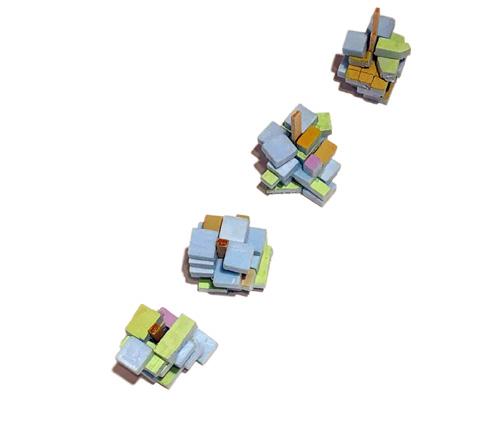
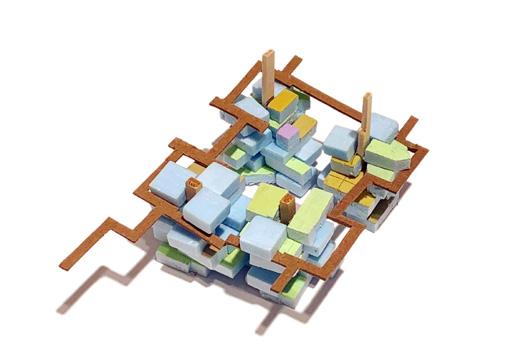
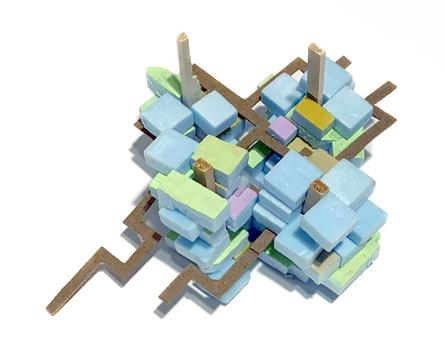
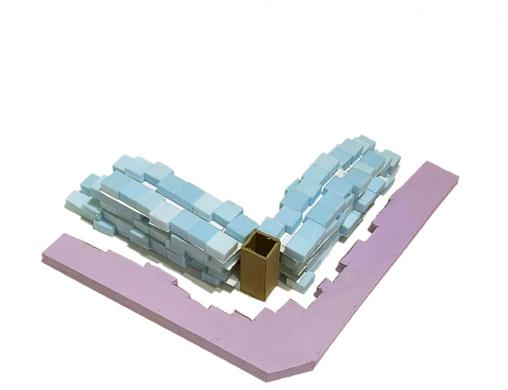
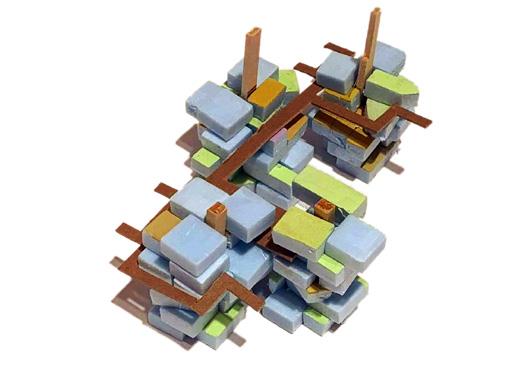
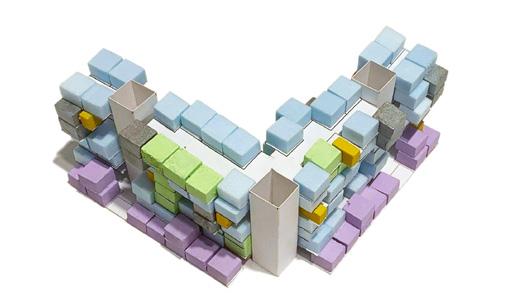
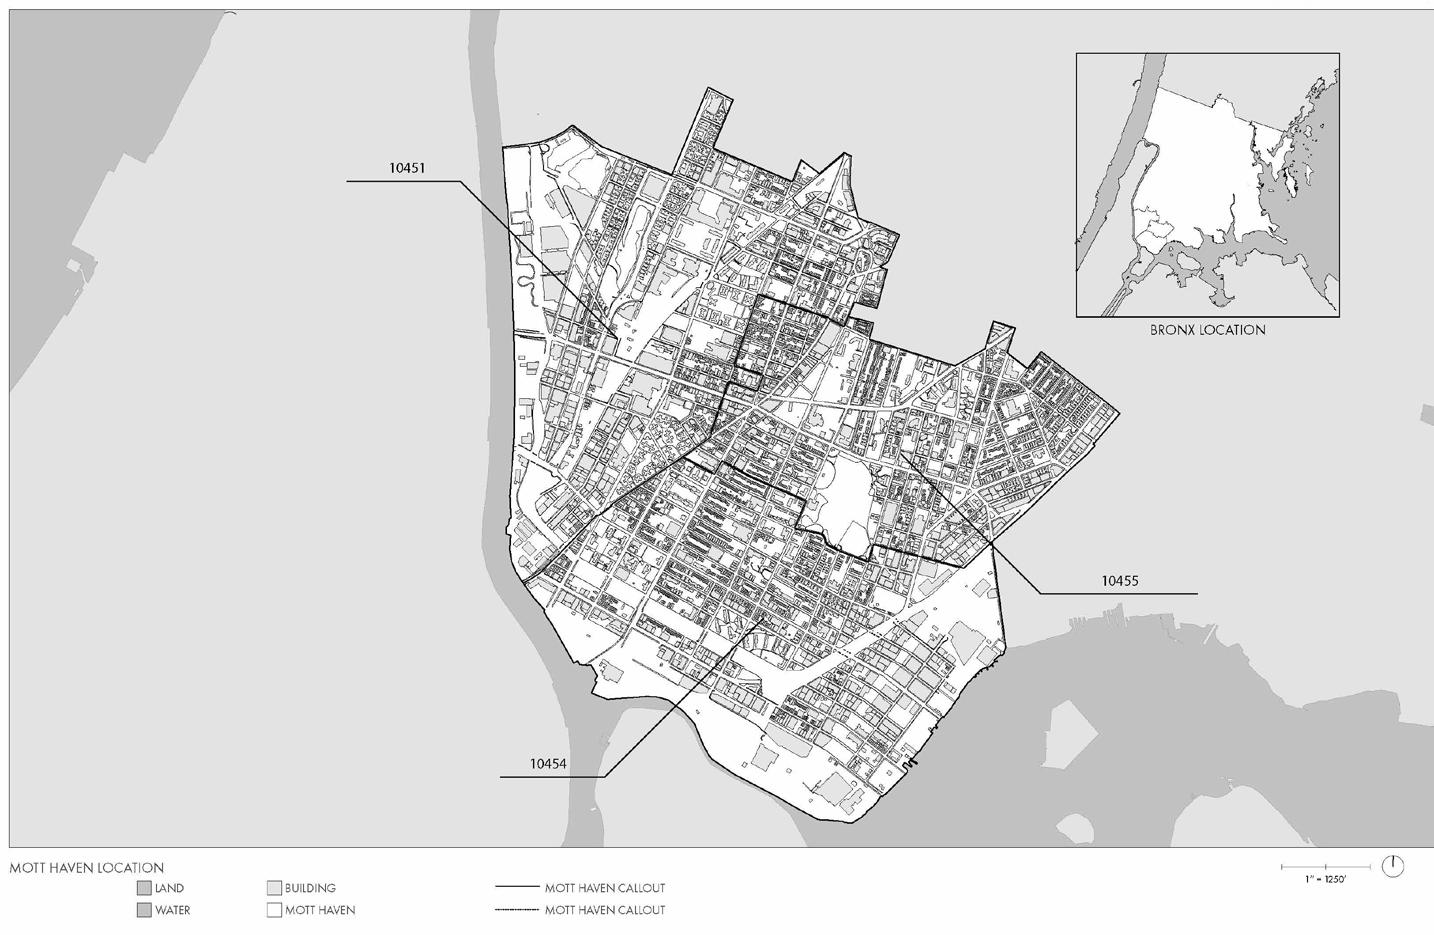

While it cannot be resolved in a single apartment design, architecture can act as the catalyst for change to begin to occur. Through research on alternative approaches to living such as communal housing, as well as modular housing units to make the price of living more affordable, my partner and I began imagining an affordable apartment complex that could act as a pivotal turning point for the revitalization of Mott Haven.
17.10% 14.30% 0.50% 13.20% 11.10% 15.40% 12.30% 12.70% 9.30% 2.10% Family Income 1999 2017 Less than $10,000 $10,000 $14,999 $15,000 24,999 $25,000 $34,999 $35,000 $49,999 $50,000 $74,999 $75,000 $99,999 $100,000 $149,999 $150,000 $199,999 $200,000 more 44.90% 14.00% 51.60% 24.50% 14.60% Owner Household Size 1999 vs 2017 1-person household 2-person household 3-person household 4-or-more-person household 29.90% 17.10% 30.50% 36.70% 22.60% 17.60% 23.10% Renter Household 1999 vs 2017 1-person household 2-person household 3-person household 4-or-more-person household 19.90% 24.90% 22.60% 17.50% 5.20% 6.60% 9.90% 16.60% 13.60% 26.30% 17.20% 7.40% 12.80% Educational Attainment 1999 vs 2017 Less than 9th Grade 9th 12th grade, diploma High school graduate/equal Some college, no degree Associate degree Bachelor's degree Graduate professional degree 7.90% 9.70% 9.20% 8.40% 7.30% 6.80% 7.00% 7.10% 6.60% 5.80% 5.40% 4.70% 3.20% 2.00% 1.20% 0.90% 6.50% 6.80% 7.10% 5.90% 5.20% 3.70% 2.70% 1.50% 1.70% Age 1999 vs 2017 Under years years 10 years 20 years 25 years 35 years 40 years 50 years 60 years 65 years 75 years 80 years 55.00% 45.00% 58.00% 42.00% Hispanic Population Percentage 1999 vs 2017 Hispanic or Latino Not Hispanic Latino 47.00% 60.20% Language 1999 vs 2017 English only Languages other than English 76.90% 7.70% 15.30% 68.30% Citizenship 1999 2017 Native Born US Foreign Born Citizen Foreign Born 95.20% 3.80% Occupancy 1999 2017 Occupied Vacant 11.90% 88.10% 14.00% 86.00% Owned VS. Rented 1999 2017 Owned Renter Occupied 22.20% 13.90% 21.10% 38.10% 25.70% 3.70% Occupation 1999 2017 Management, Professional and related occupations Service occupations Sales and office occupations Farming, Fishing, and Forestry Occupations Construction, Extraction, and Maintenance occupations Production, Transportation, and Material Moving Occupations 3.80% 7.20% 2.30% 10.40% 6.40% 3.00% 3.50% 1.70% 12.20% 12.50% 5.90% 5.70% Industry 1999 2017 Agriculture, Forestry, Fishing, Hunting, Mining 11.00% 16.10% 11.30% 9.20% 7.40% 2.60% 25.40% 13.90% 16.90% 12.70% 8.20% 4.20% 1.30% Household Income 1999 vs 2017 Less than $10,000 $10,000 $14,999 $15,000 24,999 $25,000 $34,999 $35,000 $49,999 $50,000 $74,999 $75,000 $99,999 $100,000 $149,999 $150,000 $199,999 $200,000 more 33.50% 13.20% 10.20% 3.40% 2.10% 0.20% 22.60% 10.10% 11.40% 15.60% 10.10% 5.60% 1.90% 1.10% Family Income 1999 2017 Less than $10,000 $10,000 $14,999 $15,000 24,999 $25,000 $34,999 $35,000 $49,999 $50,000 $74,999 $75,000 $99,999 $100,000 $149,999 $150,000 $199,999 $200,000 more 20.10% 14.70% 16.90% 30.80% 37.30% Owner Household Size 1999 vs 2017 1-person household 2-person household 3-person household 4-or-more-person household 29.50% 17.00% 33.50% 32.50% Renter Household 1999 2017 1-person household 2-person household 3-person household 4-or-more-person household 28.50% 29.30% 4.30% 1.90% 22.00% 20.30% 28.20% 5.40% 6.80% Educational Attainment 1999 2017 9th 12th grade, no diploma High school graduate/equal Some college, degree Associate degree Bachelor's degree Graduate professional degree 9.20% 10.90% 10.00% 7.00% 7.20% 6.20% 5.10% 4.80% 4.00% 2.80% 0.80% 0.60% 8.20% 9.00% 8.20% 9.60% 7.60% 8.00% 5.60% 5.30% 3.50% 2.10% 2.20% 1.00% Age 1999 vs 2017 Under years years years years years years years 69.50% 30.50% Hispanic Population Percentage 1999 vs 2017 Hispanic Latino Not Hispanic Latino 31.10% 34.20% Language 1999 vs 2017 English only Languages other than English 79.50% 5.60% 14.90% 17.70% Citizenship 1999 vs 2017 Native Born in US Foreign Born Citizen Foreign Born 9.50% 6.20% Occupancy 1999 2017 Occupied Vacant 4.60% 95.40% 5.50% 94.50% Owned VS. Rented 1999 vs 2017 Owned Renter Occupied 4.20% 9.40% 3.30% 10.10% 0.10% 4.70% 4.70% 1.10% 19.50% 6.50% 2.60% Industry 1999 vs 2017 Agriculture, Forestry, Fishing, Hunting, Mining 17.00% 9.00% 2.00% 19.30% 14.70% 12.70% 3.80% 0.90% Household Income 1999 vs 2017 Less than $10,000 $10,000 $14,999 $15,000 24,999 $25,000 $34,999 $35,000 $49,999 $50,000 $74,999 $75,000 $99,999 $100,000 $149,999 $150,000 $199,999 $200,000 more 18.10% 11.20% 10.90% 0.60% 15.50% 11.30% 15.90% 14.20% 15.20% 7.60% 4.00% 1.20% 1.00% Family Income 1999 2017 Less than $10,000 $10,000 $14,999 $15,000 24,999 $25,000 $34,999 $35,000 $49,999 $50,000 $74,999 $75,000 $99,999 $100,000 $149,999 $150,000 $199,999 $200,000 more 22.60% 40.60% 17.20% 24.30% 30.40% Owner Household Size 1999 2017 1-person household 2-person household 3-person household 4-or-more-person household 19.30% 34.00% 31.30% 21.00% Renter Household 1999 2017 1-person household 2-person household 3-person household 4-or-more-person household 27.20% 21.60% 3.90% 1.90% 20.40% 27.30% 5.30% Educational Attainment 1999 2017 9th 12th grade, no diploma High school graduate/equal Some college, degree Associate degree Bachelor's degree Graduate professional degree 8.90% 9.50% 8.90% 7.50% 6.70% 5.00% 3.50% 2.80% 1.90% 0.80% 0.50% 8.80% 8.20% 7.10% 6.20% 5.20% 4.30% 2.70% 1.60% Age 1999 2017 Under years years years years years years years years 25.30% 72.90% Hispanic Population Percentage 1999 2017 Hispanic Latino Not Hispanic Latino 30.80% 69.20% 27.60% Language 1999 2017 English only Languages other than English 73.40% 7.70% 20.10% Citizenship 1999 vs 2017 Native Born US Foreign Born Citizen Foreign Born 93.00% 7.00% 4.40% Occupancy 1999 2017 Occupied Vacant 7.40% 92.60% Owned VS. Rented 1999 vs 2017 Owned Renter Occupied 27.60% 0.40% 17.10% 8.30% 13.10% Occupation 1999 2017 Management, Professional and related occupations Service occupations Sales and office occupations Farming, Fishing, and Forestry Occupations Construction, Extraction, and Maintenance occupations Production, Transportation, and Material Moving Occupations 10.90% 4.00% 4.60% 5.00% 4.10% 2.80% 10.80% 2.70% Industry 1999 vs 2017 Agriculture, Forestry, Fishing, Hunting, Mining 13.80% 14.00% 14.20% 4.20% 13.50% 11.00% 13.10% 9.20% 8.70% 3.00% 2.20% Household Income 1999 vs 2017 Less than $10,000 $10,000 $14,999 $15,000 24,999 $25,000 $34,999 $35,000 $49,999 $50,000 $74,999 $75,000 $99,999 $100,000 $149,999 $150,000 $199,999 $200,000 more 20.50% 8.10% 14.30% 7.60% 5.20% 1.10% 7.30% 11.50% 13.90% 16.50% 10.20% 3.90% 2.70% Family Income 1999 vs 2017 Less than $10,000 $10,000 $14,999 $15,000 24,999 $25,000 $34,999 $35,000 $49,999 $50,000 $74,999 $75,000 $99,999 $100,000 $149,999 $150,000 $199,999 $200,000 more 24.10% 18.00% 30.20% 26.20% 27.50% 29.10% Owner Household Size 1999 2017 1-person household 2-person household 3-person household 4-or-more-person household 28.20% 18.80% 29.10% 31.10% 24.20% Renter Household 1999 2017 1-person household 2-person household 3-person household 4-or-more-person household 15.80% 5.40% 8.80% 5.90% 14.50% 27.60% 17.50% 12.50% 6.90% Educational Attainment 1999 2017 9th 12th grade, diploma High school graduate/equal Some college, no degree Associate degree Bachelor's degree Graduate professional degree 8.90% 9.50% 8.90% 7.50% 6.70% 5.00% 3.50% 2.80% 0.80% 0.50% 7.00% 7.00% 8.30% 7.30% 6.10% 6.50% 6.50% 3.70% 2.90% 2.20% 1.60% Age 1999 2017 Under years years years years years years years years years years years years 51.60% 55.70% 44.30% Hispanic Population Percentage 1999 2017 Hispanic Latino Not Hispanic Latino 52.70% 40.70% Language 1999 2017 English only Languages other than English 71.10% 17.50% 7.20% Citizenship 1999 vs 2017 Native Born Foreign Born Citizen Foreign Born 94.40% 5.60% Occupancy 1999 vs 2017 Occupied 19.60% 80.40% 19.70% Owned VS. Rented 1999 vs 2017 Owned Renter Occupied 26.60% 28.90% 0.10% 7.70% 25.00% 23.50% Occupation 1999 vs 2017 Management, Professional and related occupations Service occupations Sales and office occupations Farming, Fishing, and Forestry Occupations Construction, Extraction, and Maintenance occupations Production, Transportation, and Material Moving Occupations 4.50% 2.90% 9.90% 5.20% 0.10% 5.10% 3.50% 1.70% 11.50% 5.80% 3.70% Industry 1999 vs 2017 Agriculture, Forestry, Fishing, Hunting, Mining $0.00 $10,000.00 $20,000.00 10451 10454 10455 MOTT HAVEN BRONX NYC 0.00% 5.00% 10.00% 15.00% 10451 10454 10455 MOTT HAVEN BRONX NYC Single 0.00% 5.00% 10.00% 10451 10454 10455 MOTT HAVEN BRONX NYC Percentage 0.00% 10.00% 20.00% 10451 10454 10455 MOTT HAVEN BRONX NYC 0.00% 5.00% 10.00% 15.00% 10451 10454 10455 MOTT HAVEN BRONX NYC 0.00% 5.00% 10.00% 15.00% 10451 10454 10455 MOTT HAVEN BRONX NYC Percent of Population 0.00% 5.00% 10.00% MOTT HAVEN BRONX NYC BRONX NYC Incarceration DEMOGRAPHICS 10451 10454 10455 BRONX COUNTY 29.50% 12.20% 16.10% 12.10% 9.60% 1.70% 13.80% 14.80% 11.50% 15.60% 4.60% 1.90% Household Income 1999 2017 Less than $10,000 $10,000 $14,999 $15,000 24,999 $25,000 $34,999 $35,000 $49,999 $50,000 $74,999 $75,000 $99,999 $100,000 $149,999 $150,000 $199,999 $200,000 more 16.60% 26.60% 24.20% Occupation 1999 2017 Management, Professional and related occupations Service occupations Sales and office occupations Farming, Fishing, and Forestry Occupations Construction, Extraction, and Maintenance occupations Production, Transportation, and Material Moving Occupations HOUSEHOLD INCOME FAMILY INCOME OWNER HOUSEHOLD SIZE RENTER HOUSEHOLD SIZE EDUCATIONAL ATTAINMENT AGE DMEOGRAPHICS HISPANIC POPULATION LANGUAGE CITIZENSHIP OCCUPANCY OWNED VS RENTED HOMES OCCUPATION INDUSTRY 22.60% 19.90% 24.90% 22.60% 5.20% 6.60% 9.90% 13.60% 26.30% 17.20% 7.40% 12.80% 6.10% Educational Attainment 1999 2017 Less than 9th Grade 9th to 12th grade, no diploma High school graduate/equal Some college, no degree Associate degree Bachelor's degree Graduate or professional degree 7.90% 9.70% 9.20% 8.40% 7.30% 6.80% 7.00% 7.10% 6.60% 5.40% 4.70% 4.10% 1.20% 0.90% 8.00% 6.50% 6.80% 7.10% 5.90% 5.20% 4.60% 2.70% Age 1999 vs 2017 Under years years years years years years years years years years years years years Hispanic Population Percentage 1999 2017 Hispanic Latino Not Hispanic Latino 47.00% 53.00% 39.80% 60.20% Language 1999 2017 English only Languages other than English 68.30% 15.34% Citizenship 1999 2017 Native Born Foreign Born Citizen Foreign Born 95.20% 4.80% 96.20% 3.80% Occupancy 1999 vs 2017 Occupied 11.90% 88.10% 14.00% 86.00% Owned VS. Rented 1999 vs 2017 Owned Renter Occupied 22.20% 6.70% 13.90% 21.10% 38.10% 25.70% 11.40% Occupation 1999 vs 2017 Management, Professional and related occupations Service occupations Sales and office occupations Farming, Fishing, and Forestry Occupations Construction, Extraction, and Maintenance occupations Production, Transportation, and Material Moving Occupations 0.20% 2.30% 10.40% 7.20% 3.10% 7.40% 9.50% 7.50% 6.50% 12.20% 7.50% 1.90% 5.80% 30.90% 12.50% Industry 1999 2017 Agriculture, Forestry, Fishing, Hunting, Mining Manufacturing Professional, Scientific, Management, Administration, Waste Management Services Educational, Health, and Social Services Entertainment, Recreation, Accomodation and Other Services (except public administration) 4.89% 95.11% 99.83% Veteran Status 1999 vs 2017 32.71% 82.50% Disabled Population 1999 vs 2017 Not Disabled 38.50% 61.50% 35.60% Poverty Level 1999 2017 below poverty not below poverty 17.00% 29.30% 20.20% 4.80% 8.60% 4.30% 1.90% 15.00% 5.40% 6.80% Educational Attainment 1999 2017 Less than 9th Grade 9th 12th grade, no diploma High school graduate/equal Some college, degree Associate degree Bachelor's degree Graduate professional degree 9.20% 10.90% 10.00% 7.00% 7.20% 4.80% 3.70% 2.80% 2.00% 0.60% 8.60% 9.00% 8.20% 9.60% 7.60% 8.00% 5.60% 5.30% 4.60% 3.50% 2.10% 1.90% 1.20% Age 1999 2017 years years years years years 73.20% 26.80% 69.50% Hispanic Population Percentage 1999 2017 Hispanic Latino Not Hispanic Latino 31.10% Language 1999 2017 English only Languages other than English 14.90% 72.00% 10.30% 17.70% Citizenship 1999 vs 2017 Native Born US Foreign Born Citizen Foreign Born 9.50% 6.20% Occupancy 1999 2017 Occupied 5.50% 94.50% Owned VS. Rented 1999 vs 2017 Owned Renter Occupied 0.20% 1.40% 25.20% 6.40% 4.90% 4.70% 14.60% 7.20% 4.70% 8.00% 24.90% 19.50% 2.60% Industry 1999 vs 2017 Agriculture, Forestry, Fishing, Hunting, Mining Manufacturing Professional, Scientific, Management, Administration, Waste Management Services Educational, Health, and Social Services Arts, Entertainment, Recreation, Accomodation Other Services (except public administration) 4.30% 95.70% 1.80% 98.20% Veteran Status 1999 vs 2017 34.14% 65.86% 82.50% Disabled Population 1999 2017 Not Disabled 48.40% 51.60% 46.40% 53.60% Poverty Level 1999 vs 2017 below poverty not below poverty 19.30% 21.00% 28.40% 3.90% 15.50% 5.30% 8.40% Educational Attainment 1999 2017 9th 12th grade, no diploma High school graduate/equal Some college, degree Associate degree Bachelor's degree Graduate professional degree 8.90% 10.20% 9.50% 8.90% 7.50% 6.70% 4.20% 1.40% 0.50% 8.70% 7.10% 6.00% 2.70% 1.60% 1.10% Age 1999 vs 2017 years years years years years years years 74.70% 25.30% Hispanic Population Percentage 1999 vs 2017 Hispanic or Latino Not Hispanic Latino 30.80% 27.60% Language 1999 vs 2017 English only Languages other than English 73.40% 7.70% 66.00% 13.90% Citizenship 1999 vs 2017 Native Born US Foreign Born Citizen Foreign Born 93.00% 95.60% 4.40% Occupancy 1999 2017 Occupied 6.80% 93.20% Owned VS. Rented 1999 vs 2017 Owned Renter Occupied 15.30% 27.60% 0.40% 8.40% 17.90% 17.10% Occupation 1999 2017 Management, Professional and related occupations Service occupations Sales and office occupations Farming, Fishing, and Forestry Occupations Construction, Extraction, and Maintenance occupations Production, Transportation, and Material Moving Occupations 0.40% 10.90% 4.00% 11.40% 6.10% 2.10% 8.00% 23.10% 8.50% 6.90% 5.00% 4.10% 2.80% 10.80% 6.50% 0.50% 7.30% 8.80% 26.90% 17.90% 2.70% Industry 1999 vs 2017 Agriculture, Forestry, Fishing, Hunting, Mining Manufacturing Professional, Scientific, Management, Administration, Waste Management Services Educational, Health, Social Services Arts, Entertainment, Recreation, Accomodation Other Services (except public administration) 3.80% 96.20% 98.20% Veteran Status 1999 2017 27.67% 15.70% 84.30% Disabled Population 1999 2017 Disabled Not Disabled 24.20% 18.70% 21.90% 25.80% 16.40% 8.80% 5.90% 14.50% 14.00% 27.60% 17.50% 12.50% 6.90% Educational Attainment 1999 vs 2017 9th to 12th grade, diploma High school graduate/equal Some college, no degree Associate degree Bachelor's degree Graduate or professional degree 8.90% 10.20% 9.50% 8.90% 7.50% 6.70% 4.20% 3.50% 1.40% 0.50% 7.40% 6.70% 7.00% 8.30% 7.30% 6.10% 6.50% 5.60% 4.90% 1.40% Age 1999 vs 2017 Under years 10 14 years 15 19 years 25 29 years 30 34 years 35 39 years 40 44 years 50 54 years 55 59 years 60 64 years 65 69 years 75 79 years 80 84 years 48.40% 51.60% 44.30% Hispanic Population Percentage 1999 2017 Hispanic Latino Not Hispanic or Latino 47.30% 52.70% 40.70% Language 1999 vs 2017 English only Languages other than English 11.40% 17.50% 80.60% 12.20% 7.20% Citizenship 1999 2017 Native Born US Foreign Born Citizen Foreign Born 94.40% 5.60% 5.60% Occupancy 1999 vs 2017 Occupied 80.30% Owned VS. Rented 1999 2017 Owned Renter Occupied 26.60% 28.90% 7.70% 25.00% 11.10% Occupation 1999 vs 2017 Management, Professional and related occupations Service occupations Sales and office occupations Farming, Fishing, and Forestry Occupations Construction, Extraction, and Maintenance occupations Production, Transportation, and Material Moving Occupations 0.10% 2.90% 9.90% 6.80% 8.70% 8.60% 7.30% 6.10% 5.10% 3.50% 1.70% 7.20% 1.70% 32.40% 12.20% 5.80% 3.70% Industry 1999 2017 Agriculture, Forestry, Fishing, Hunting, Mining Manufacturing Professional, Scientific, Management, Administration, Waste Management Services Educational, Health, Social Services Entertainment, Recreation, Accomodation and Other Services (except public administration) 5.80% 94.20% 97.50% Veteran Status 1999 2017 71.58% 14.60% 85.40% Disabled Population 1999 vs 2017 Not Disabled 30.70% 69.30% 70.30% Poverty Level 1999 2017 below poverty below poverty 0.00% 5.00% 10.00% 10451 10454 10455 MOTT HAVEN BRONX 0.00% 10.00% 20.00% 10451 10454 10455 MOTT HAVEN BRONX NYC 0.00% 5.00% 10.00% 15.00% 10451 10454 10455 MOTT HAVEN BRONX NYC 0.00% 5.00% 10.00% 15.00% 10451 10454 10455 MOTT HAVEN BRONX NYC Percent of Population 0.00% 5.00% 10.00% MOTT HAVEN BRONX NYC 50 100 MOTT HAVEN BRONX NYC Incarceration 7.5 MOTT HAVEN BRONX NYC Pollution 26.60% 24.20% Occupation 1999 2017 Management, Professional and related occupations Service occupations Sales and office occupations Farming, Fishing, and Forestry Occupations Construction, Extraction, and Maintenance occupations Production, Transportation, and Material Moving Occupations 41.80% Poverty Level 1999 vs 2017 below poverty not below poverty 20 40 60 MOTT HAVEN BRONX NYC Supermarket RENTER EDUCATIONAL ATTAINMENT AGE DMEOGRAPHICS HISPANIC POPULATION LANGUAGE CITIZENSHIP OCCUPANCY OWNED VS RENTED HOMES OCCUPATION INDUSTRY VETERAN STATUS DISABLED POPULATION POVERTY LEVEL Mott Haven Demographics Gathered by Andrew Yu 18. RE:Haven Study Models Made by Andrew Yu and Dara Jin Mott Haven Zip Code Map Drawn by Andrew Yu Mott Haven Income Map Drawn by Andrew Yu
Designing for Mott Haven: A Community Oriented Approach
RE:Haven // Mott Haven, New York
RE:Haven sets out to create a lot more open space, develop a new community hub, bring in more green space, address systemic problems by creating a safer and more welcoming community, repurpose spaces without dislocating previous tenants, and provide amenities that are easily accessible and helpful to the community.


RE:Haven Typical Floor Plan
40% of the apartments were allocated to supportive housing. As for the designation of program, the first floor was designated for the aforementioned public programs, the second through fourth floors were a mix of commercial program and residential units, and the fifth through fourteenth floor were designated for residential units. Furthermore, each unit was designed with maximum efficiency in mind.
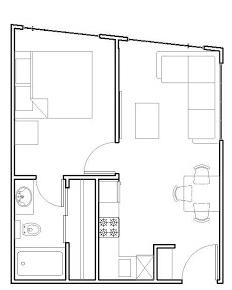
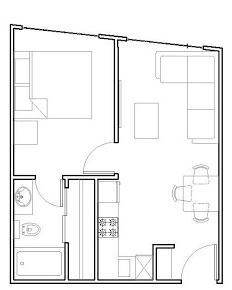


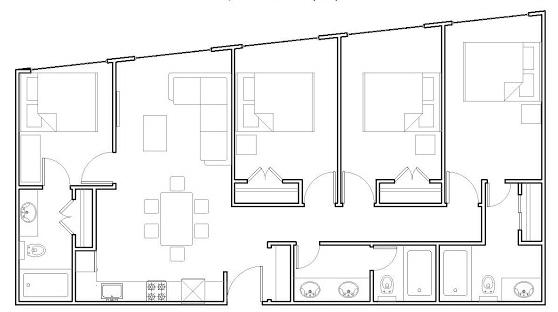

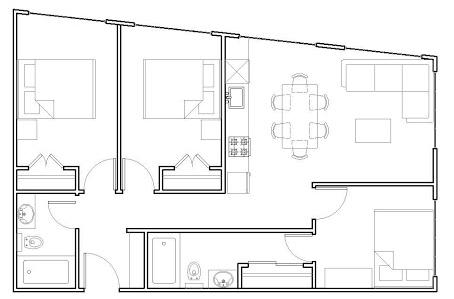
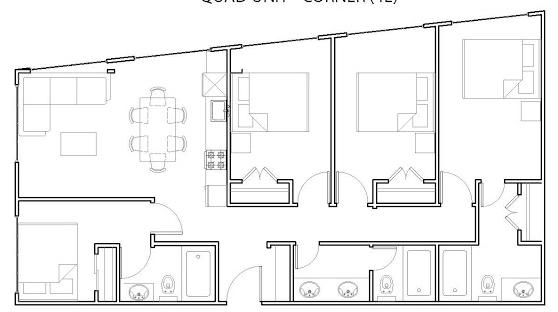
Typical and Corner Studio Unit Drawn by Andrew Yu Typical and Corner Two Bedroom Unit Drawn by Andrew Yu Typical and Corner Three Bedroom Unit Drawn by Andrew Yu Typical and Corner Four Bedroom Unit Drawn by Andrew Yu
Sectional Perspective Drawn in Collaboration with Dara jin
19.
Elevation Drawn in Collaboration with Dara Jin
The Communal / Void Spaces
RE:Haven // Mott Haven, New York
Within each floor we designed void spaces in between apartments; these spaces ranged from 10 feet by 24 feet to 20 feet by 24 feet. These shared spaces were meant to have a flexible and adaptable program, fitted to the requirements and desires of the community.
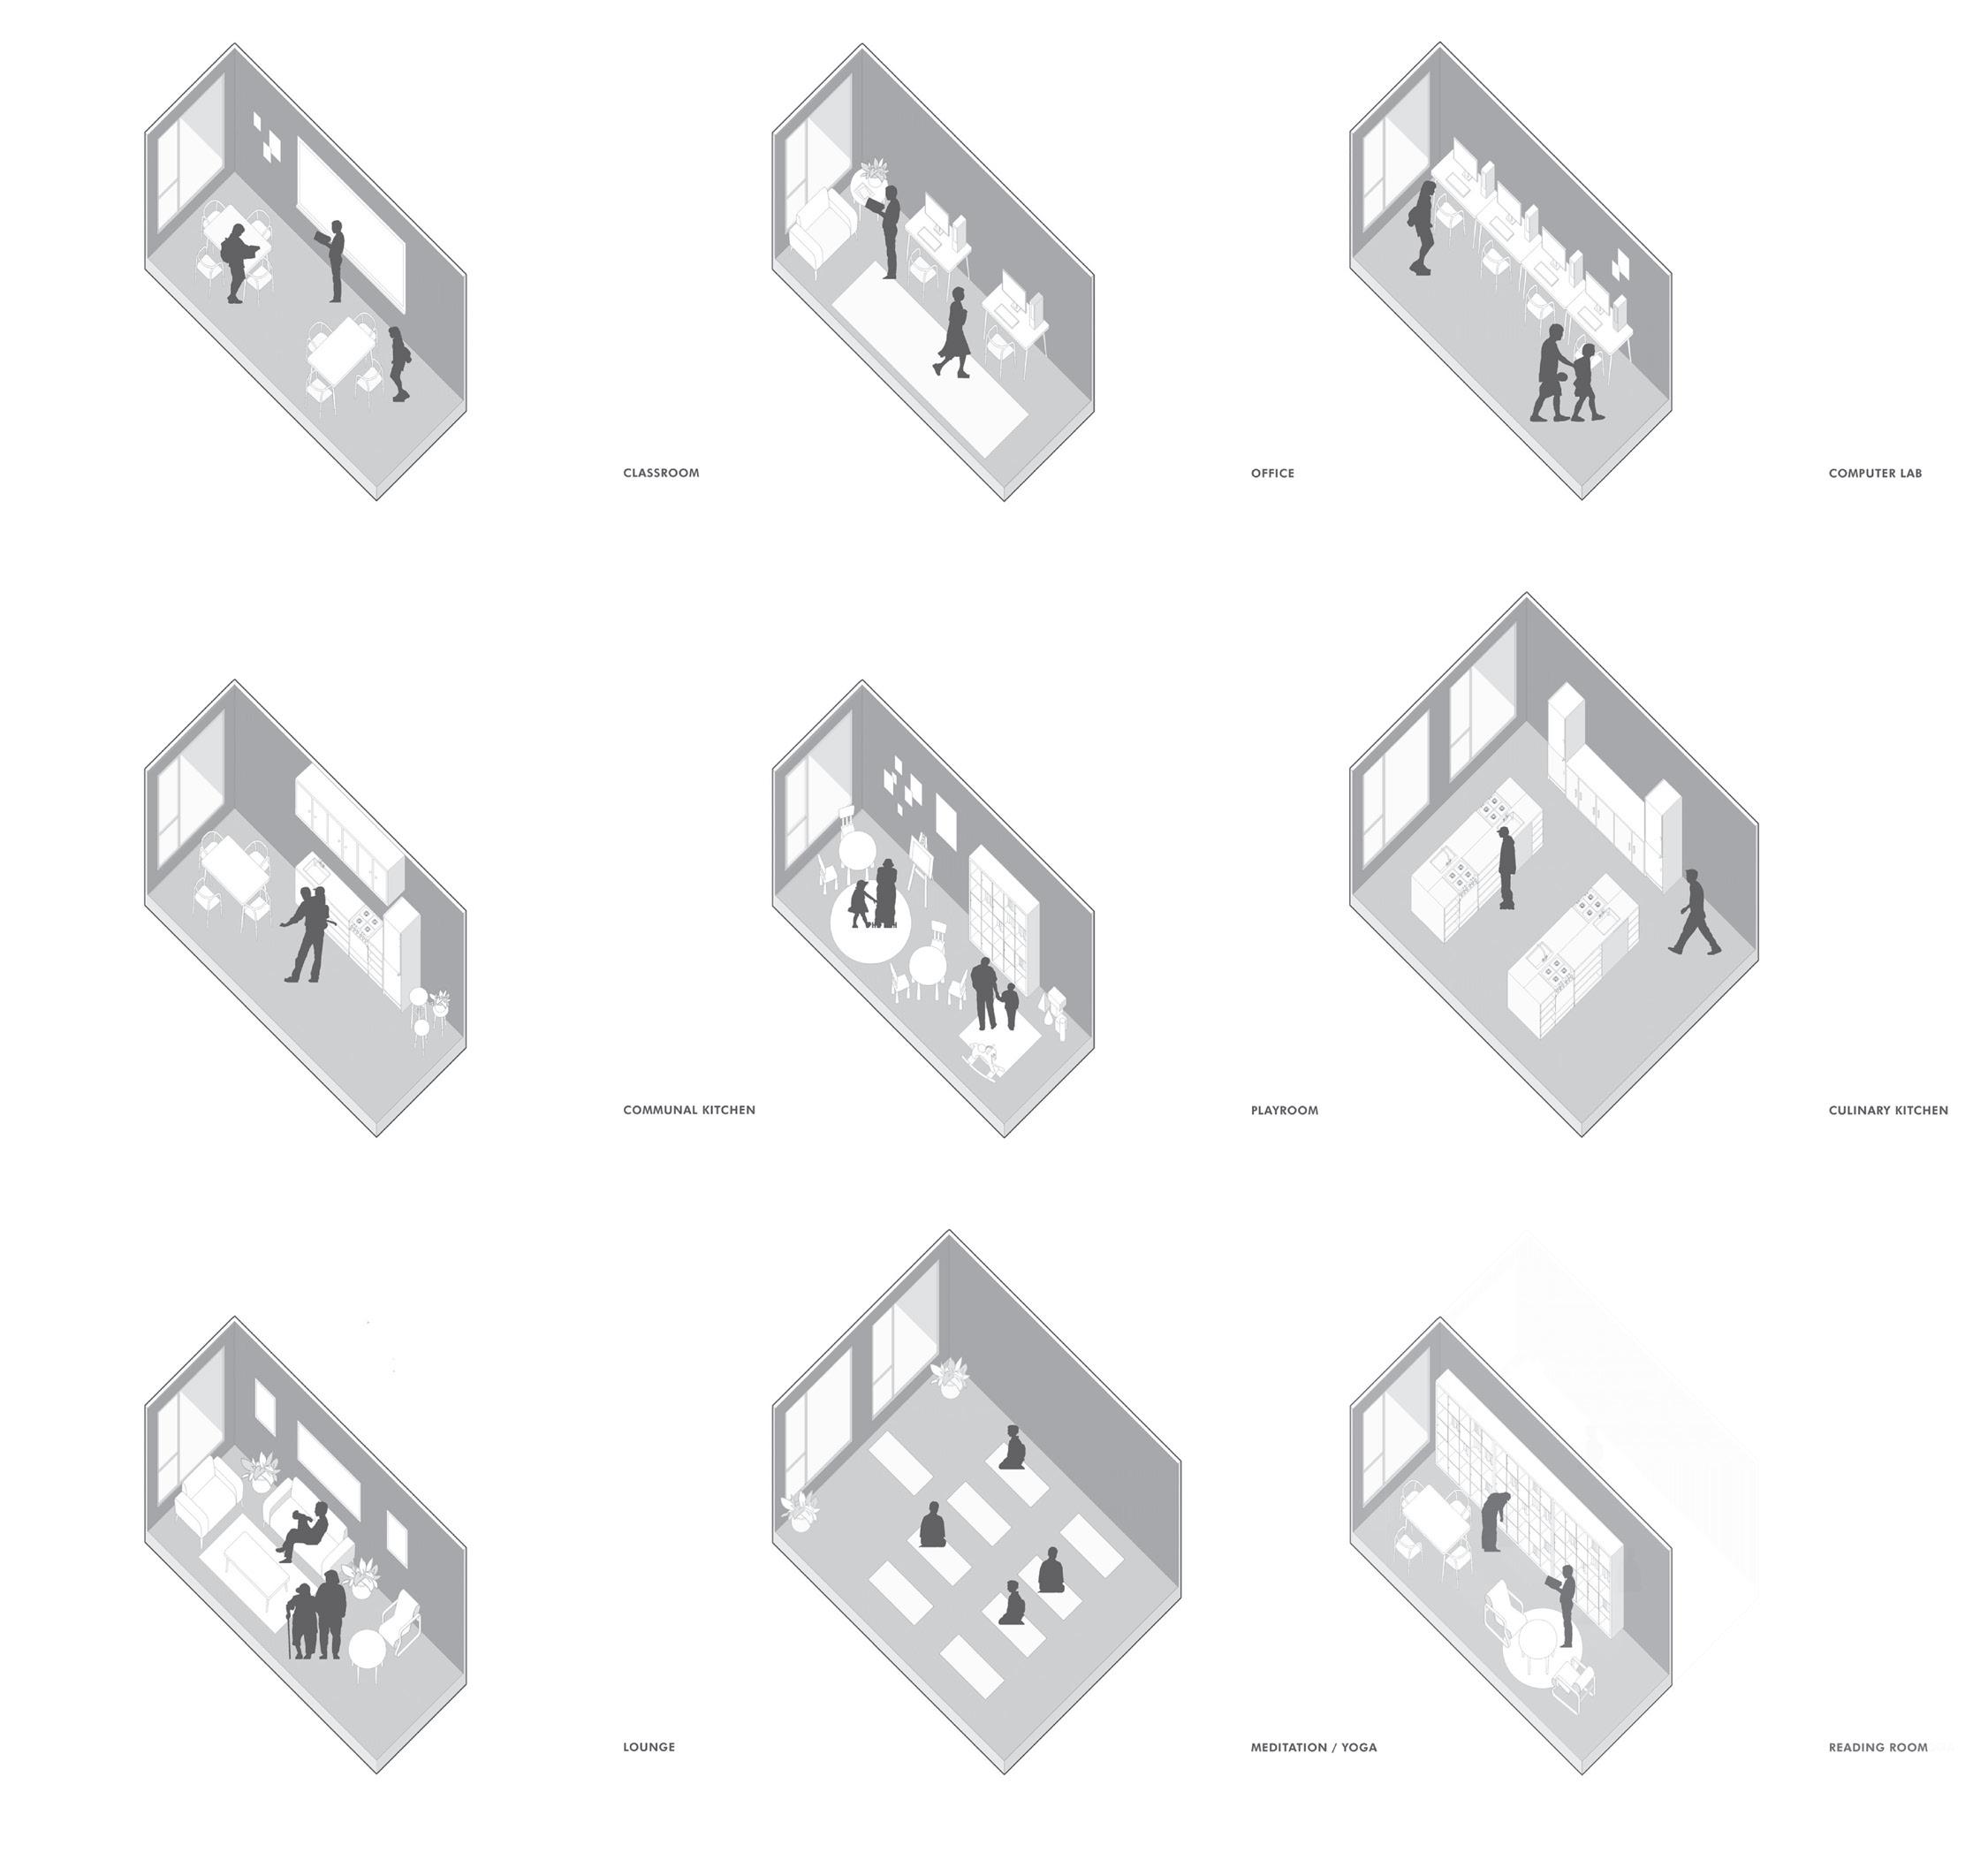
Our void spaces would give the residents autonomy and the opportunity to decide what their community needs within a neighborhood where the government municipality has routinely neglected its residents. Possible programs are a communal kitchen, reading room, playroom, and classroom. Ultimately, we wanted to give the community a voice while improving the community aspects of apartment living.
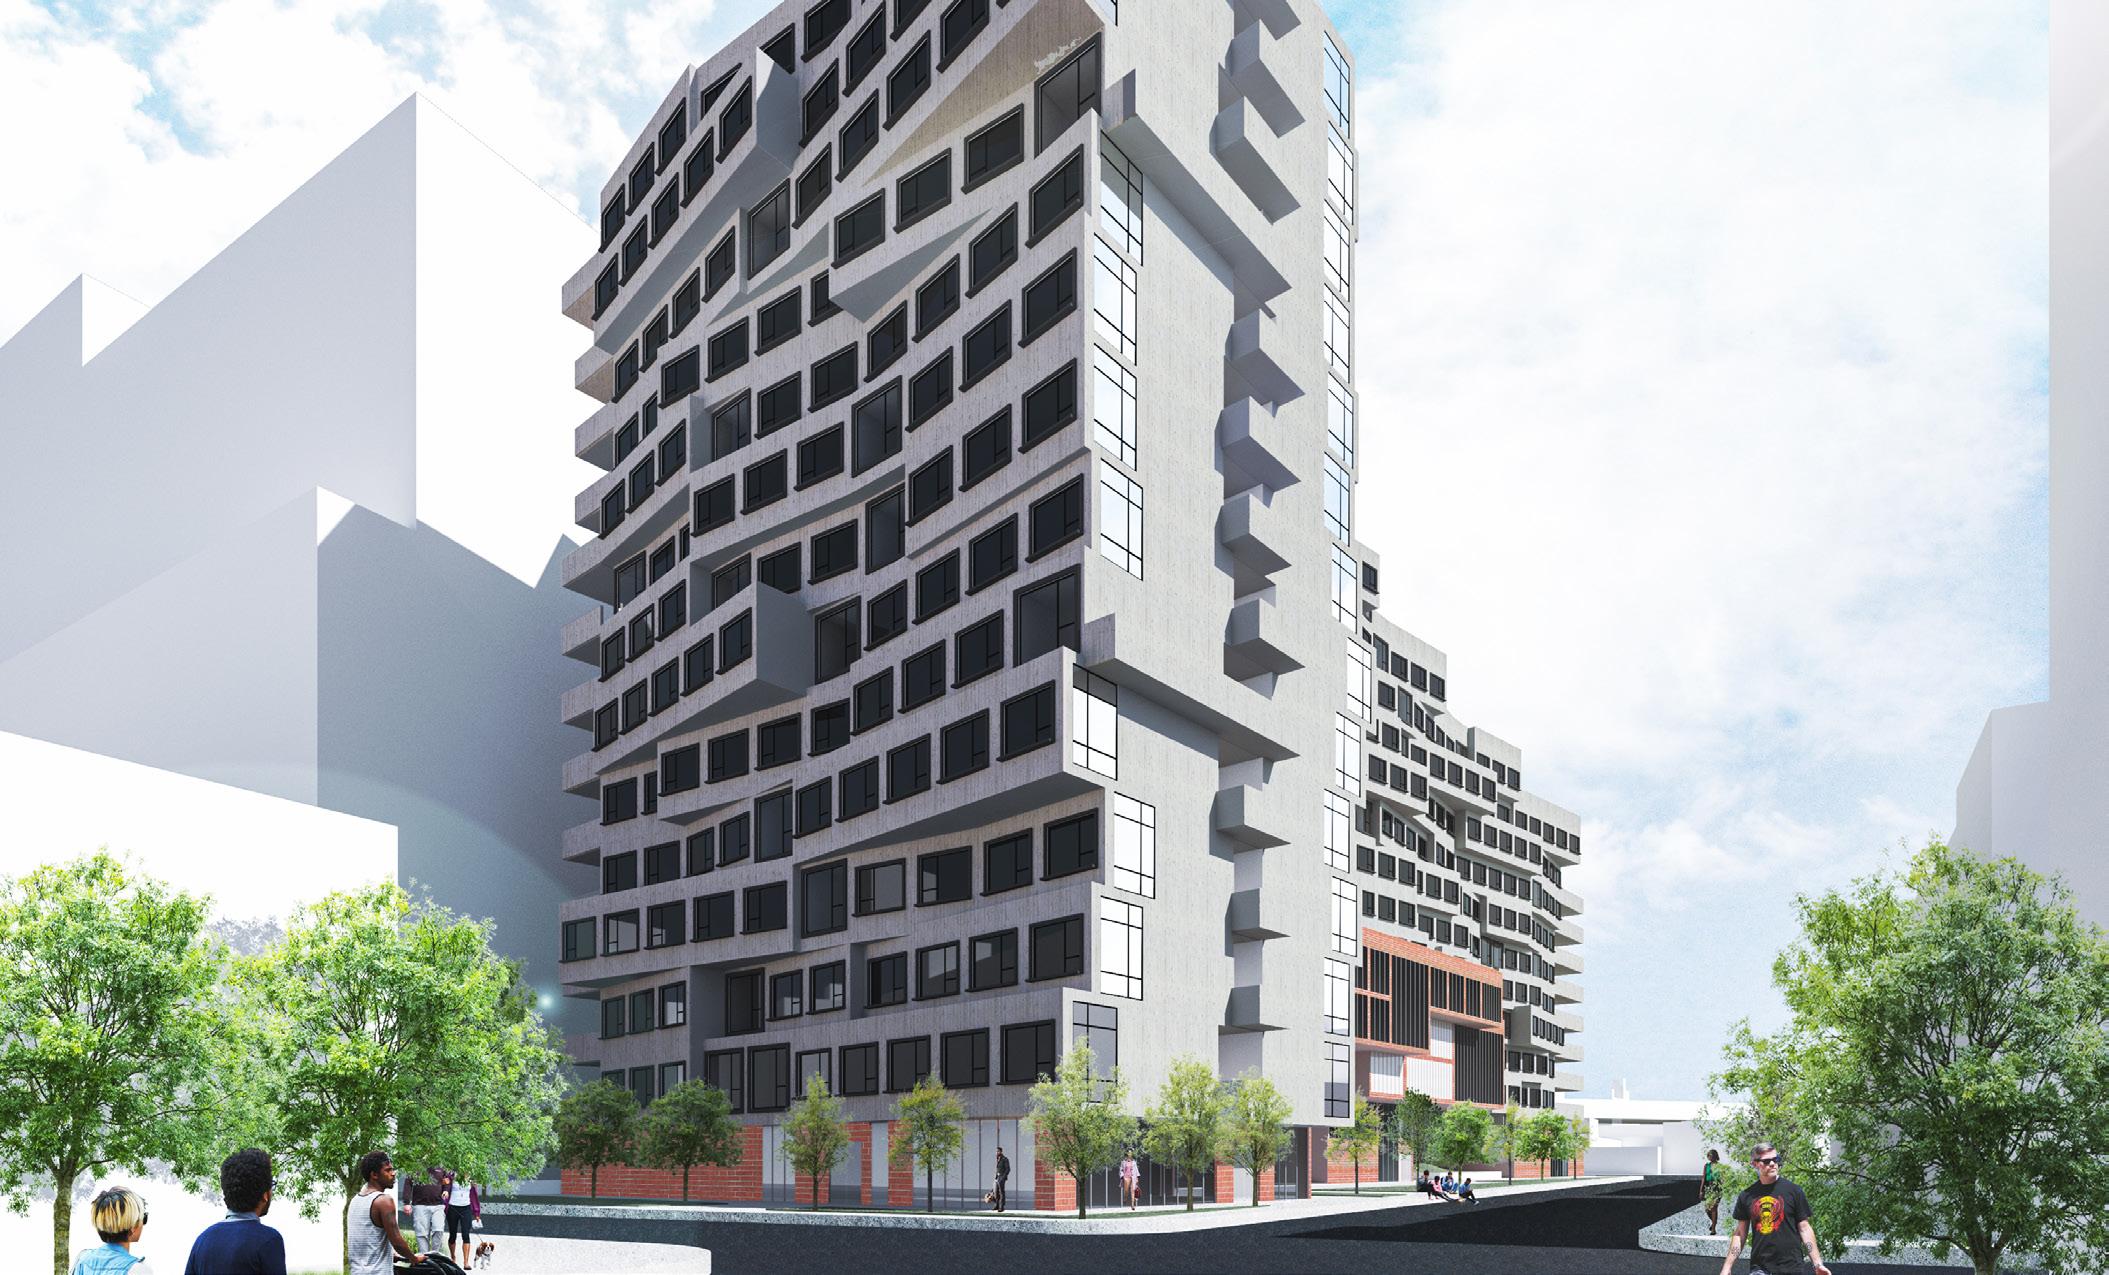

 RE:Haven Balcony Rendered by Andrew Yu
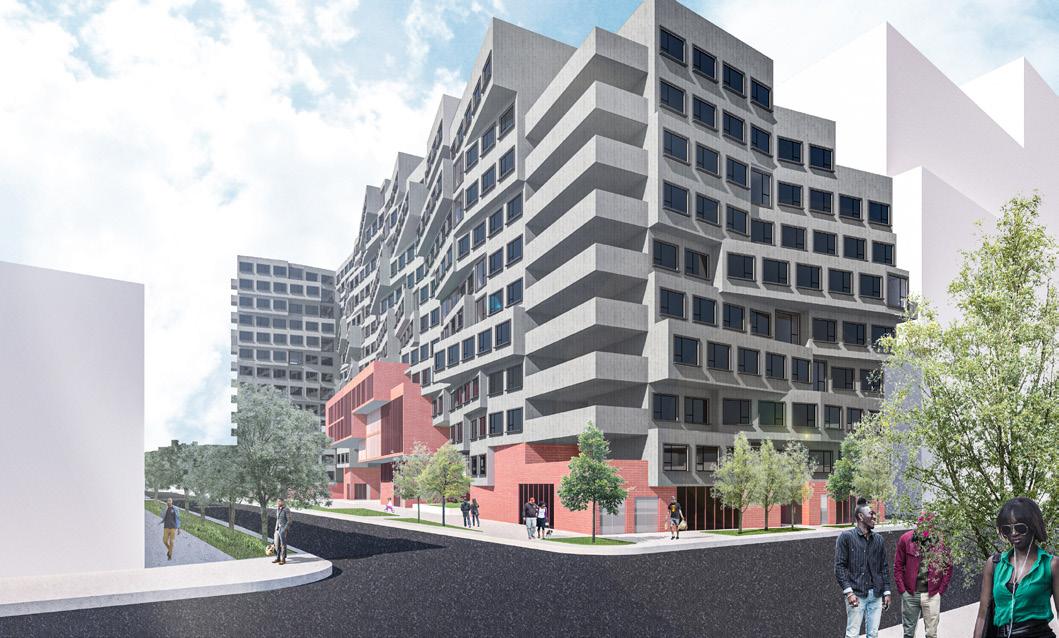
RE:Haven Exterior Rendered by Andrew Yu
RE:Haven Exterior Rendered by Andrew Yu
20.
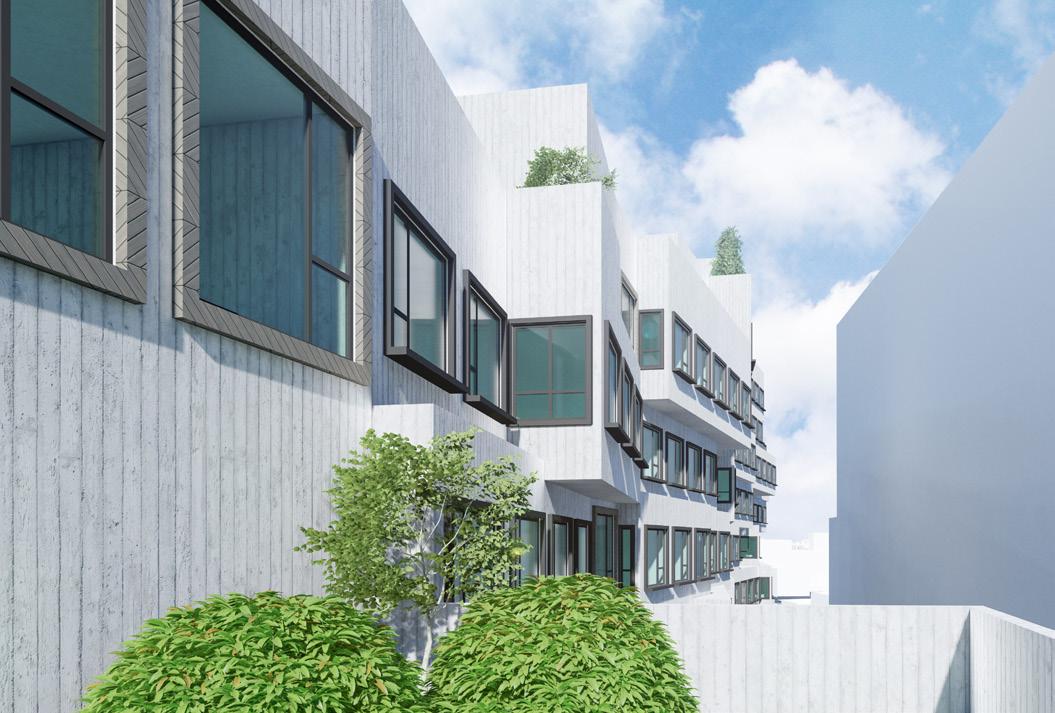
Facade Detailing Rendered by Andrew Yu
Communal / Void Space Program Examples Drawn by Andrew Yu
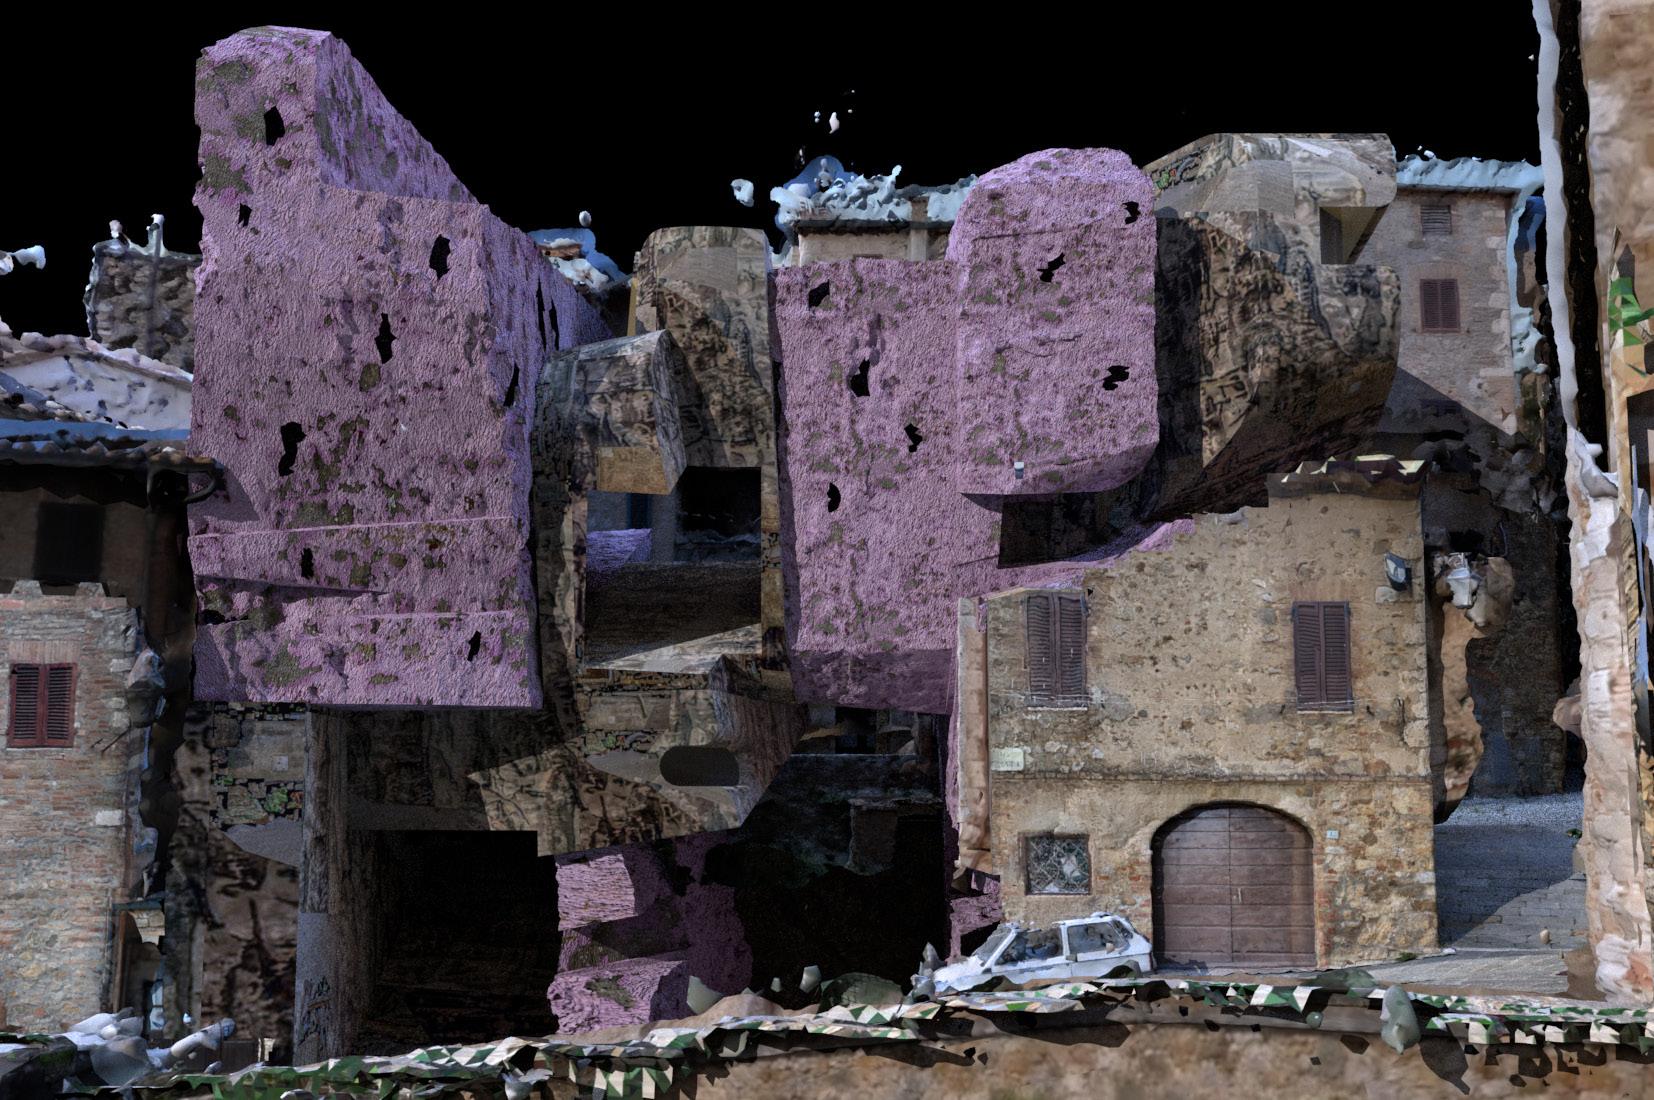
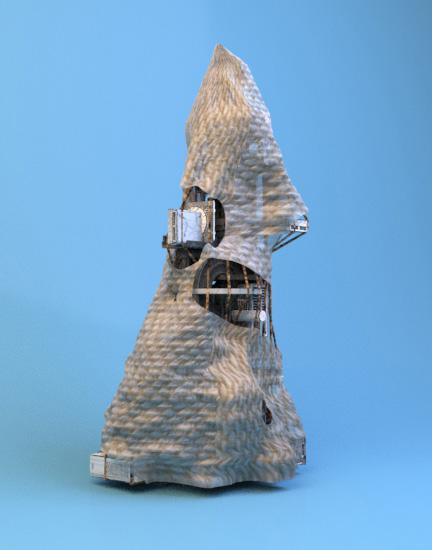
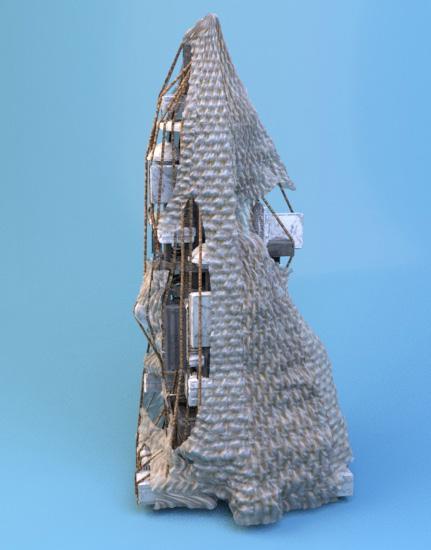
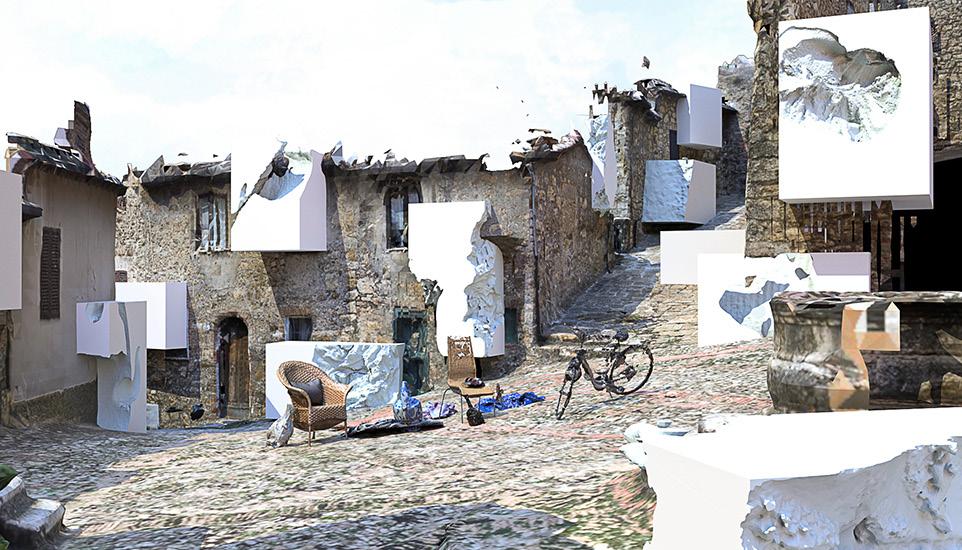
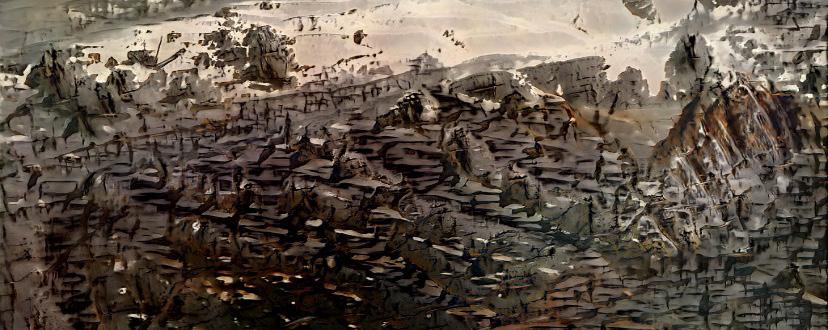
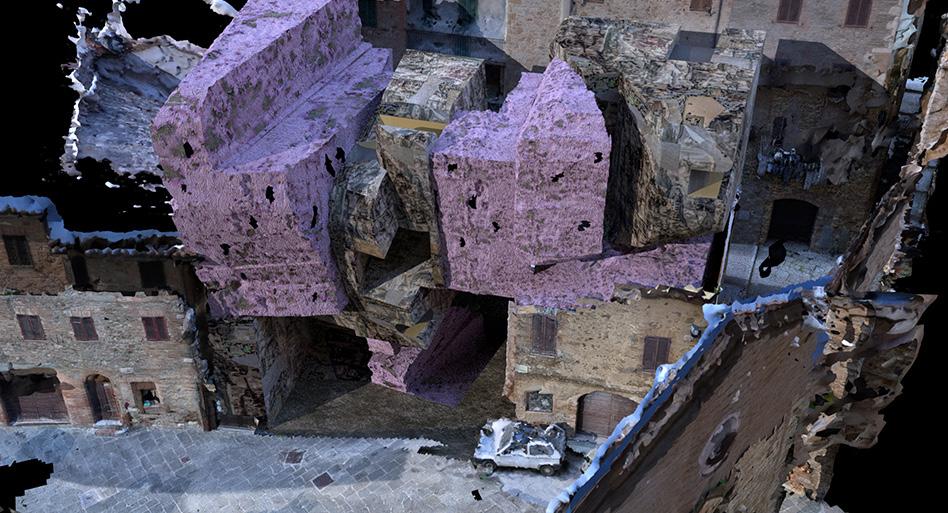
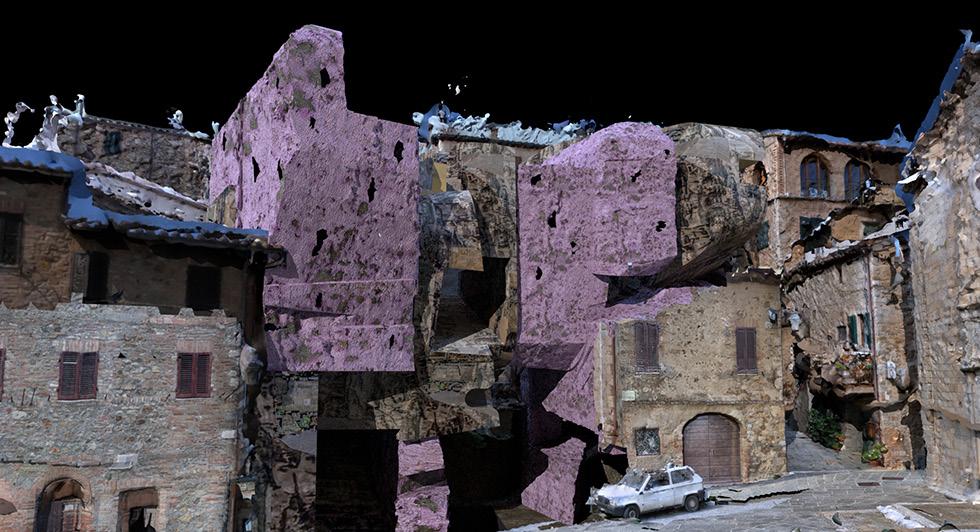
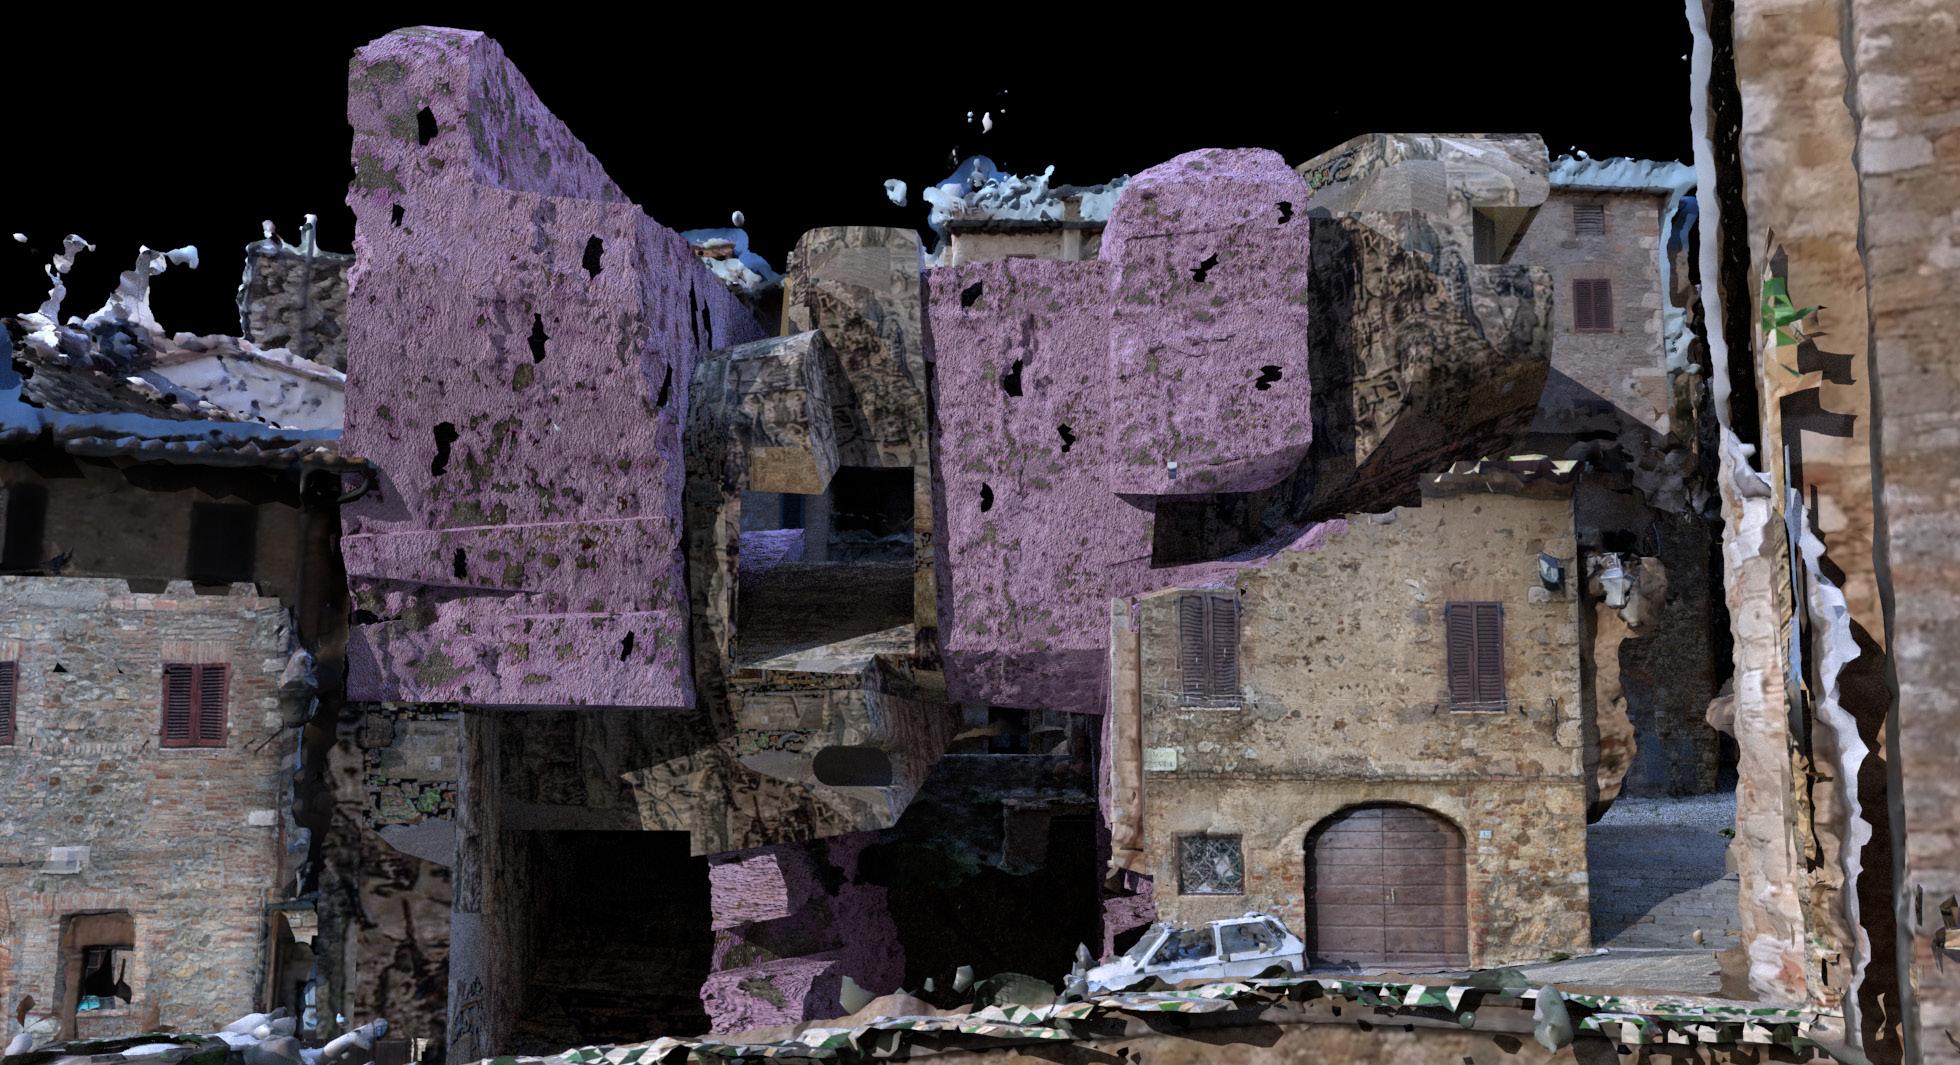
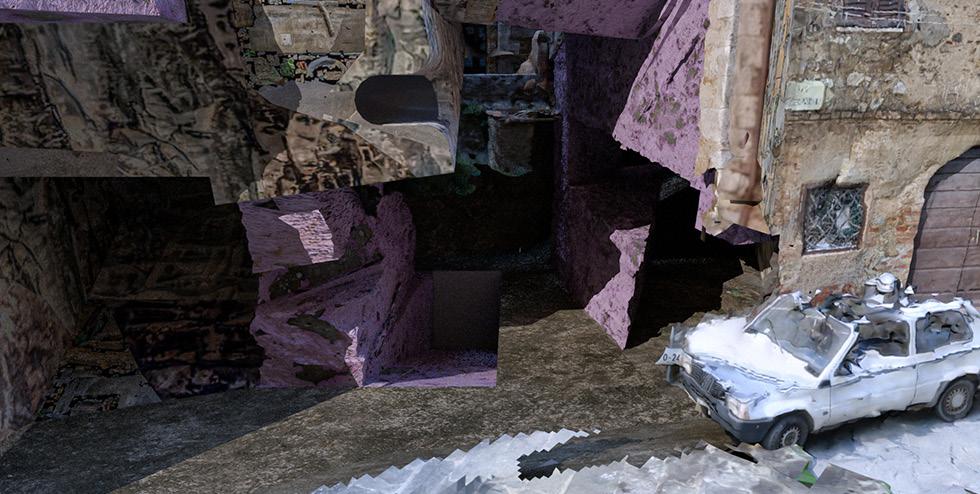
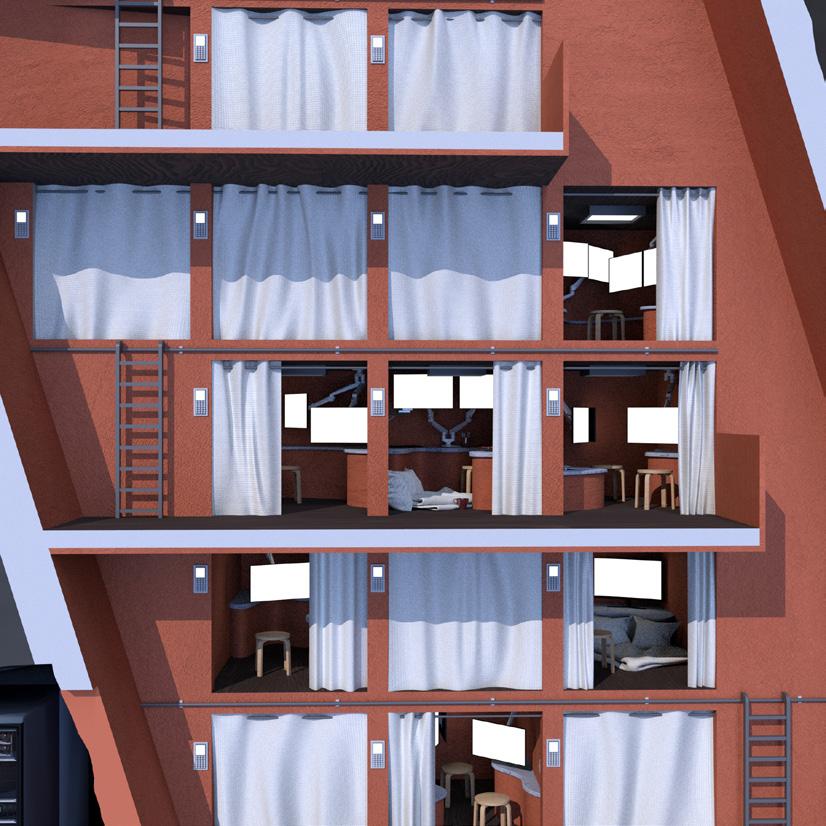
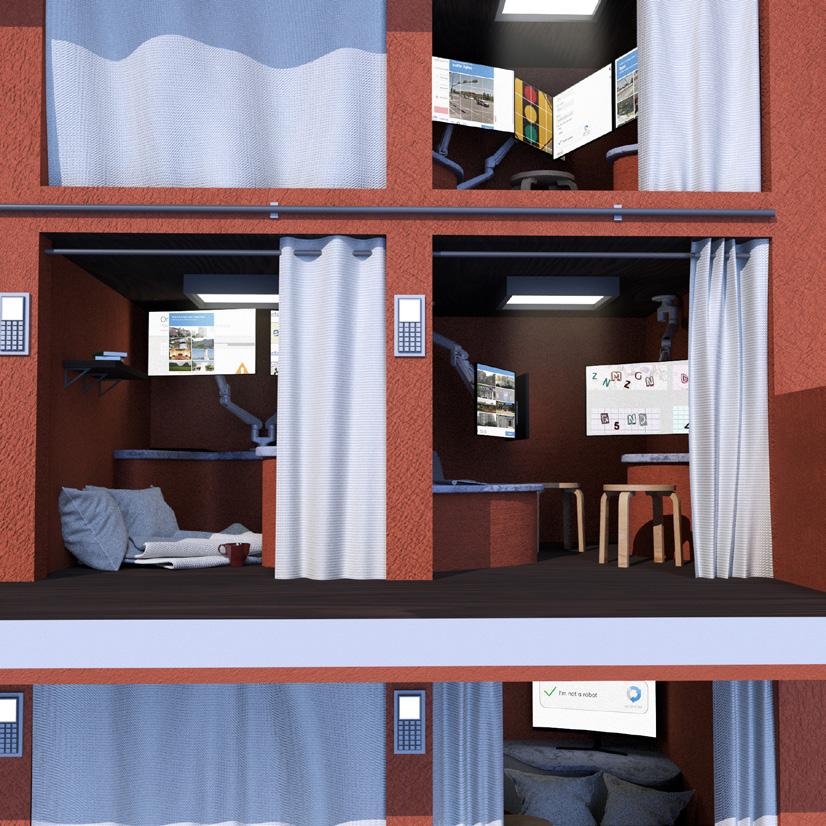
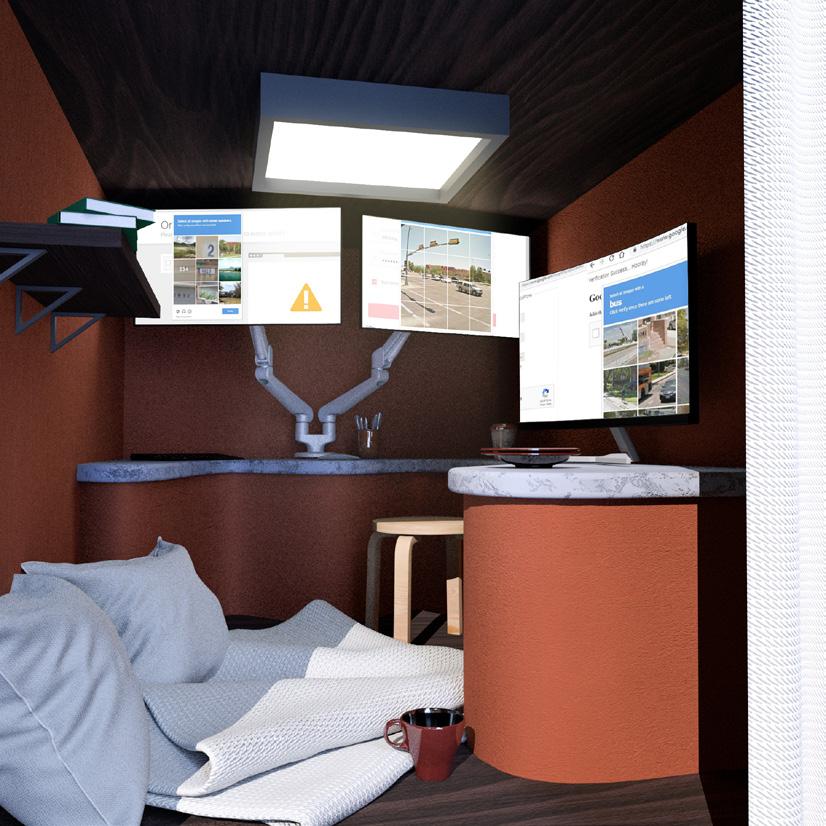
As the world shifts from a human-centric environment to a technological one, we begin to question what it means to be a human. Human and technology have a symbiotic relationship which creates a codependency with us using technology to remain connected and technology needing us to have a purpose. We must be re-educated on what it means to be “human”. Technology will teach us morals and values that will call for equity. The roles of technology and humans are reversed so that technology programs the human consciousness. With an automated society the role of the human is not clear. Our function no longer is to survive, but to live with one another in this shared economy. For this to become commonplace we must nurture the concept of togetherness from a young age. Through new tools of virtual learning and shared spaces we can restructure our society. Because the focus of the world has shifted from humans to technology, our interpretation of what it means to be human is extrapolated through the interactions that humans have with technology and the interactions that technology have with humans. The cooperation involved in processes of categorization and reorganization inform artificial intelligence about inherent human biases which are then extrapolated and reimposed in an attempt to mimic and create new vectors of communicating what it means to be human, completely informed by a machine learned aesthetic.

Type: School / Mixed Use
Location: Castiglione d’Orcia, Italy
Category: Academic Work
Instructor: Daniele Profeta
Role: Collaborative Work with Mason Malsegna
Schoolhouse Collective Spring 2020 [5] 21.
BORGO DIGITALE
Gradation within Growth
A Bowl of Nuclear Soba // Inujima, Japan
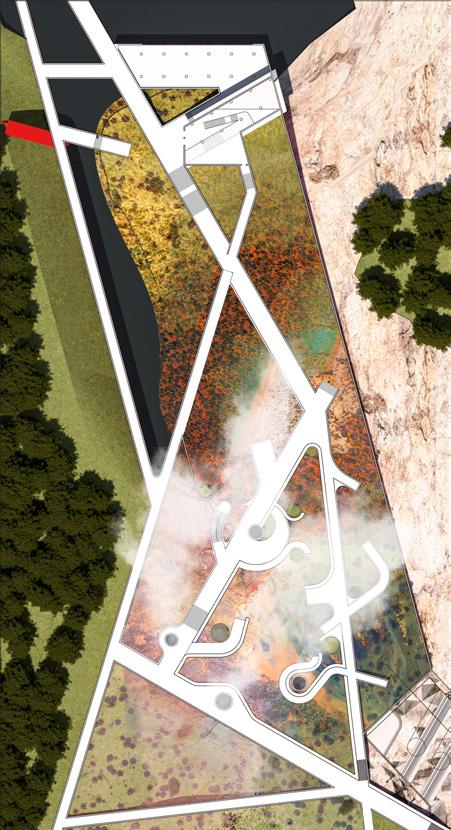
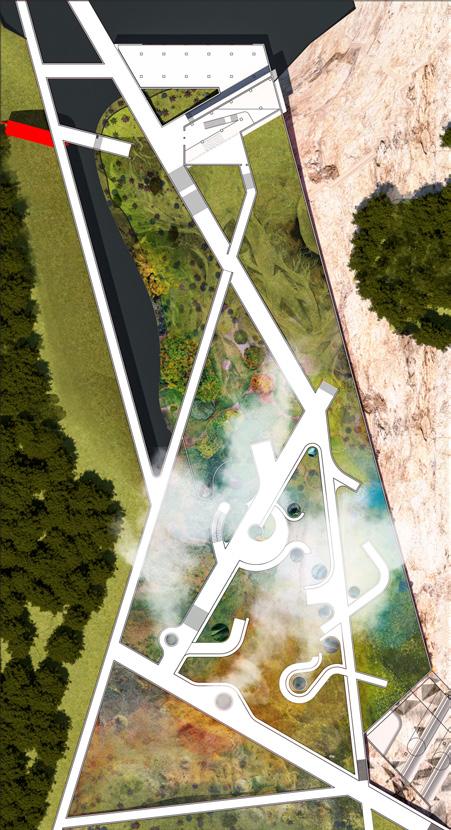
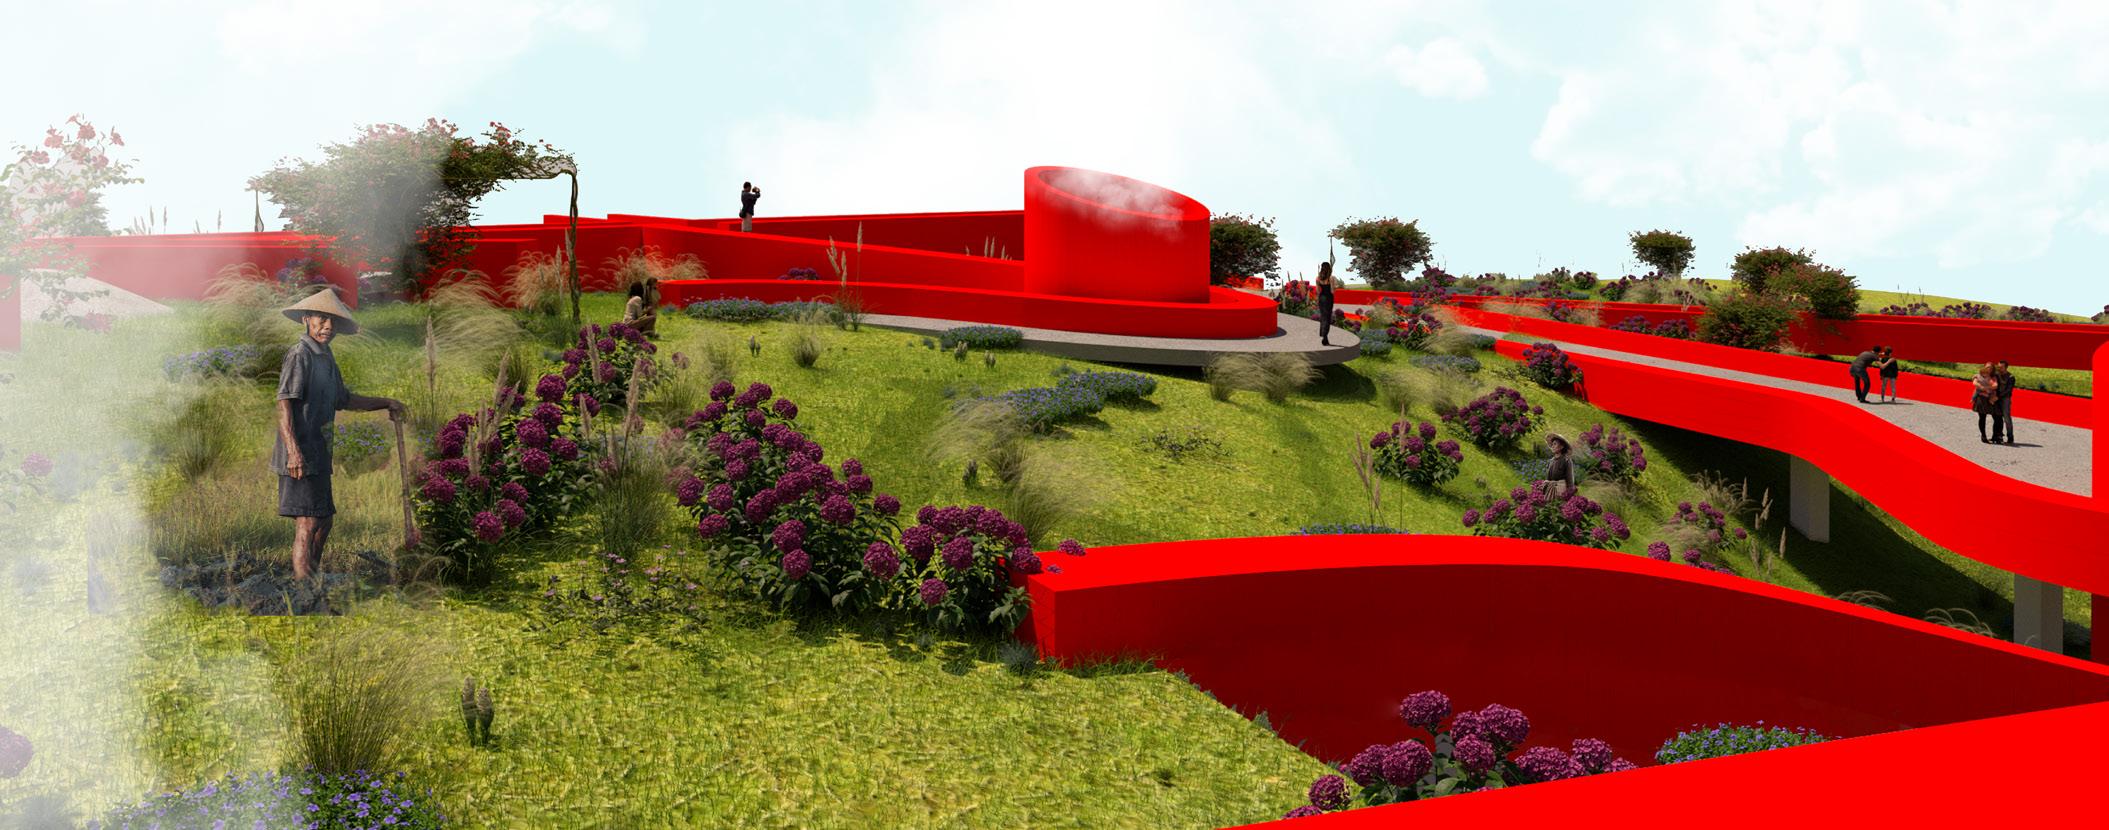
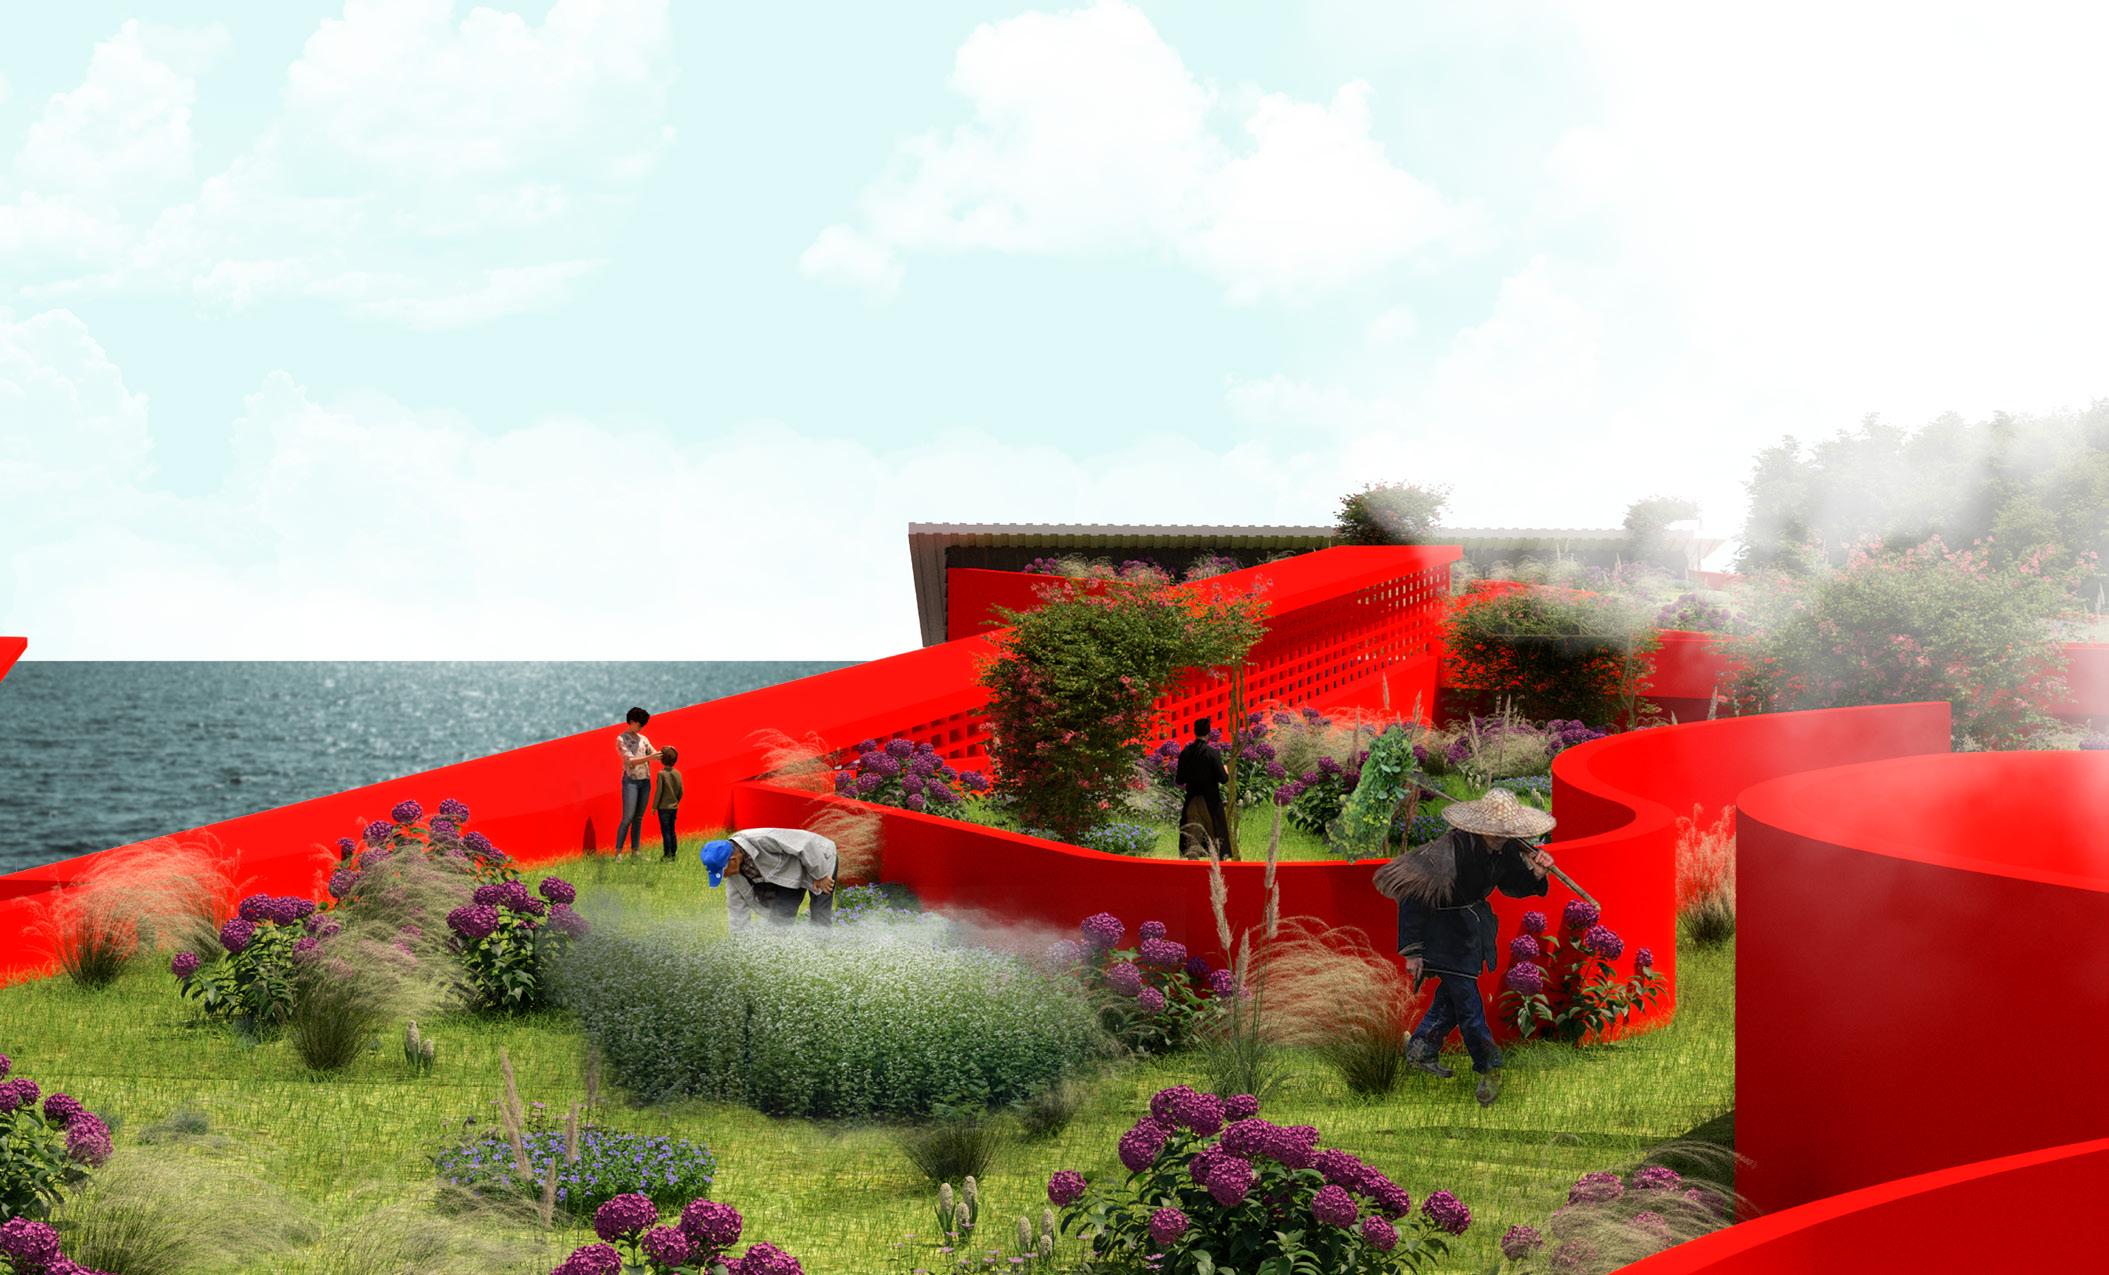
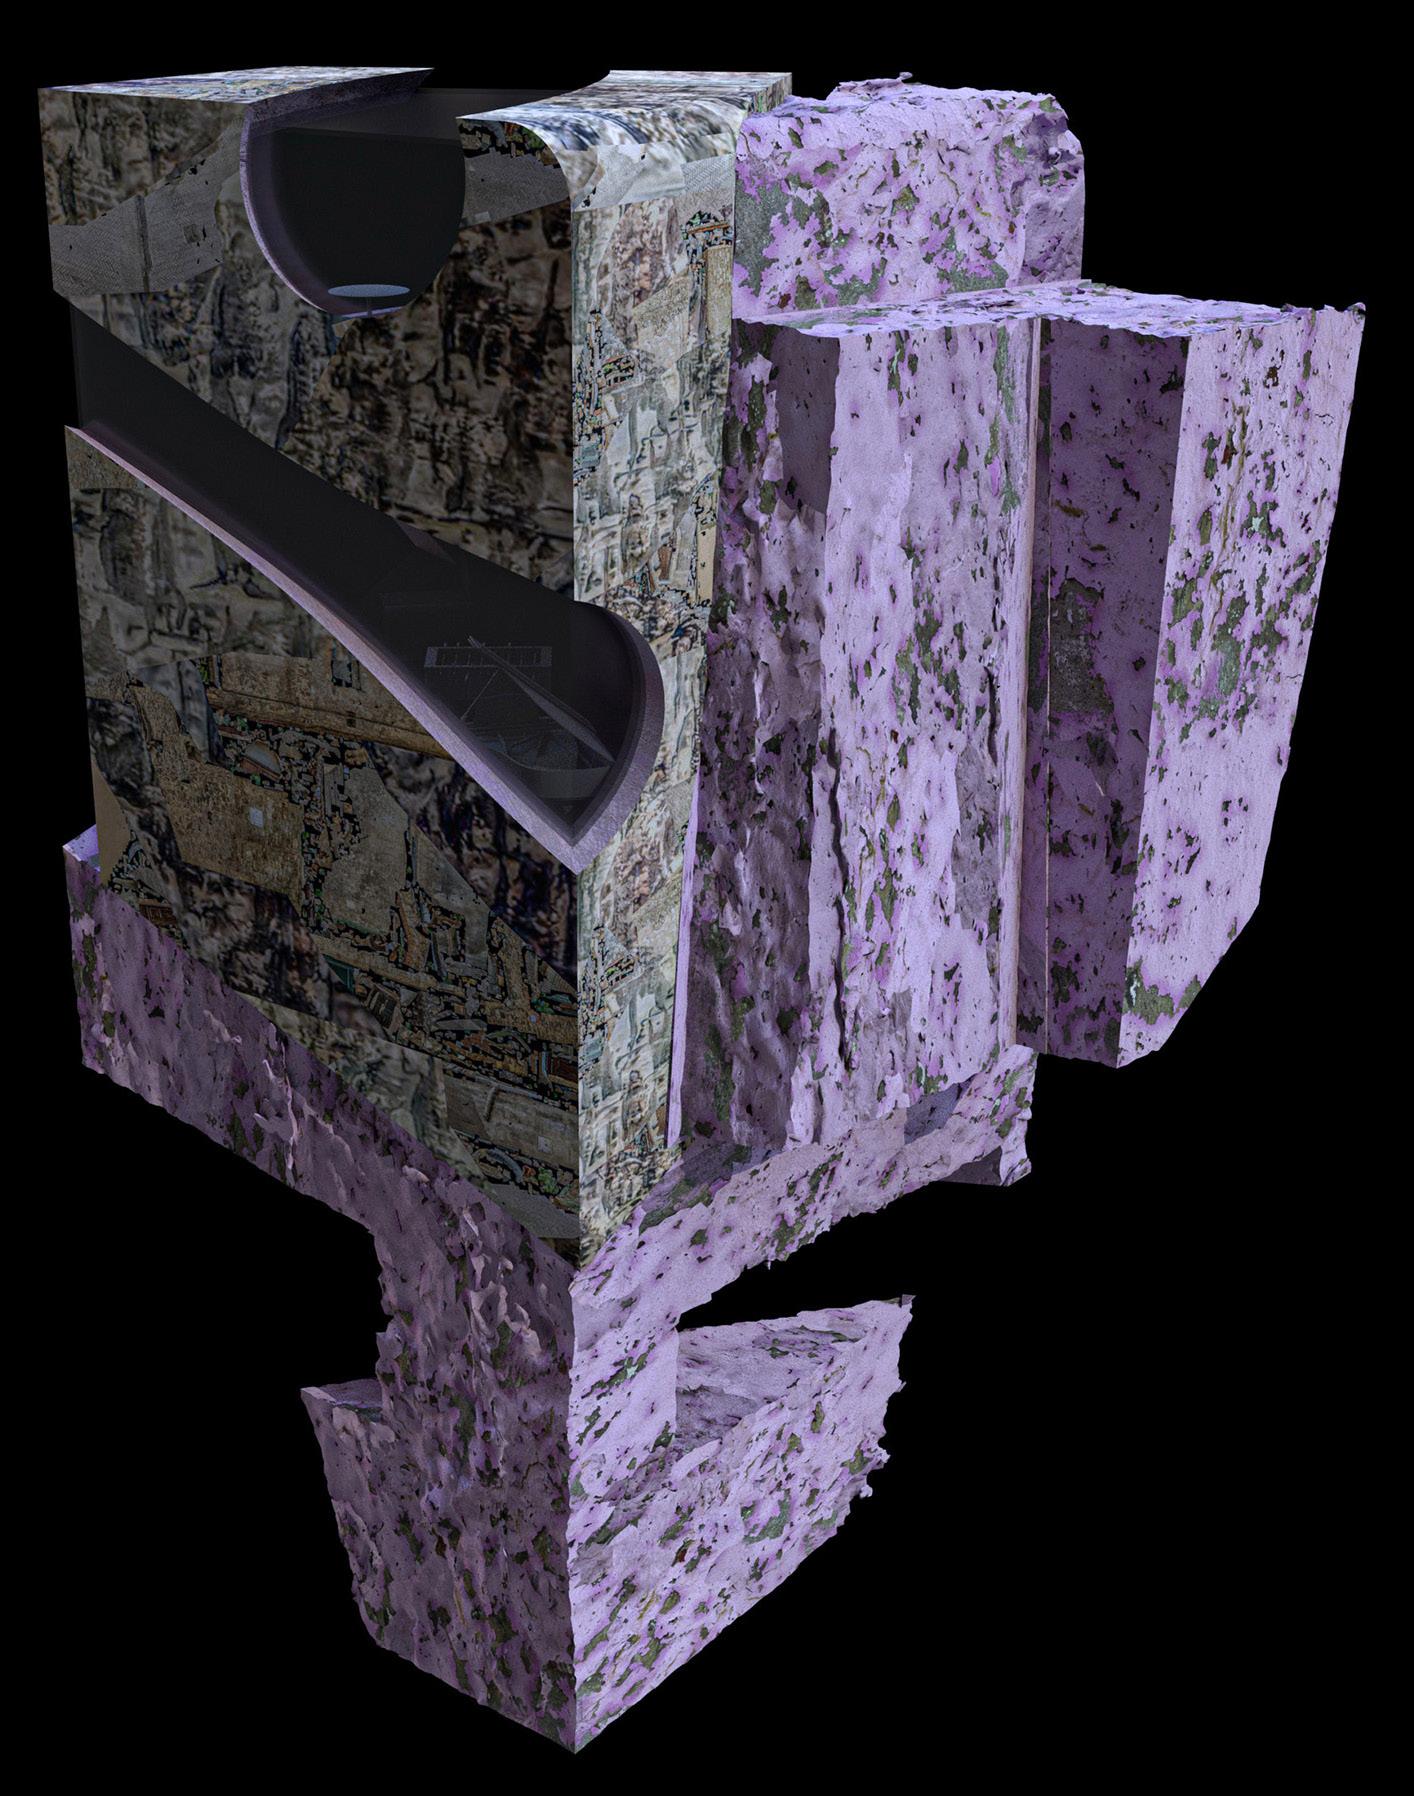
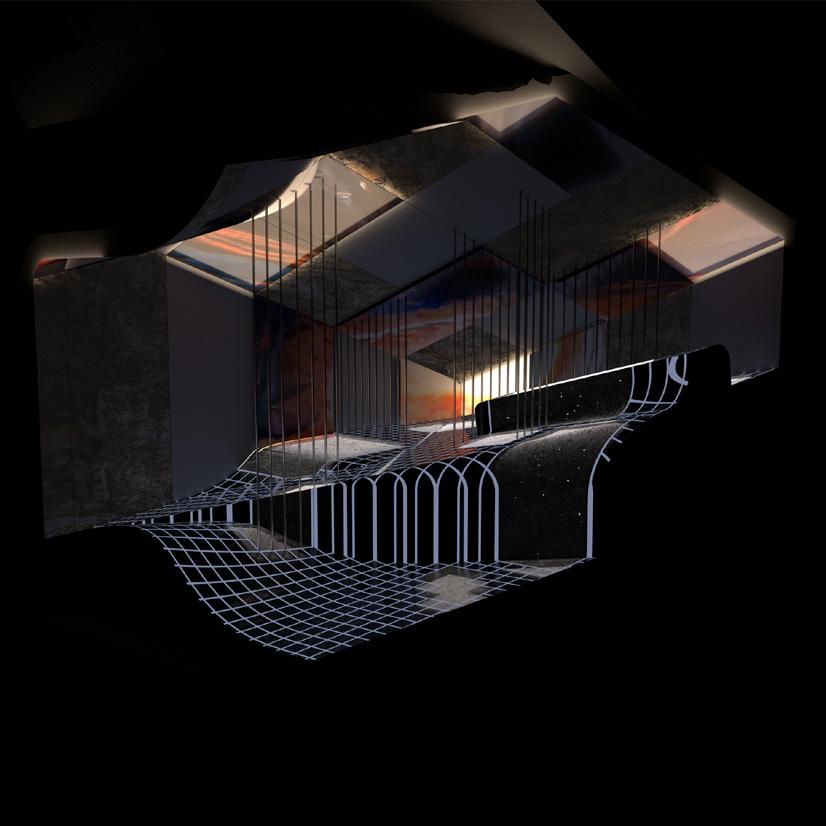
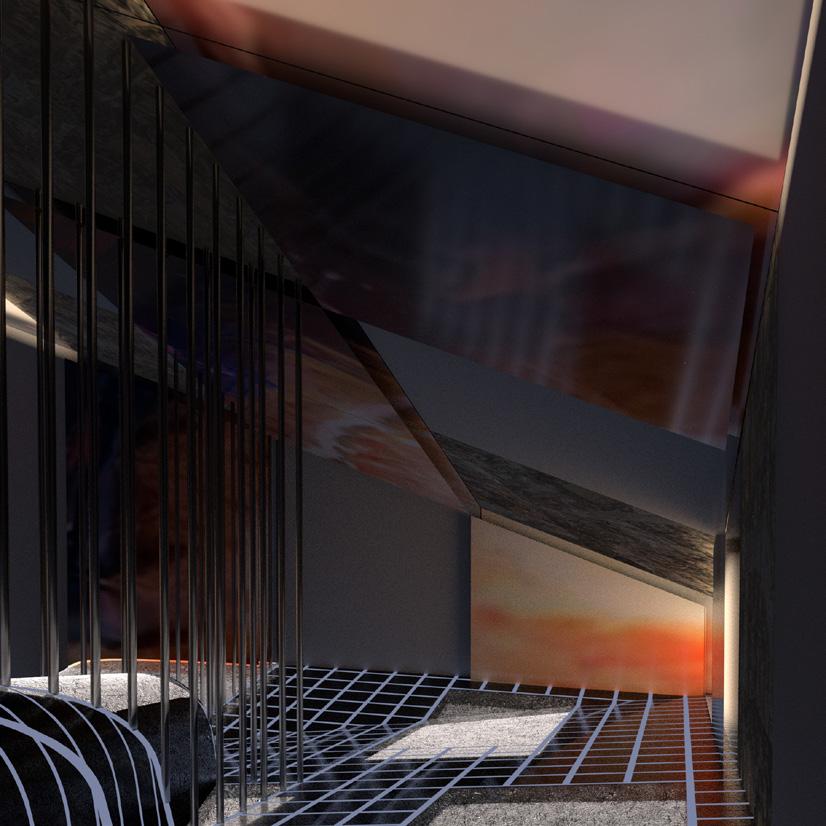
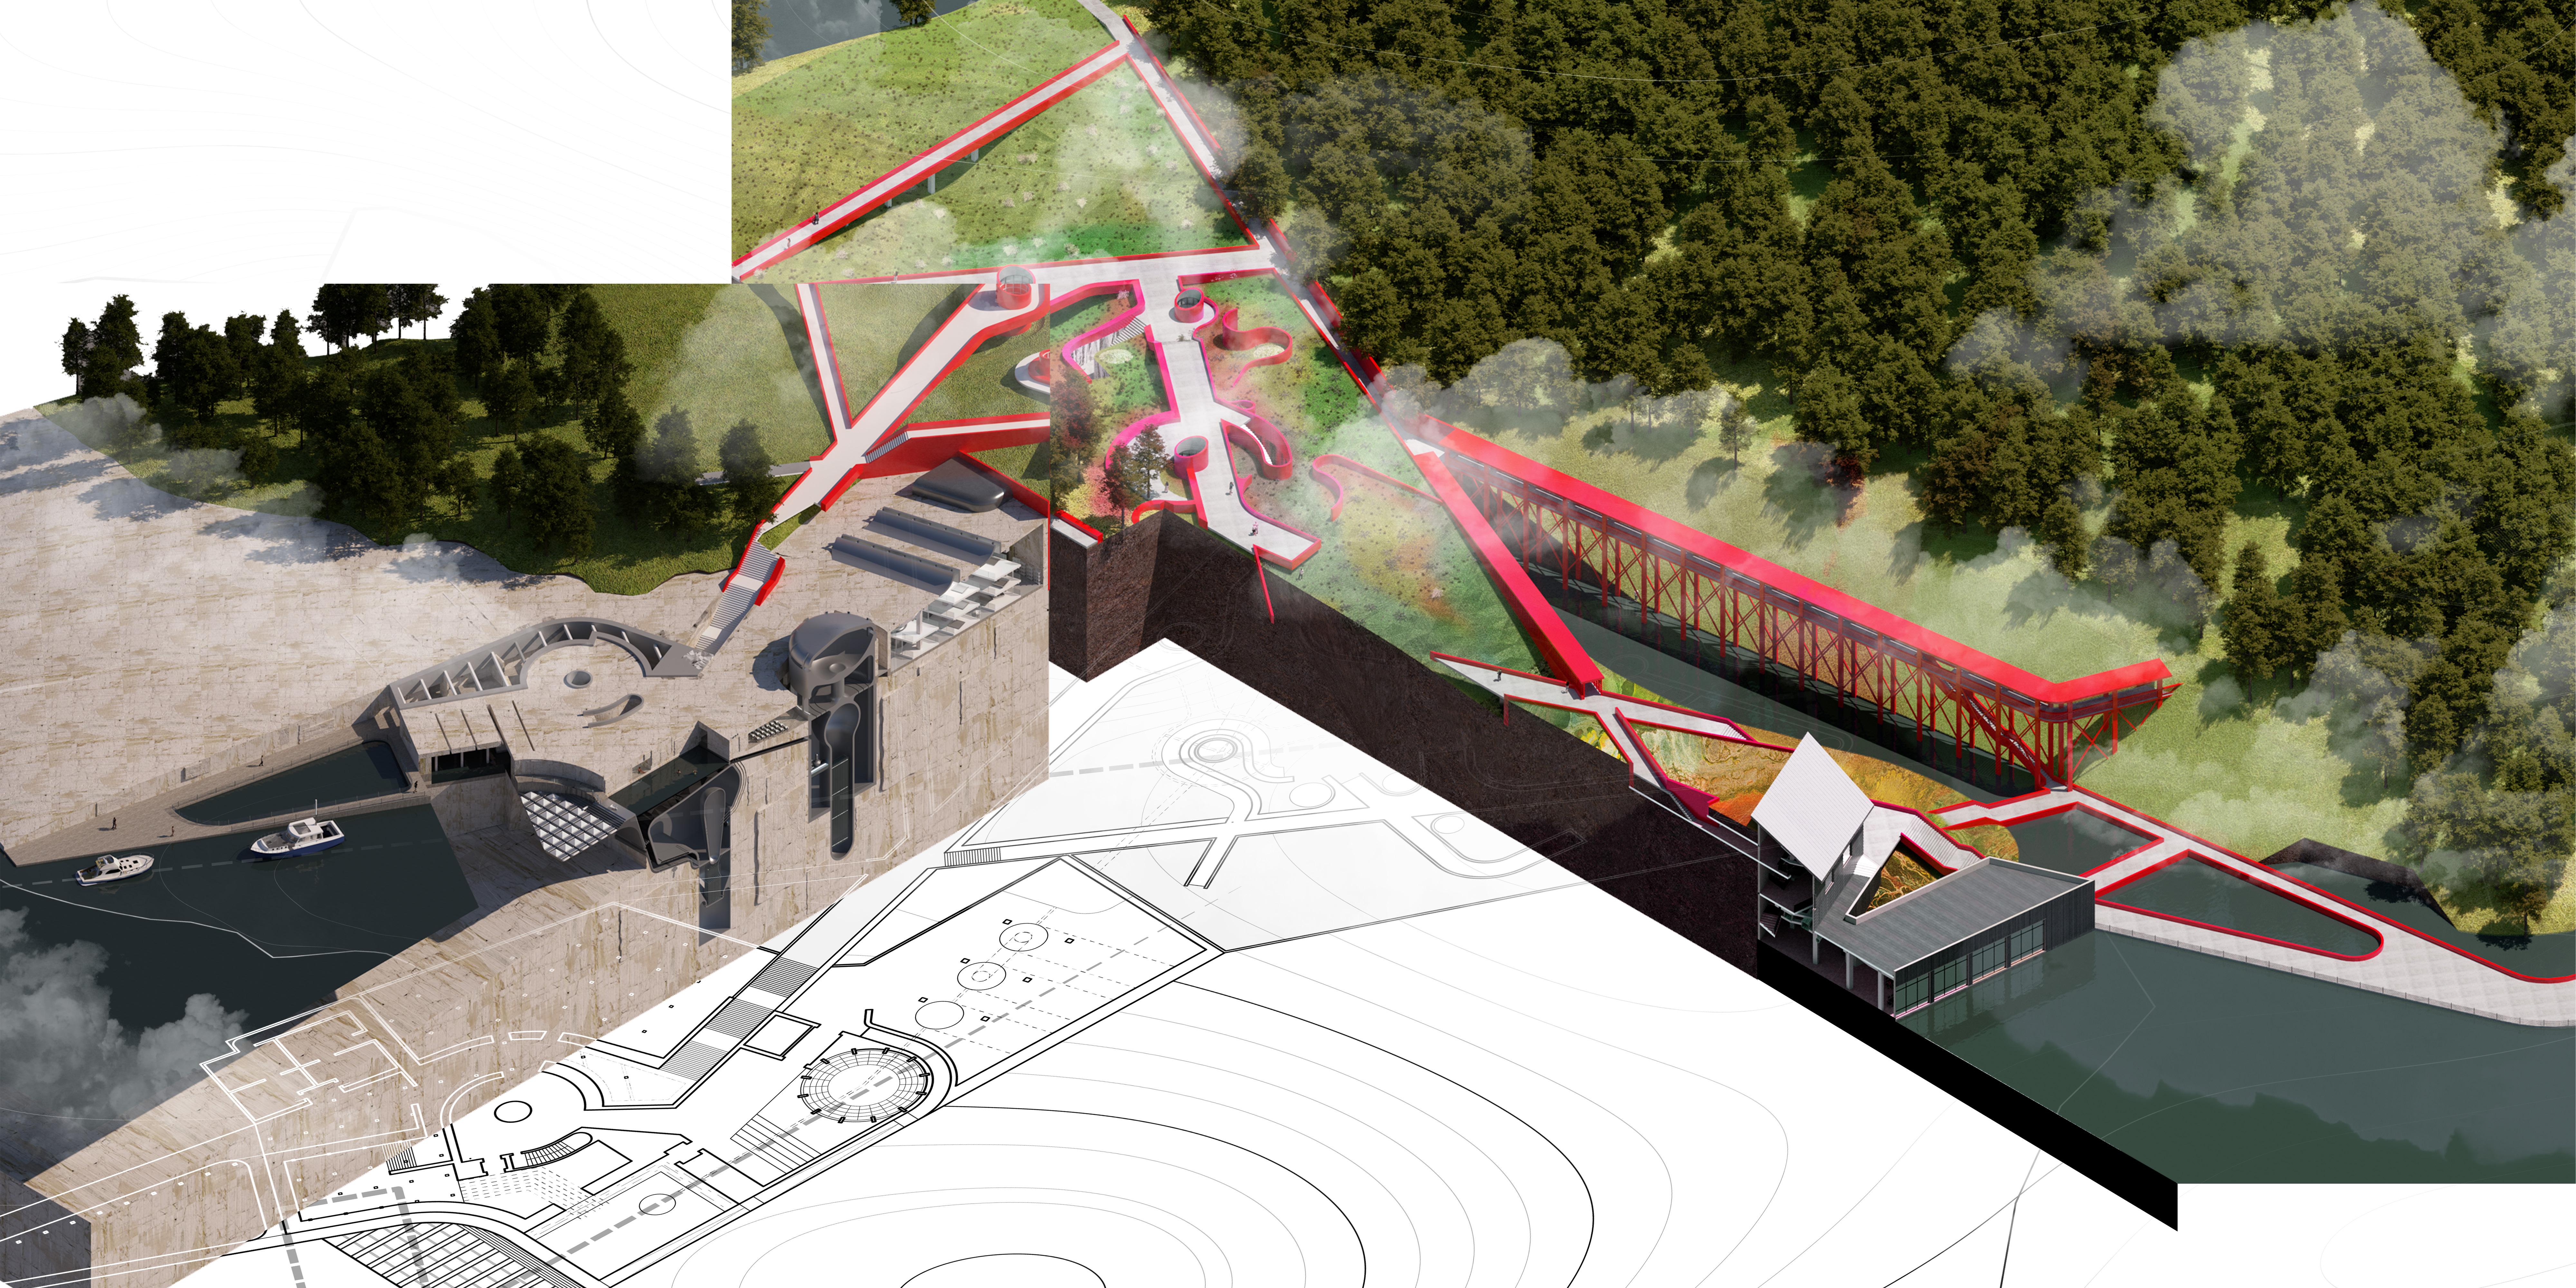
My ambition was to create a gradation in the soil which would act as different terroir that would affect the flavor profile of food growing on the landscape depending on its location. I aimed to do this by deploying steam and heat released via smoke stacks dispersed around the site. Furthermore, I wanted to build and improve the quality of the soil by building an actual ecology, interdependent on a multitude of species. Therefore, rather than producing a unicultural farm, the plants that are actually edible are in the minority, intercropped across a selection of plants that are grown only to support an ecology. Selectively, over the course of time, vegetables are planted in the pockets and they are spread about the site via natural ecological methods based on their viability within the ecosystem at that moment in time. Though my farm is inefficient, and thus completely contradictory to the efficiency associated with farming today, and also contradictory with the inherent efficiency of the nuclear power plant, my ambition is that my project engages in the contradictions between the perception of nuclear power, nature, and our relationship with both because it parallels, not only Japanese culture, but with our very existence.


27.
One
Gradations
Winter
Spring
Summer
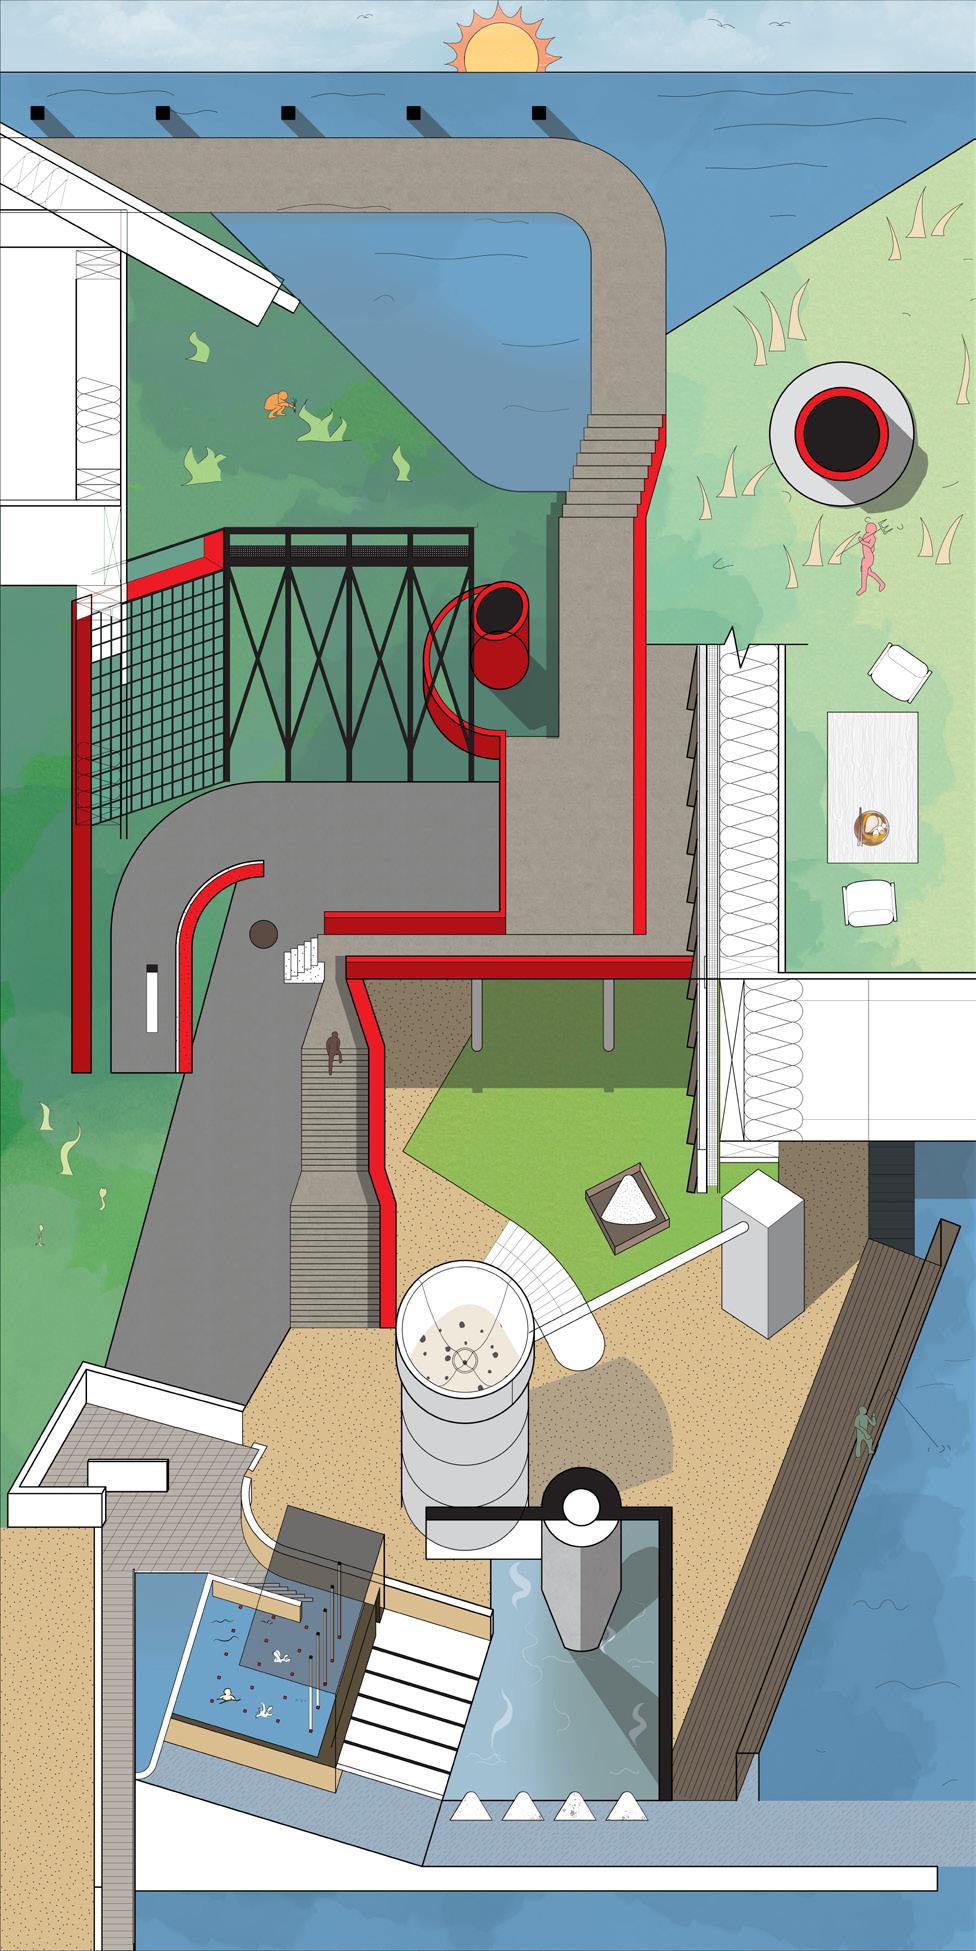
Plan of the Complex System Required to Manufacture
Bowl of Soba Noodles Processional Diagram from Harbor to Noodles
within the Soil Caused by Steam Plumes Fall Variant
Variant
Variant
Variant
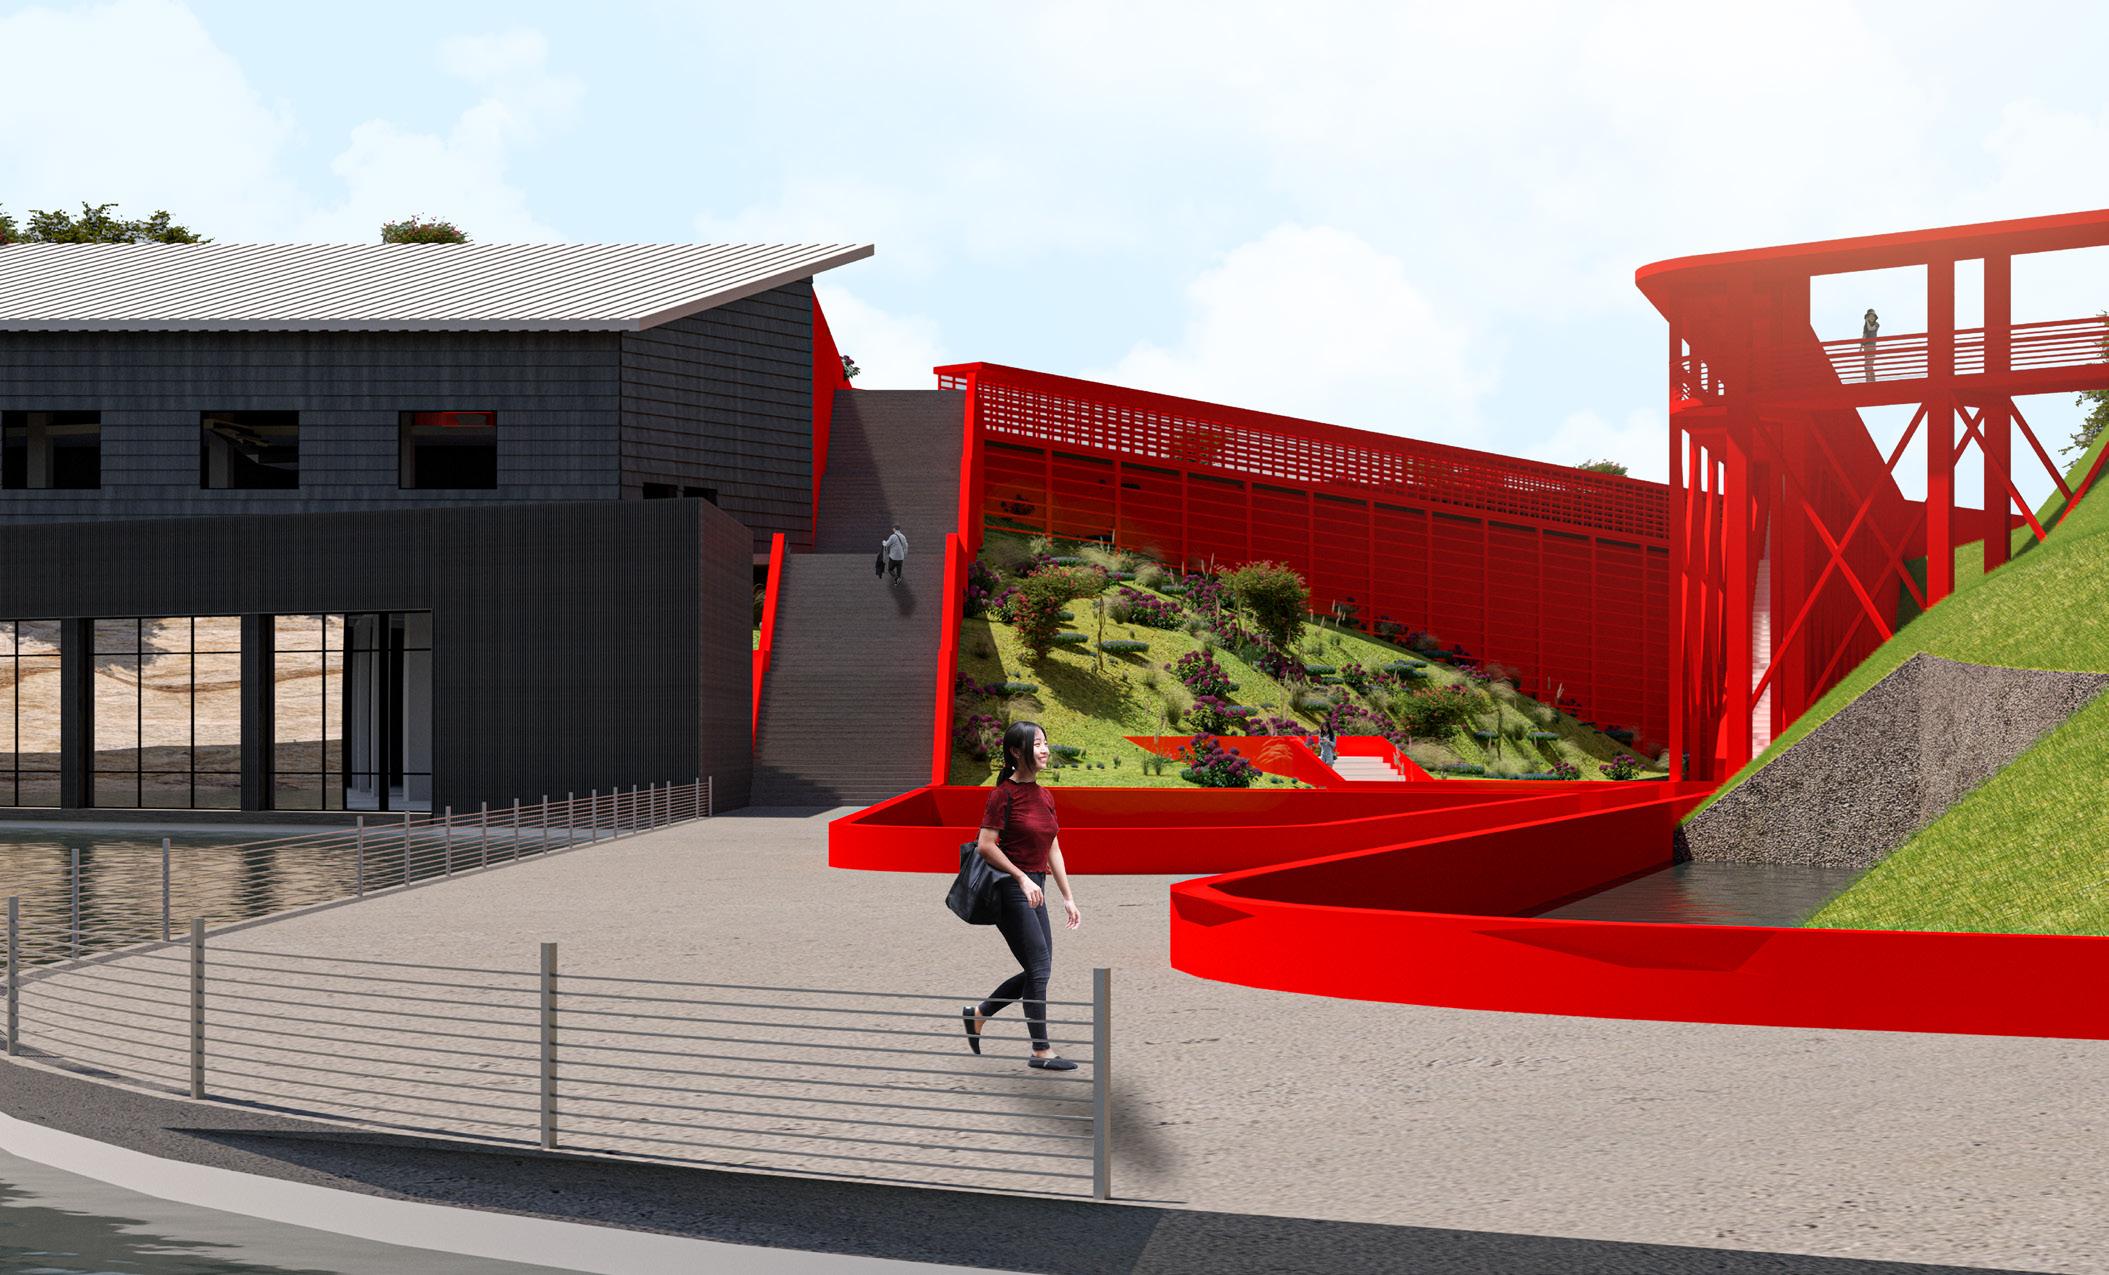
As for the procession throughout this space, I see it as ritualized and specific to Inujima because of the history around the butchering of animals prior to the Meiji Restoration. Because the Japanese had historically thought of the killing of animals as a staining of the soul, butchers were subject to the third class in the Japanese caste system, and the subsequent discrimination of the Burakumin class is still felt today. My procession reconstitutes this relationship with food. A person moving through this space would enter the gap between the two granite slabs, and get changed so that they can bathe first in cool salt water within the dark and humid granite cave. They then exit this bath and bathe in the heated onsen directly above the nuclear reactor exposed to natural light, cleansed of any impurities that they brought with them. Finally, they walk out of the granite section via a red staircase, entering a foreign ecology affected by the red plume stacks. Along the path that they walk, they experience the gradation and the collision between nature and the artificial before finally walking to the wood house where they eat their bowl of noodles, forming a connection with the food that they eat.
The Process Behind the Soba in Section A Bowl of Nuclear Soba // Inujima, Japan


28.
Section of Space Excavated Out of the Granite Quarry where Much of the Nuclear System is Lodged
Section of the Farm where Pockets for Steam Plumes would Affect the Surrounding Soil Conditions to Create Gradations within the Fields to Harvest the Best Tasting Soba
Views from a Nuclear Garden
A Bowl of Nuclear Soba // Inujima, Japan

29.
Rendering of the Aerial View of the System Behind the Nuclear Bowl of Soba
Rendered Perspective of the Garden Responsible for the Nuclear Bowl of Soba
Rendered Perspective of the Garden Responsible for the Nuclear Bowl of Soba
Rendered Perspective of the Restaurant and Departing Dock

Theatre Spring 2021
Competition: King + King Competition Finalist
Type: Performance Center
Location: Auburn, New York
Category: Academic Work
Instructor: Terrance Goode
Role: Collaborative Work with Alexander Michel
The Ensemble Theatre is a multi-venue performance center located in the heart of Auburn, New York. The idea of the project is to create an architecture that represents the composite nature of the theatre . Whether it be the many stories a theatre house contains or the many individuals who make up an individual show, the theatre is about a collection of individuals forming a cohesive, yet multivalent whole. Like a machine, it requires the cooperation of many moving parts. The Ensemble Theatre expresses this heterogeneity through the architectural expression of programmatic relationships.
ENSEMBLE
30.
THEATRE Renegotiating the
[7]
Designing the Ensemble Theatre
The Crown of the City // Auburn, New York
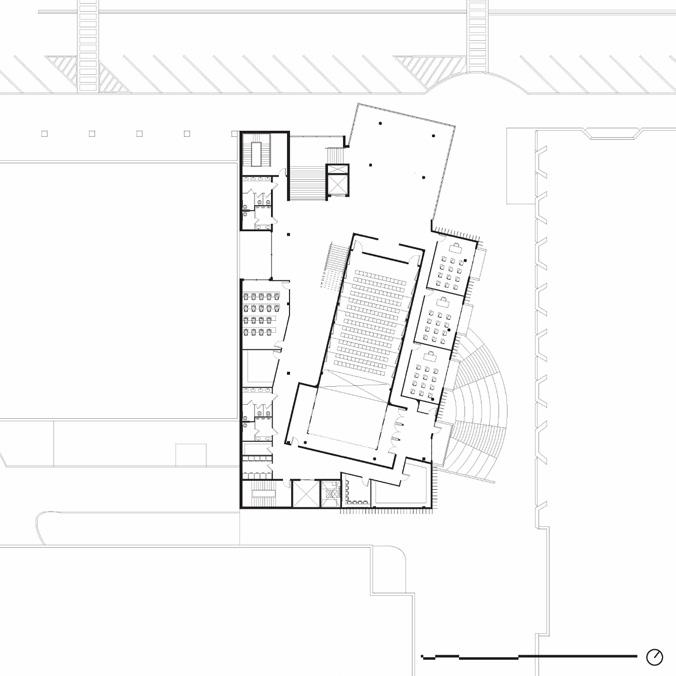
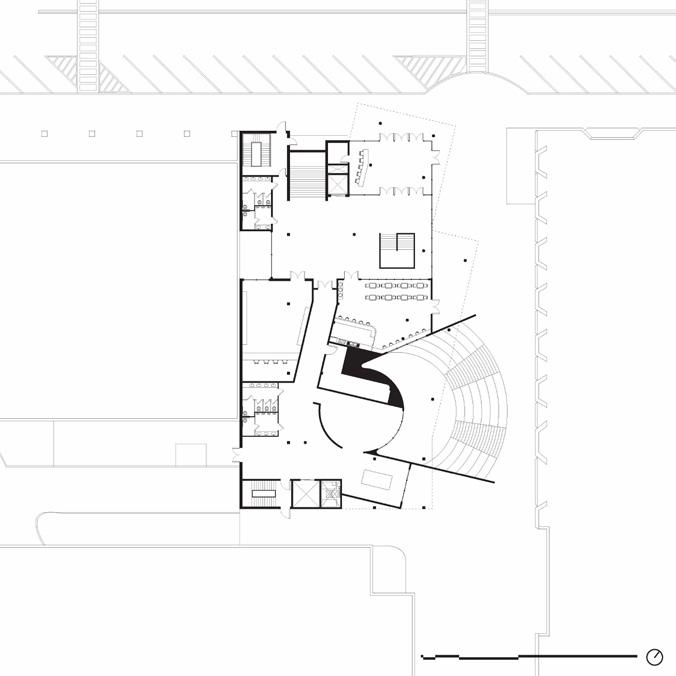
The 338-seat main theatre house is designed as the hearth of the project. In both plan and section, it sits within the center of the project. Supplementary program wraps the theatre volume, encasing it within a solid perimeter. On the exterior, the wrapping is expressed through a metal-fin system that shrouds the materiality of the theatre volume. From afar, the theatre volume rises from its encasing to crown the project.


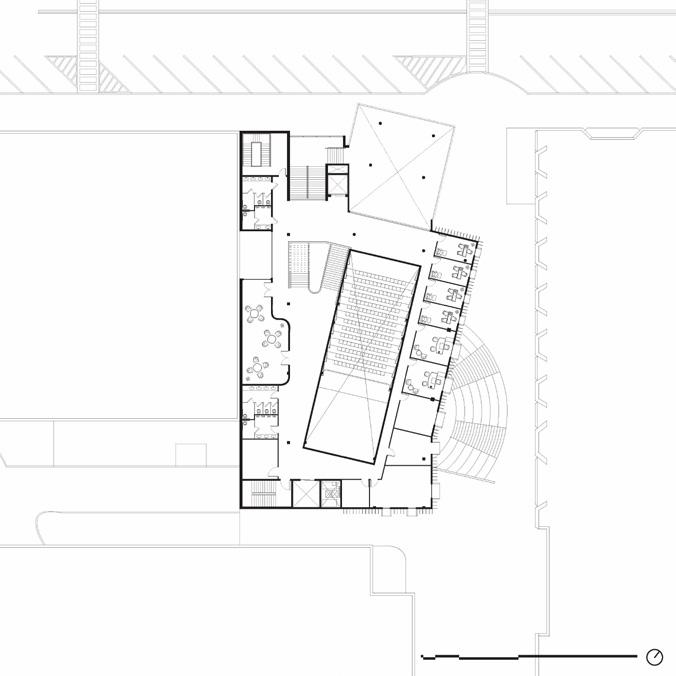
3rd Floor Plan
2nd Floor
1st
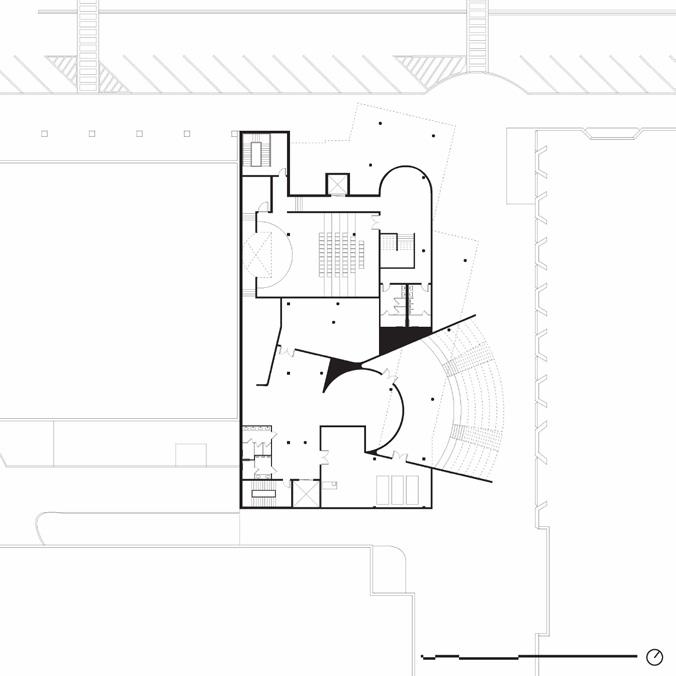


 Diagrams Modeled and Drawn by Andrew Yu; Lineweights Done by Alexander Michel
Preliminary Sketches Drawn by Andrew Yu Below Ground Plan by Andrew Yu
Floor Plan Drawn by Andrew Yu
Plan Drawn by Andrew Yu
31.
Drawn by Andrew Yu
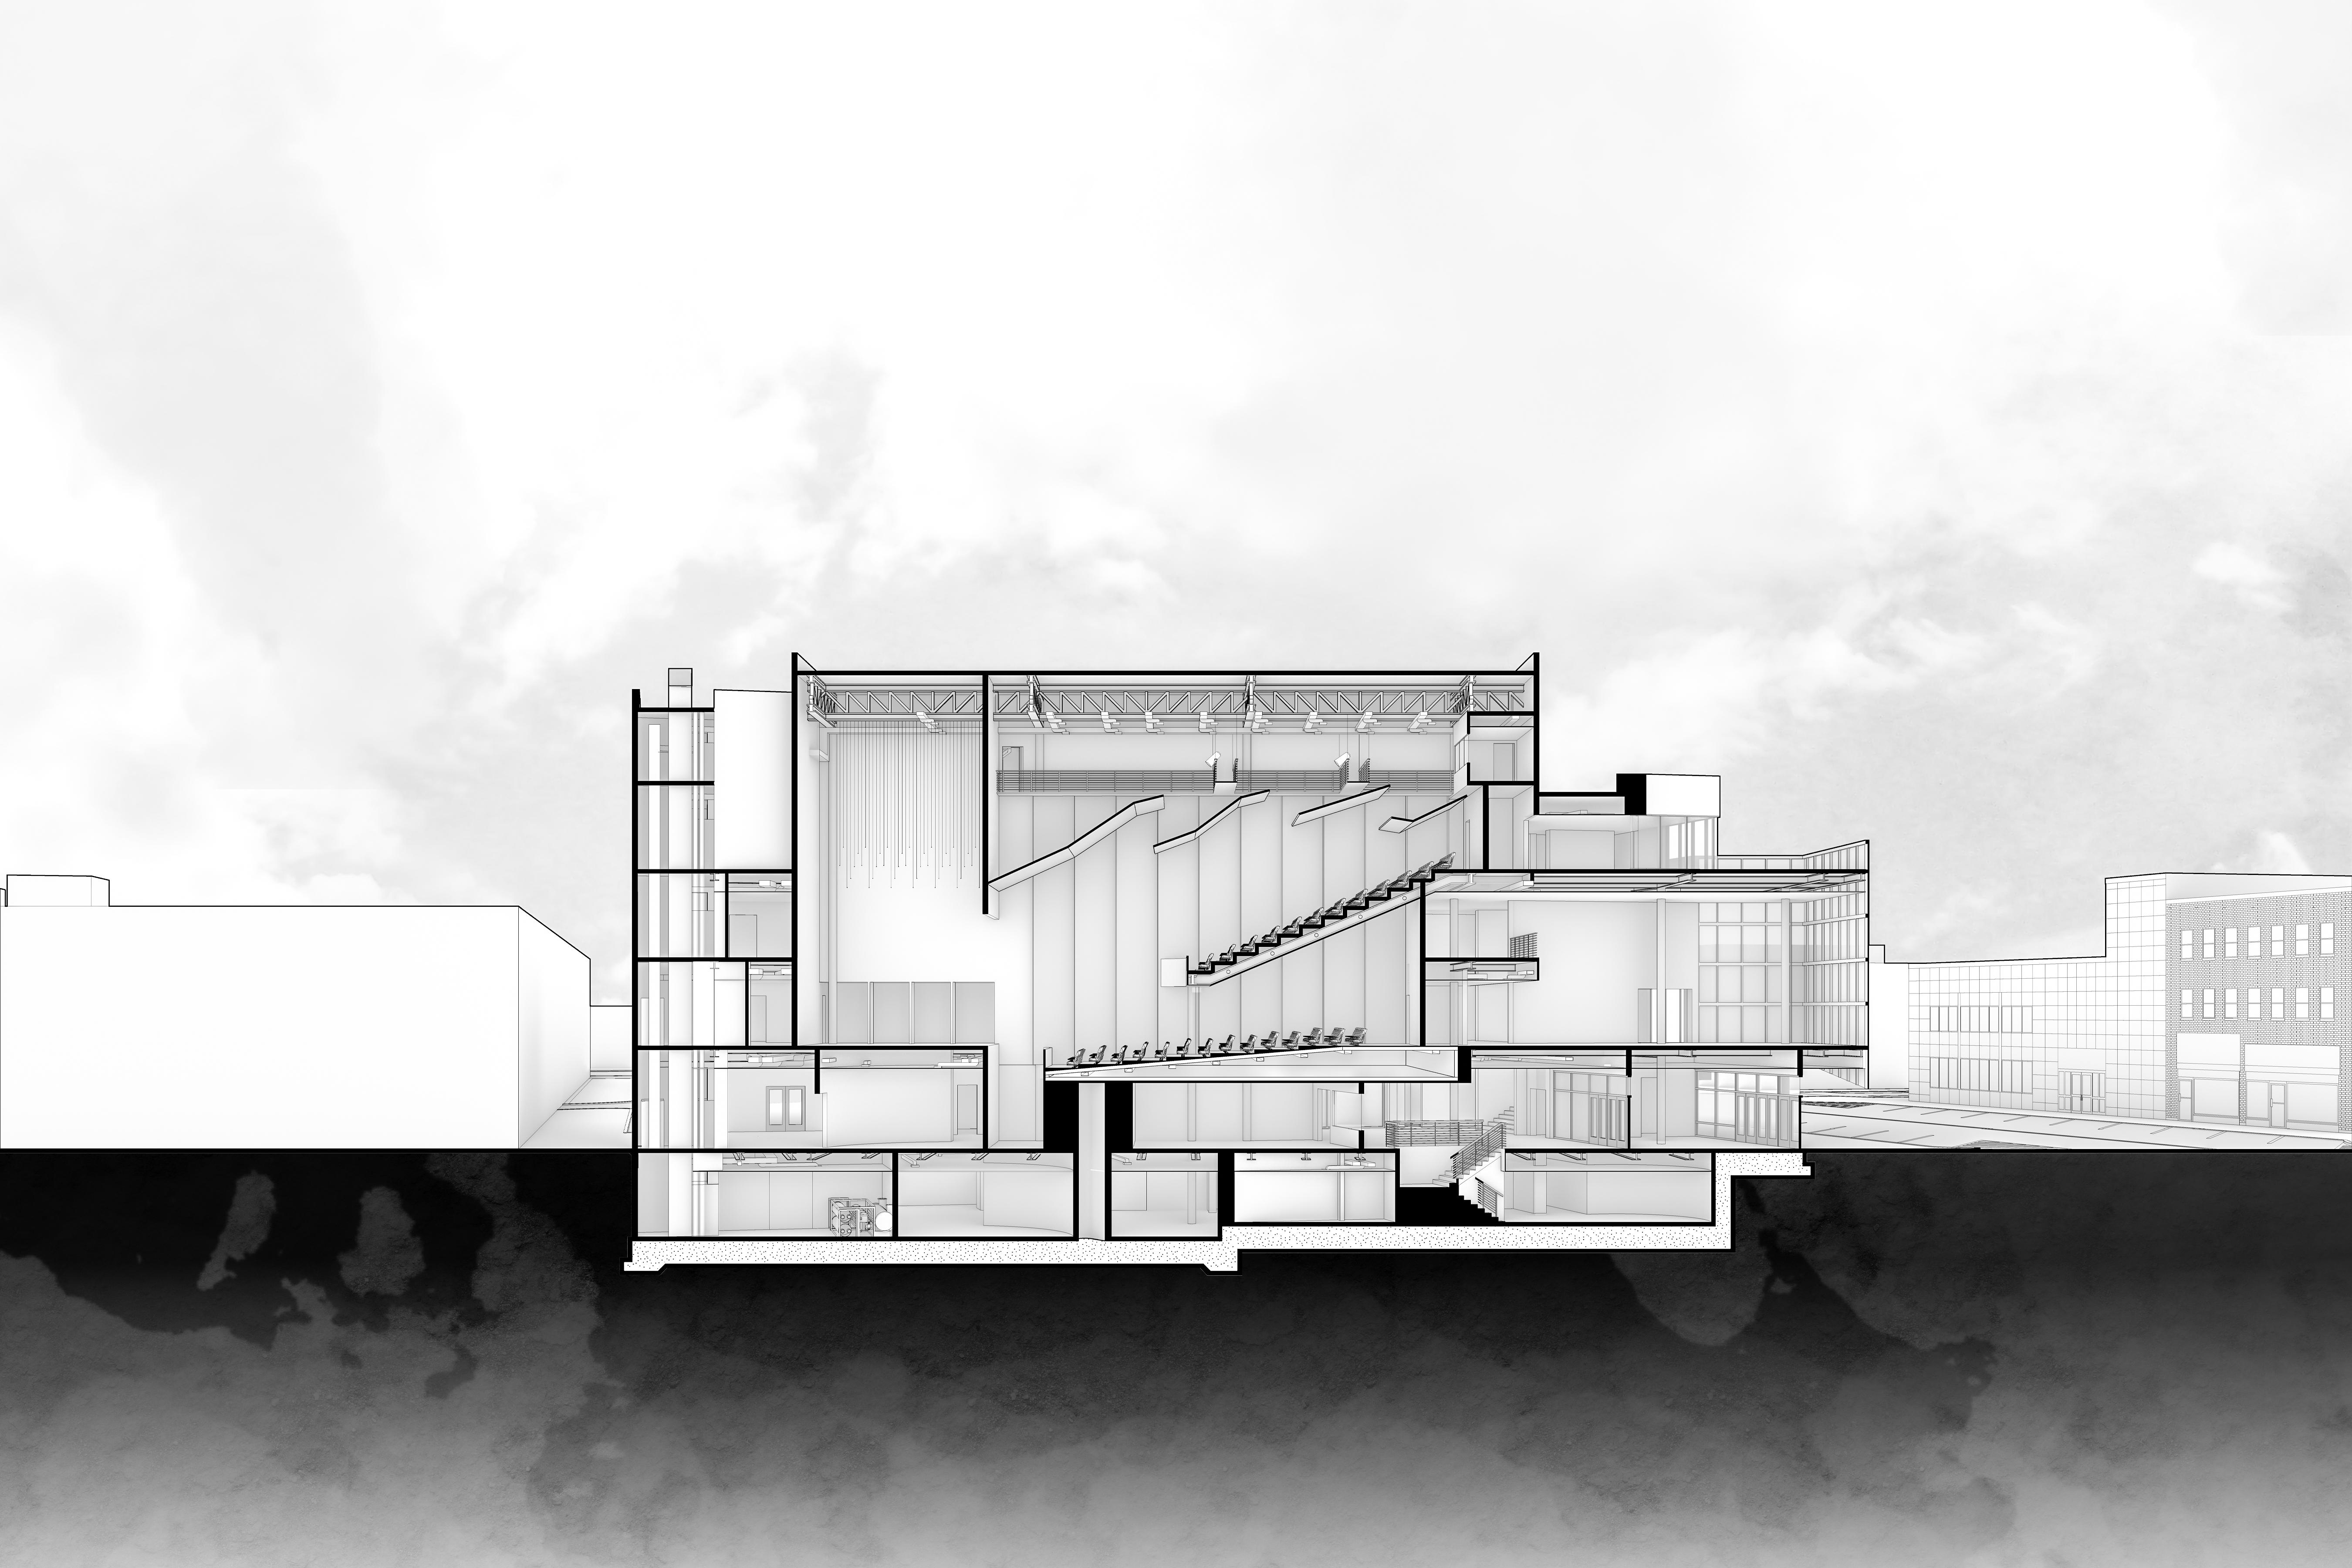
The Program Behind the Ensemble Theatre Connecting Back to Auburn // Auburn, New York
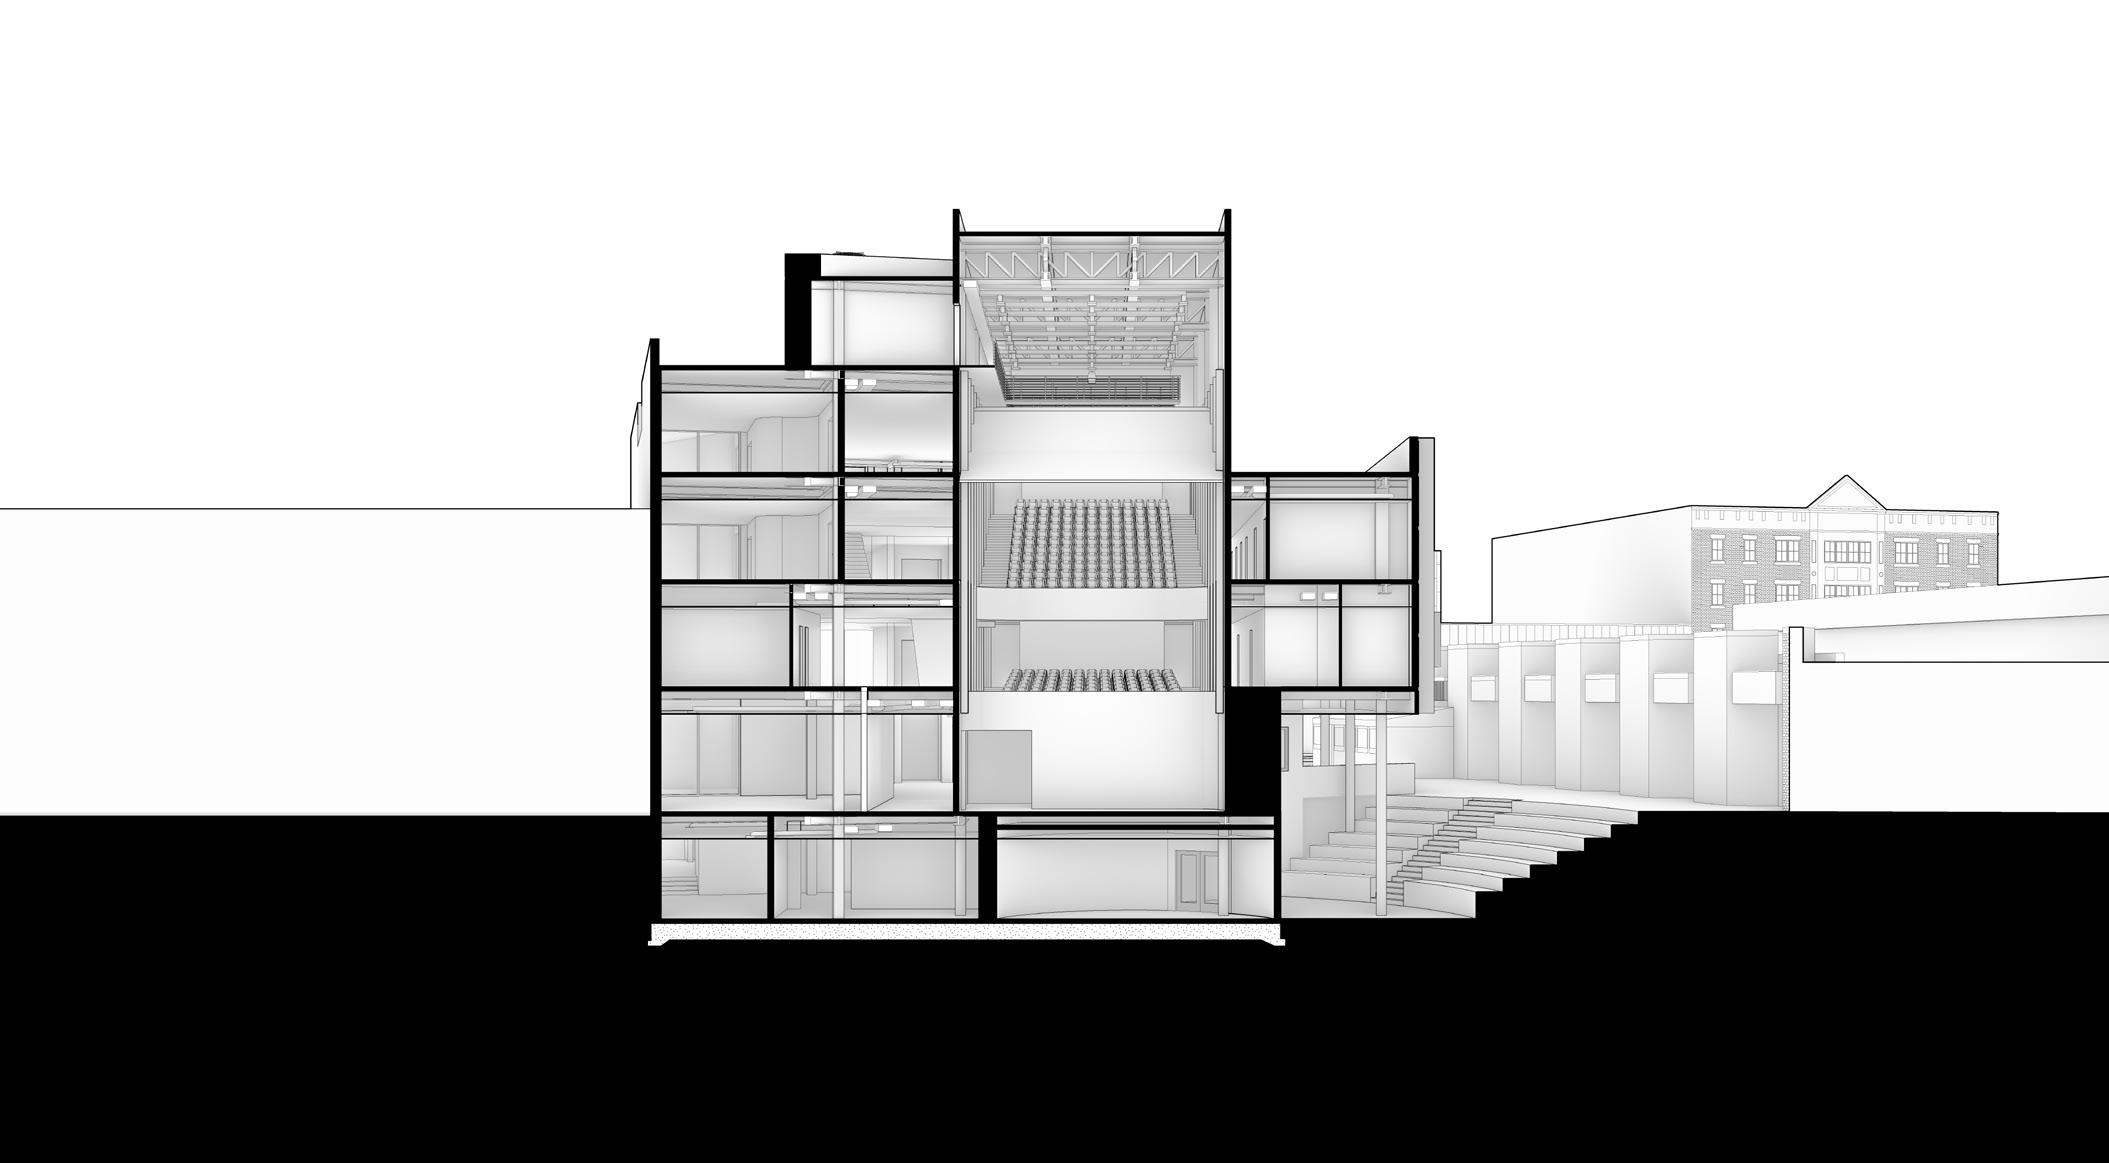
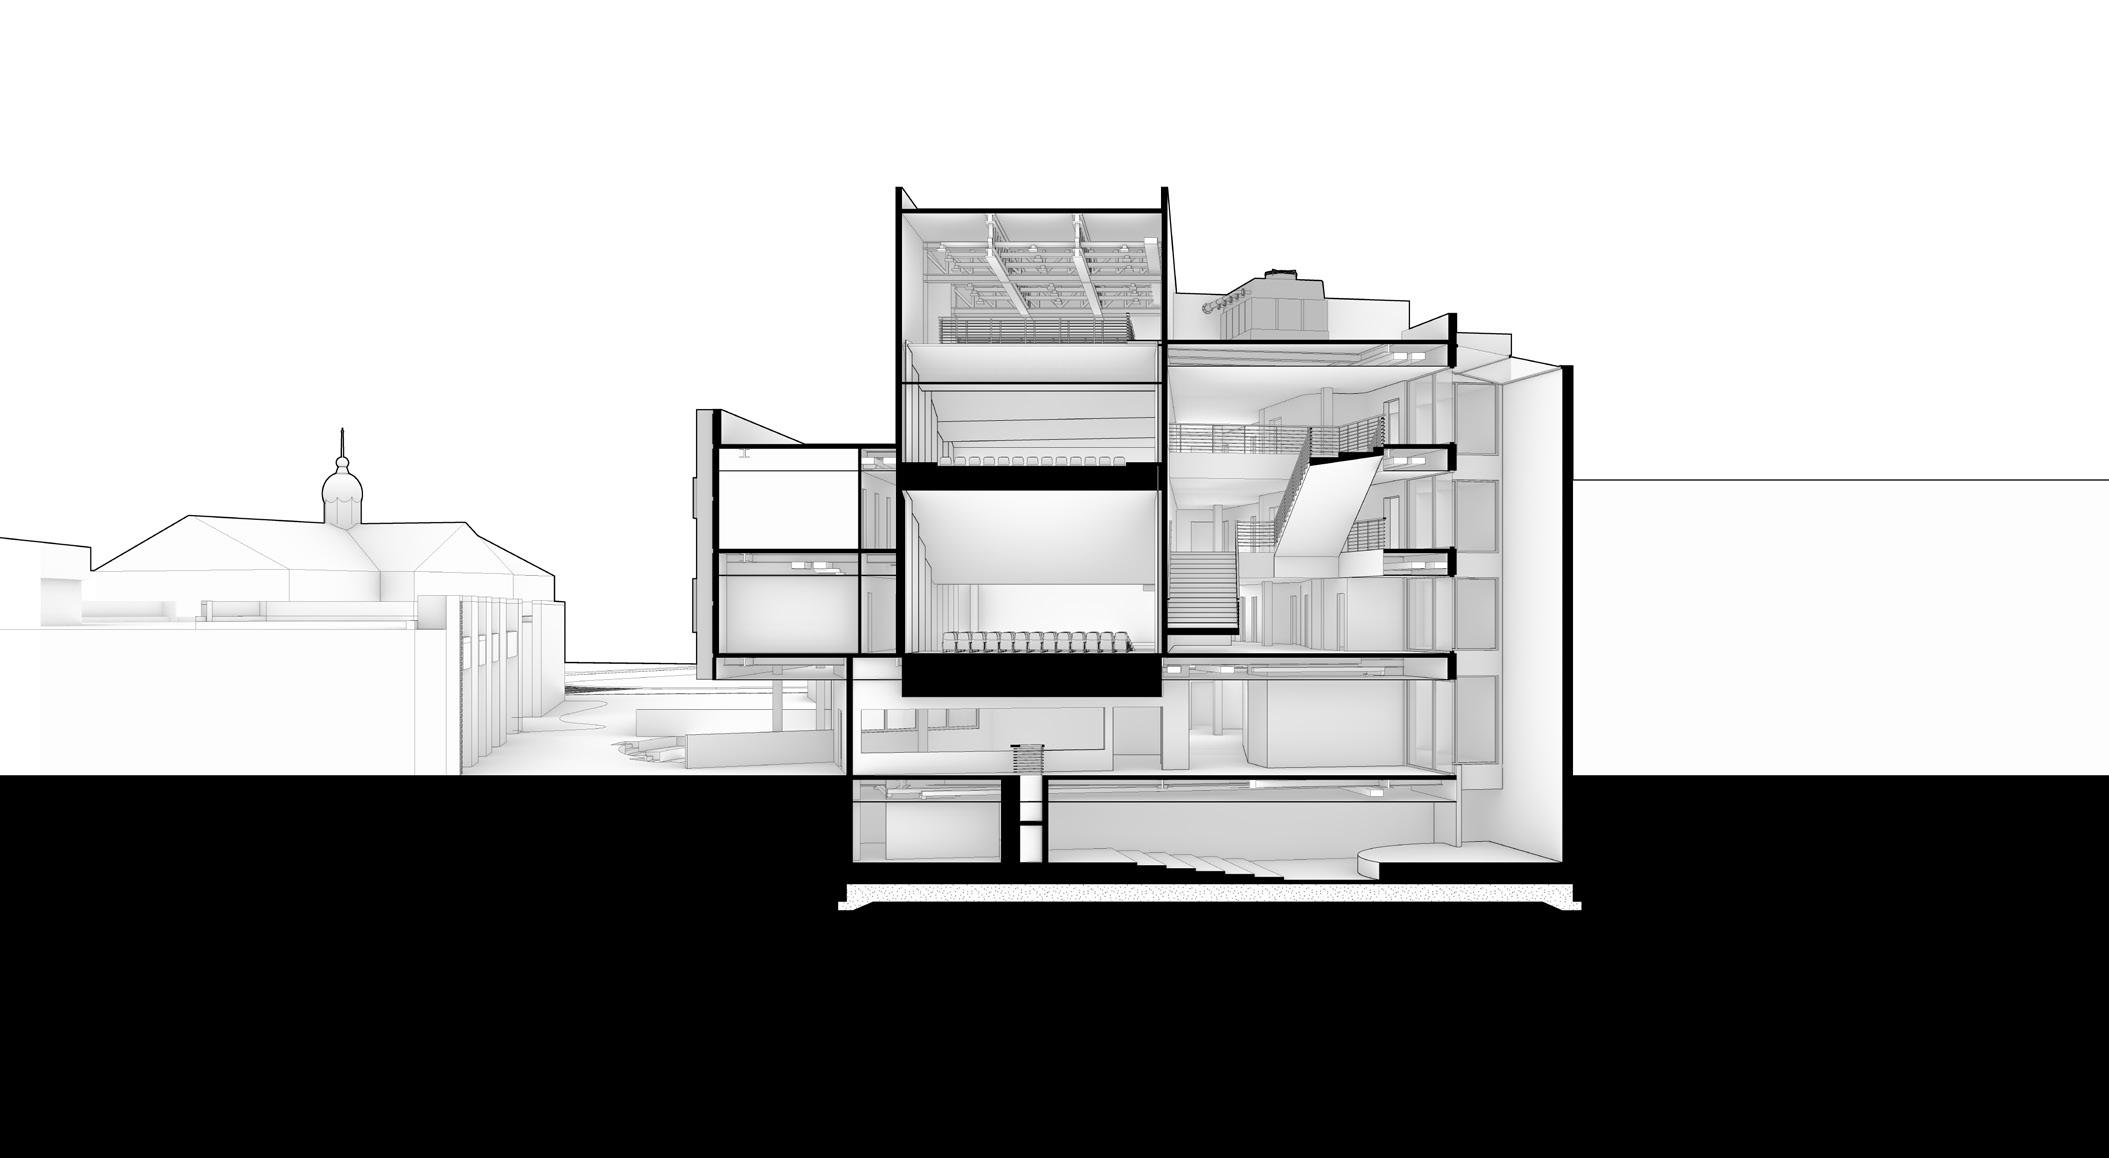
On the street level, the project is adjacent to Genesee Street, one of the main streets of Auburn, and the Exchange Street Mall, a small public walkway connecting Genesee Street with Lincoln Street. At the corner of the project, below the theatre lobby, is a glass facade leading into the lower lobby. This facade has entrances facing both adjacent streets, and dissolves the boundary between interior and exterior through its transparency. On the interior, this lobby space connects to a cafe, book and gift shop, and circulation to both upper and lower programs. Further along the Exchange Street Mall, the facade is interrupted by an excavated space that serves as a public outdoor amphitheatre.
The amphitheatre formally engages with the mall, gesturally reaching out into the space. The amphitheatre operates as an outdoor performance space, and while not in use, provides a location for public gathering along the Mall. The lowest level of the amphitheatre leads into the below-ground floor of the project, containing an 84-seat multi-use auditorium, back of house spaces for service, and the mechanical and electrical equipment rooms. The auditorium is the only public program below ground, entered through a staircase in the main lobby. The auditorium is backed by a large light well that extends up against the existing adjacent building throughout the entirety of the project. On floors above, this light well is exposed through a floor-to-ceiling glass wall.
North-West Section Drawn by Andrew Yu 32.
Designing the Ensemble Theatre
Exterior Conditions // Auburn, New York
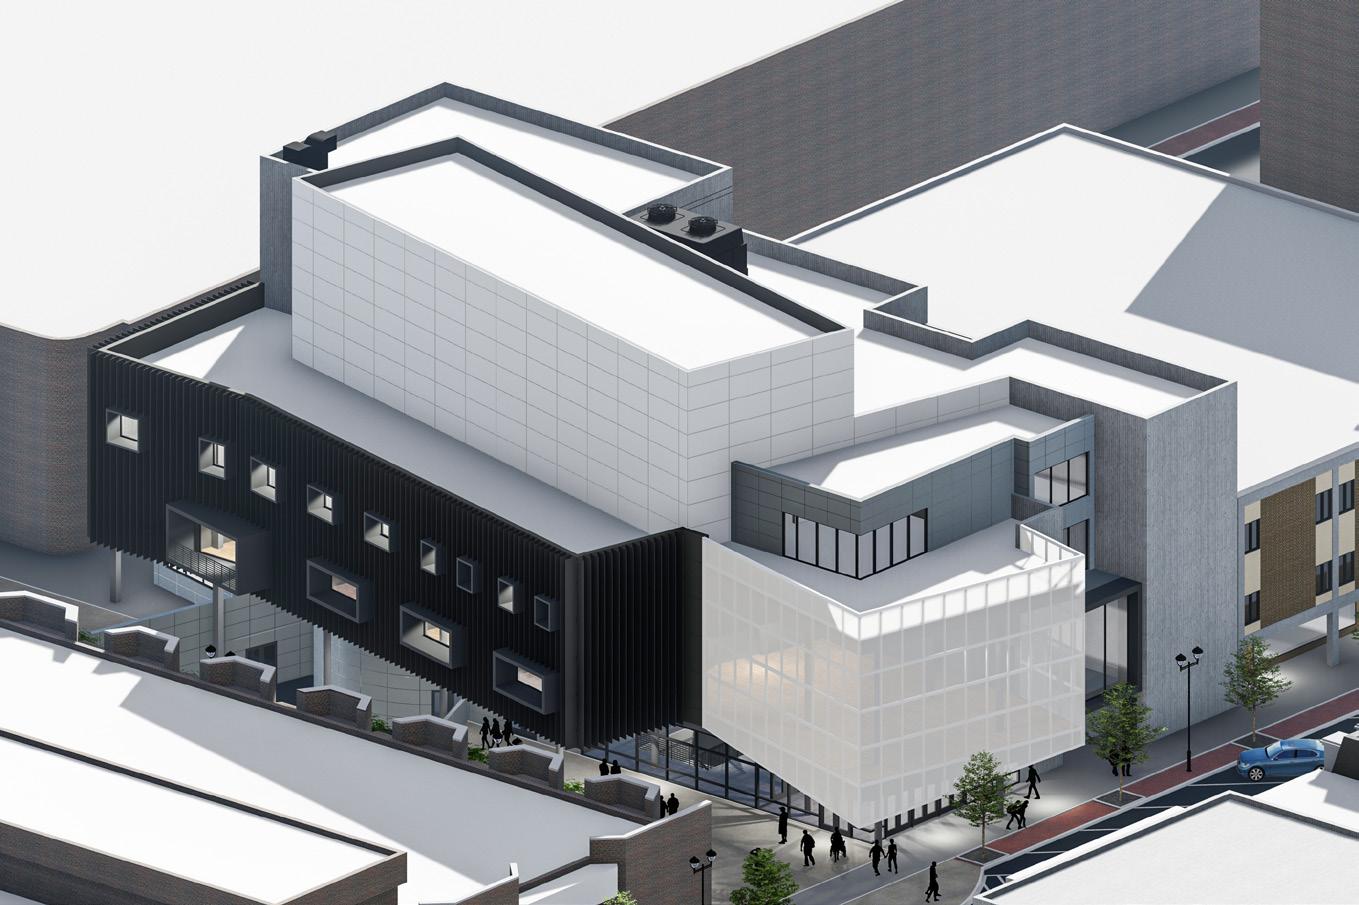
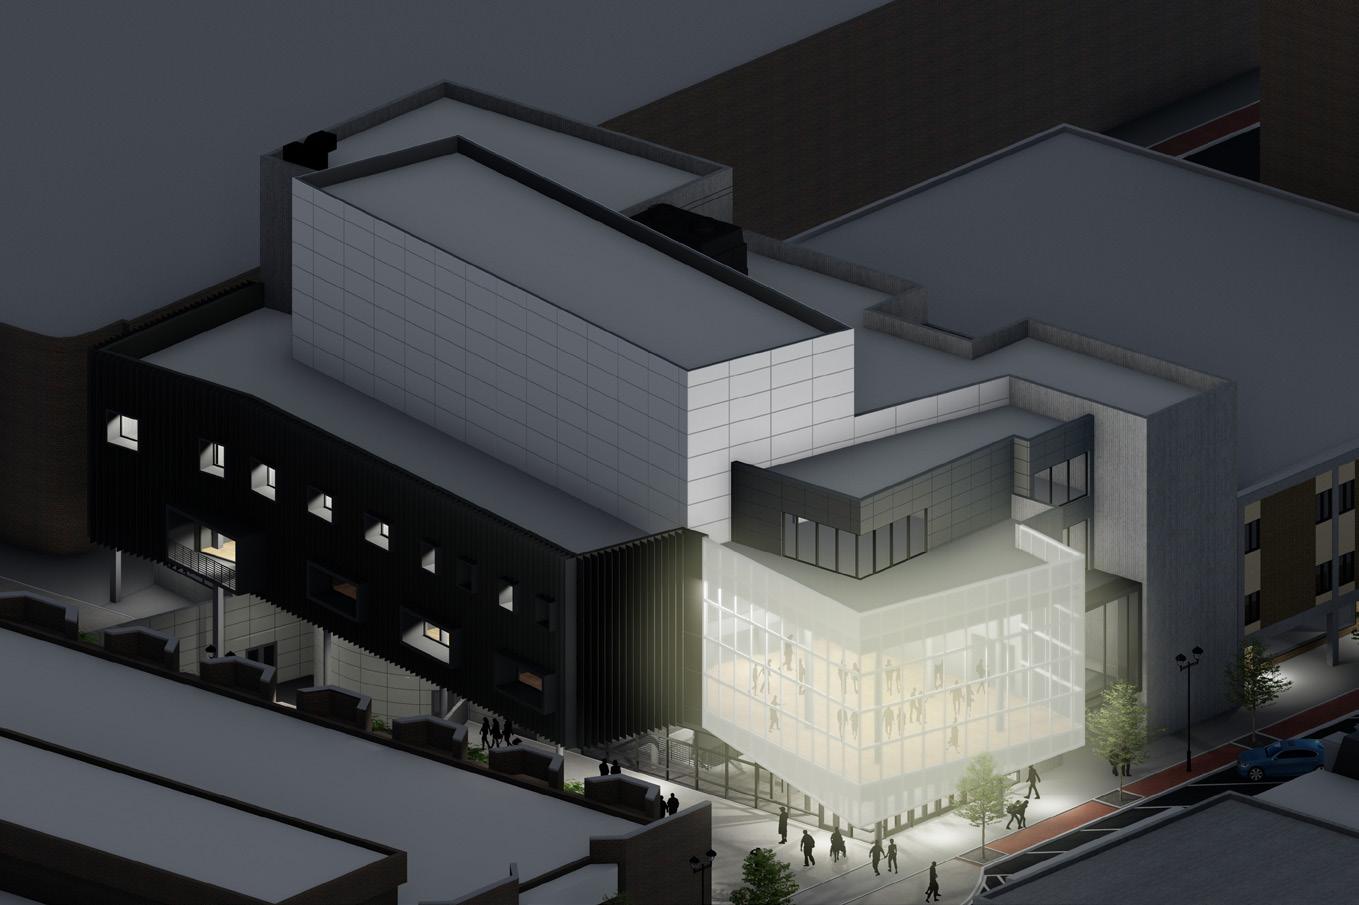
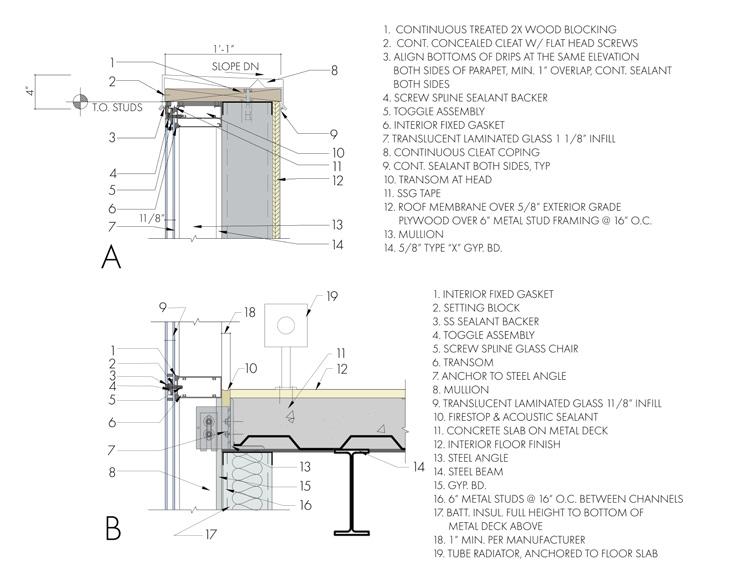
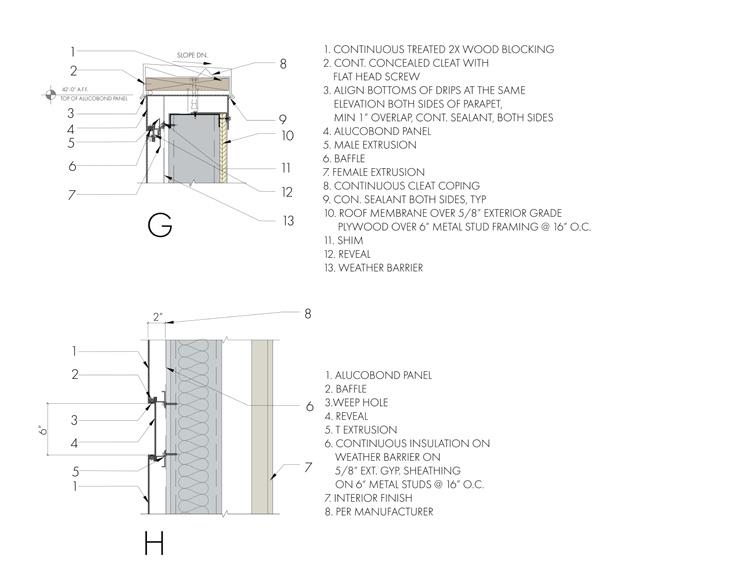
During the day the front volume has a soft, translucent surface; at night the volume lights up from within, projecting the interior onto the facade and acting as a beacon to downtown Auburn. The amphitheatre connects the theatre to the rest of the public, activating the street. By bringing people to the ampitheatre, the adjacent mall is also activated.



 Outdoor Amphitheathre Rendered by Andrew Yu
Nighttime Axonmetric Rendered by Andrew Yu
Daytime Axonmetric Rendered by Andrew Yu
Detailing Drawn by Andrew Yu East-West Section Drawn by Andrew Yu
33.
East-West Section Drawn by Andrew Yu
VAULTING WALLS
Brick Computational Fabrication
Fall 2023

Type: Robotic Assembly
Location: Princeton, New Jersey
Category: Academic Work
Instructor: Arash Adel
Role: Collaborative Work with JoJo Ma and Yuki Cao
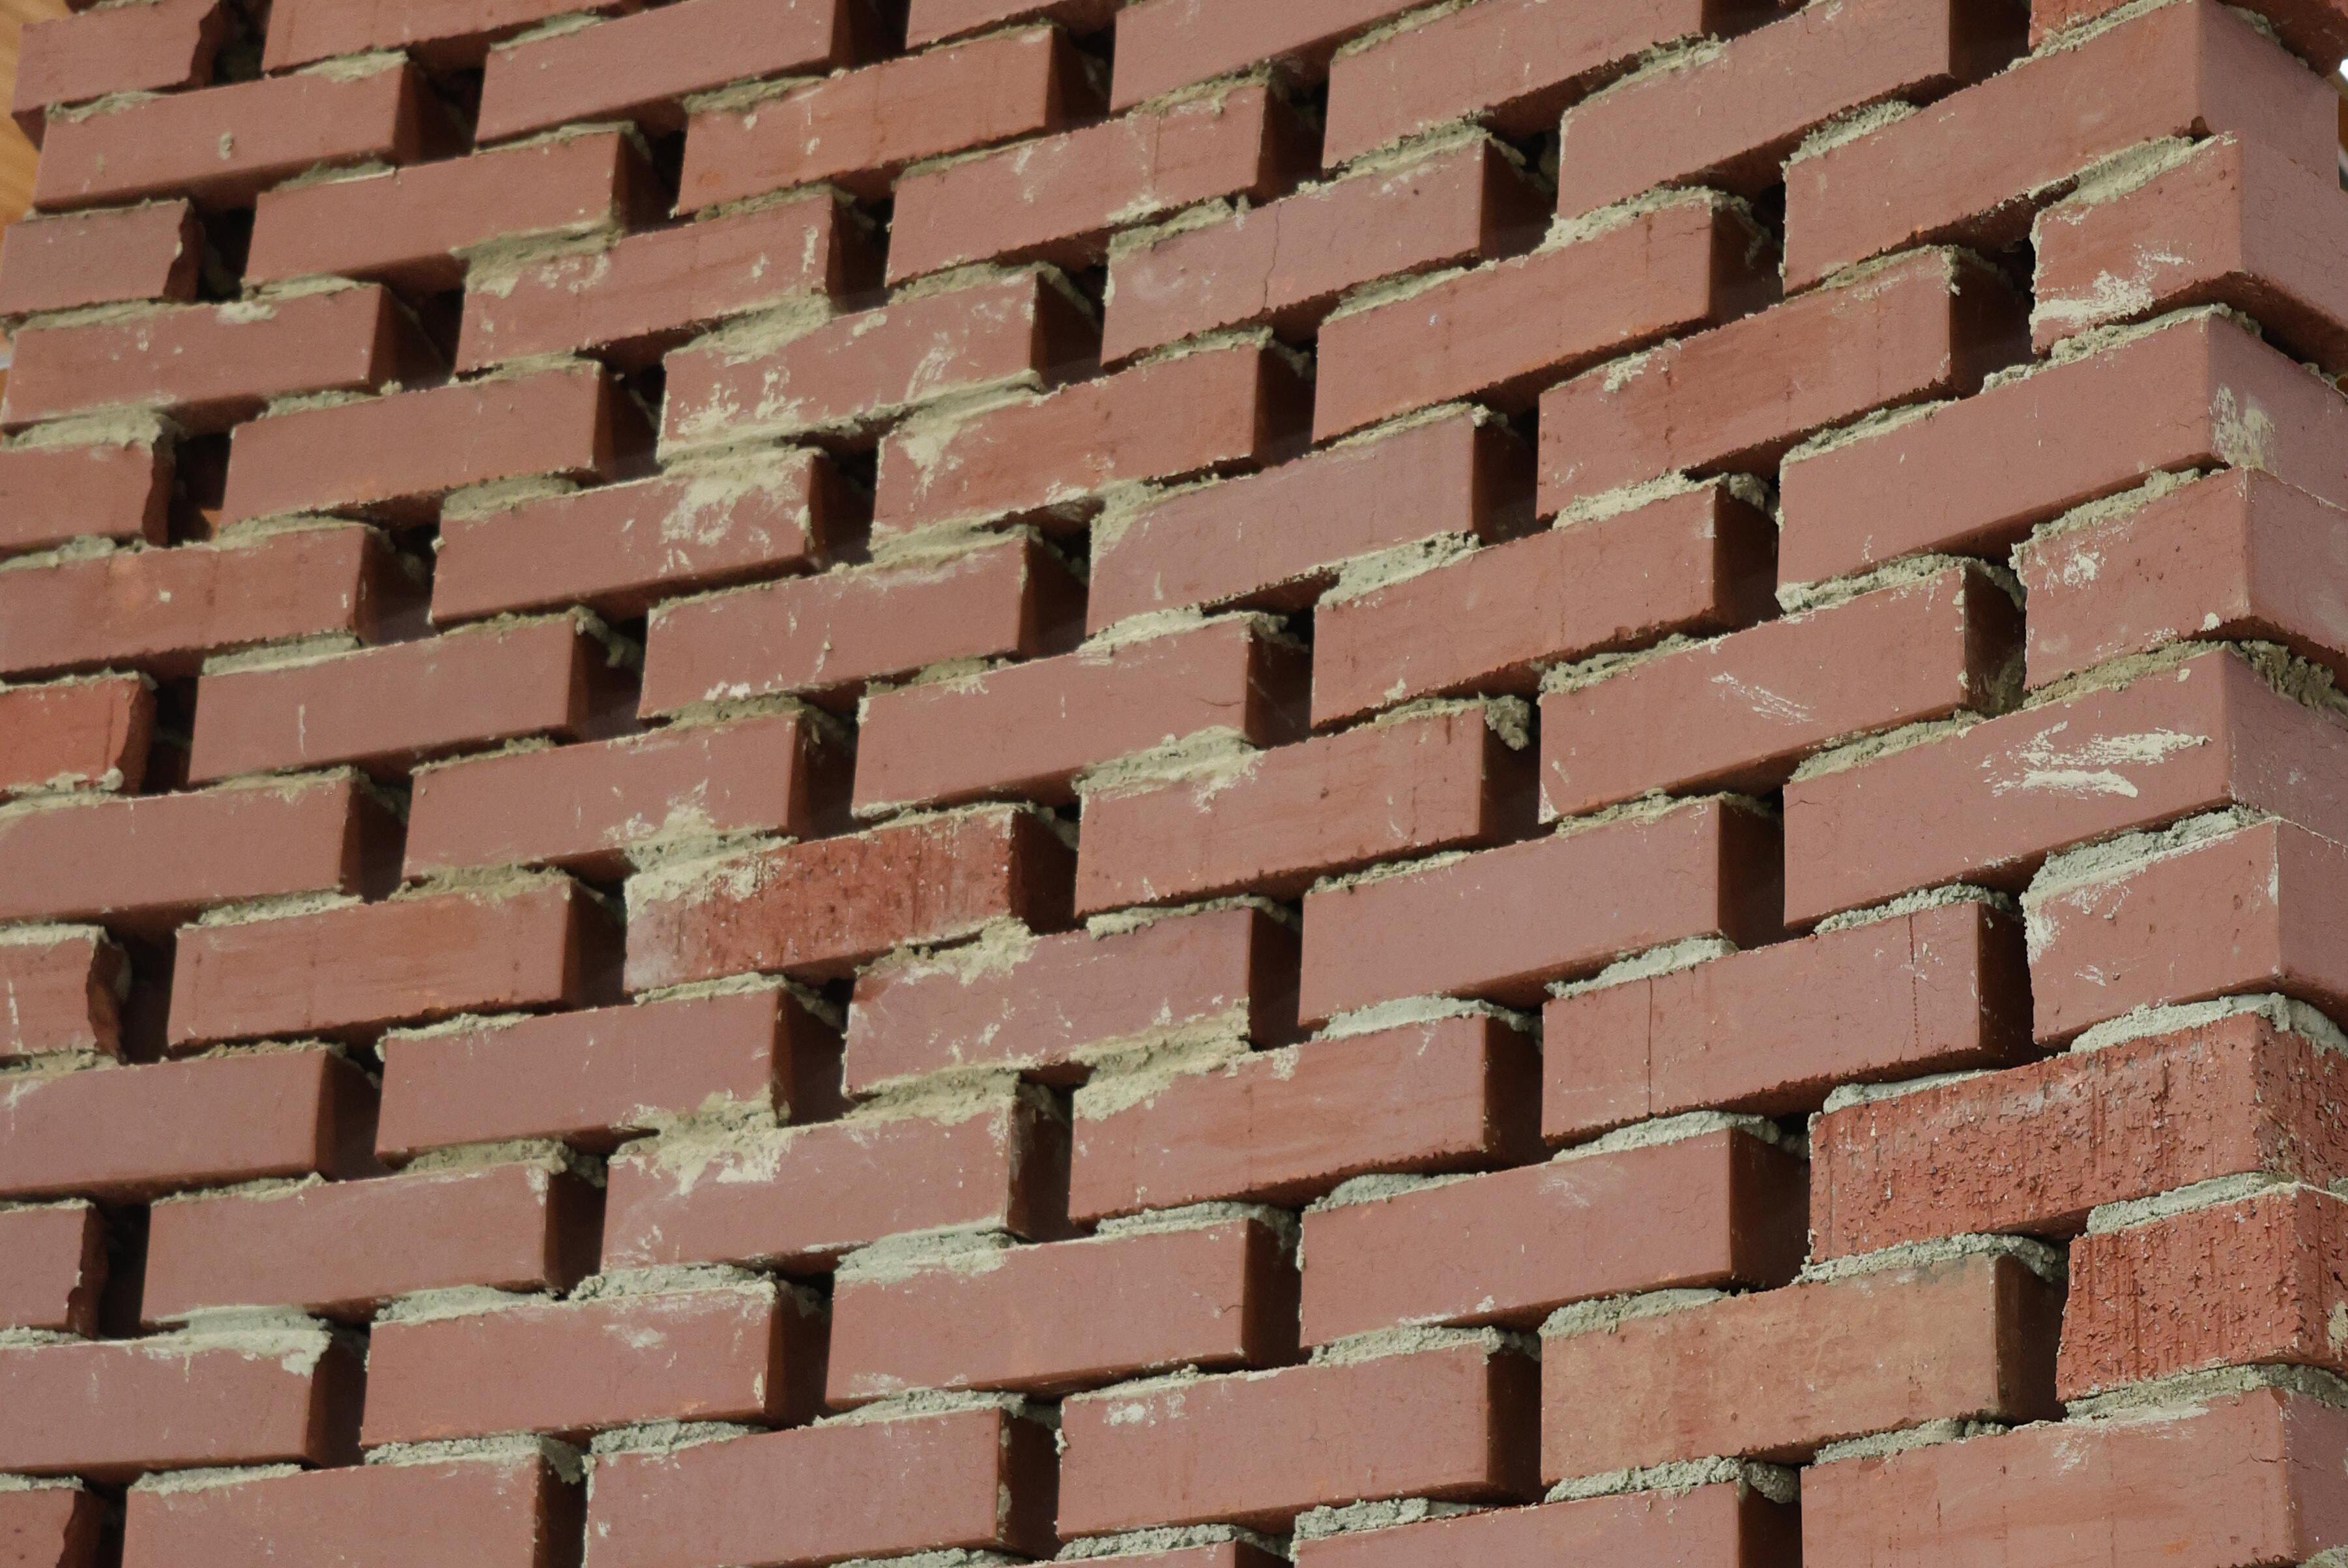
The realization of a parametrically and computationally generated brick wall through digital and robotic fabrication presented multiple challenges that required a breadth of knowledge to be acquired related to the material property for successful assembly and design. Thus, as knowledge was acquired, whether it was through physical or computational experimentation, it was then implemented chronologically, affecting the design cyclically. The overall framework of the labor involved in computational design is similar to traditional design methodologies in the sense that it is also non-linear, following a cyclical workflow where parts of the design are influenced by external critical information. However the difference comes from the objectivity of this information; whereas in traditional approaches to design this information is fed from a client, a professor or some subjective interpretation of the design, in computational design, the information is a conclusion that is only drawn after trial-and-error. That doesn’t, however, mean that with computational design, the designer lacks agency to enact subjective design decisions. Rather, the designer’s role is secondary to the material’s properties as it pertains to its assembly via a robotic arm. Therefore, computational design is an objective data-informed approach to design, and the architect’s role becomes the curator of said data.
[8] 34.
Double-Curved Brick Vaulting Walls
Learning from Computational Fabrication // Princeton, New Jersey
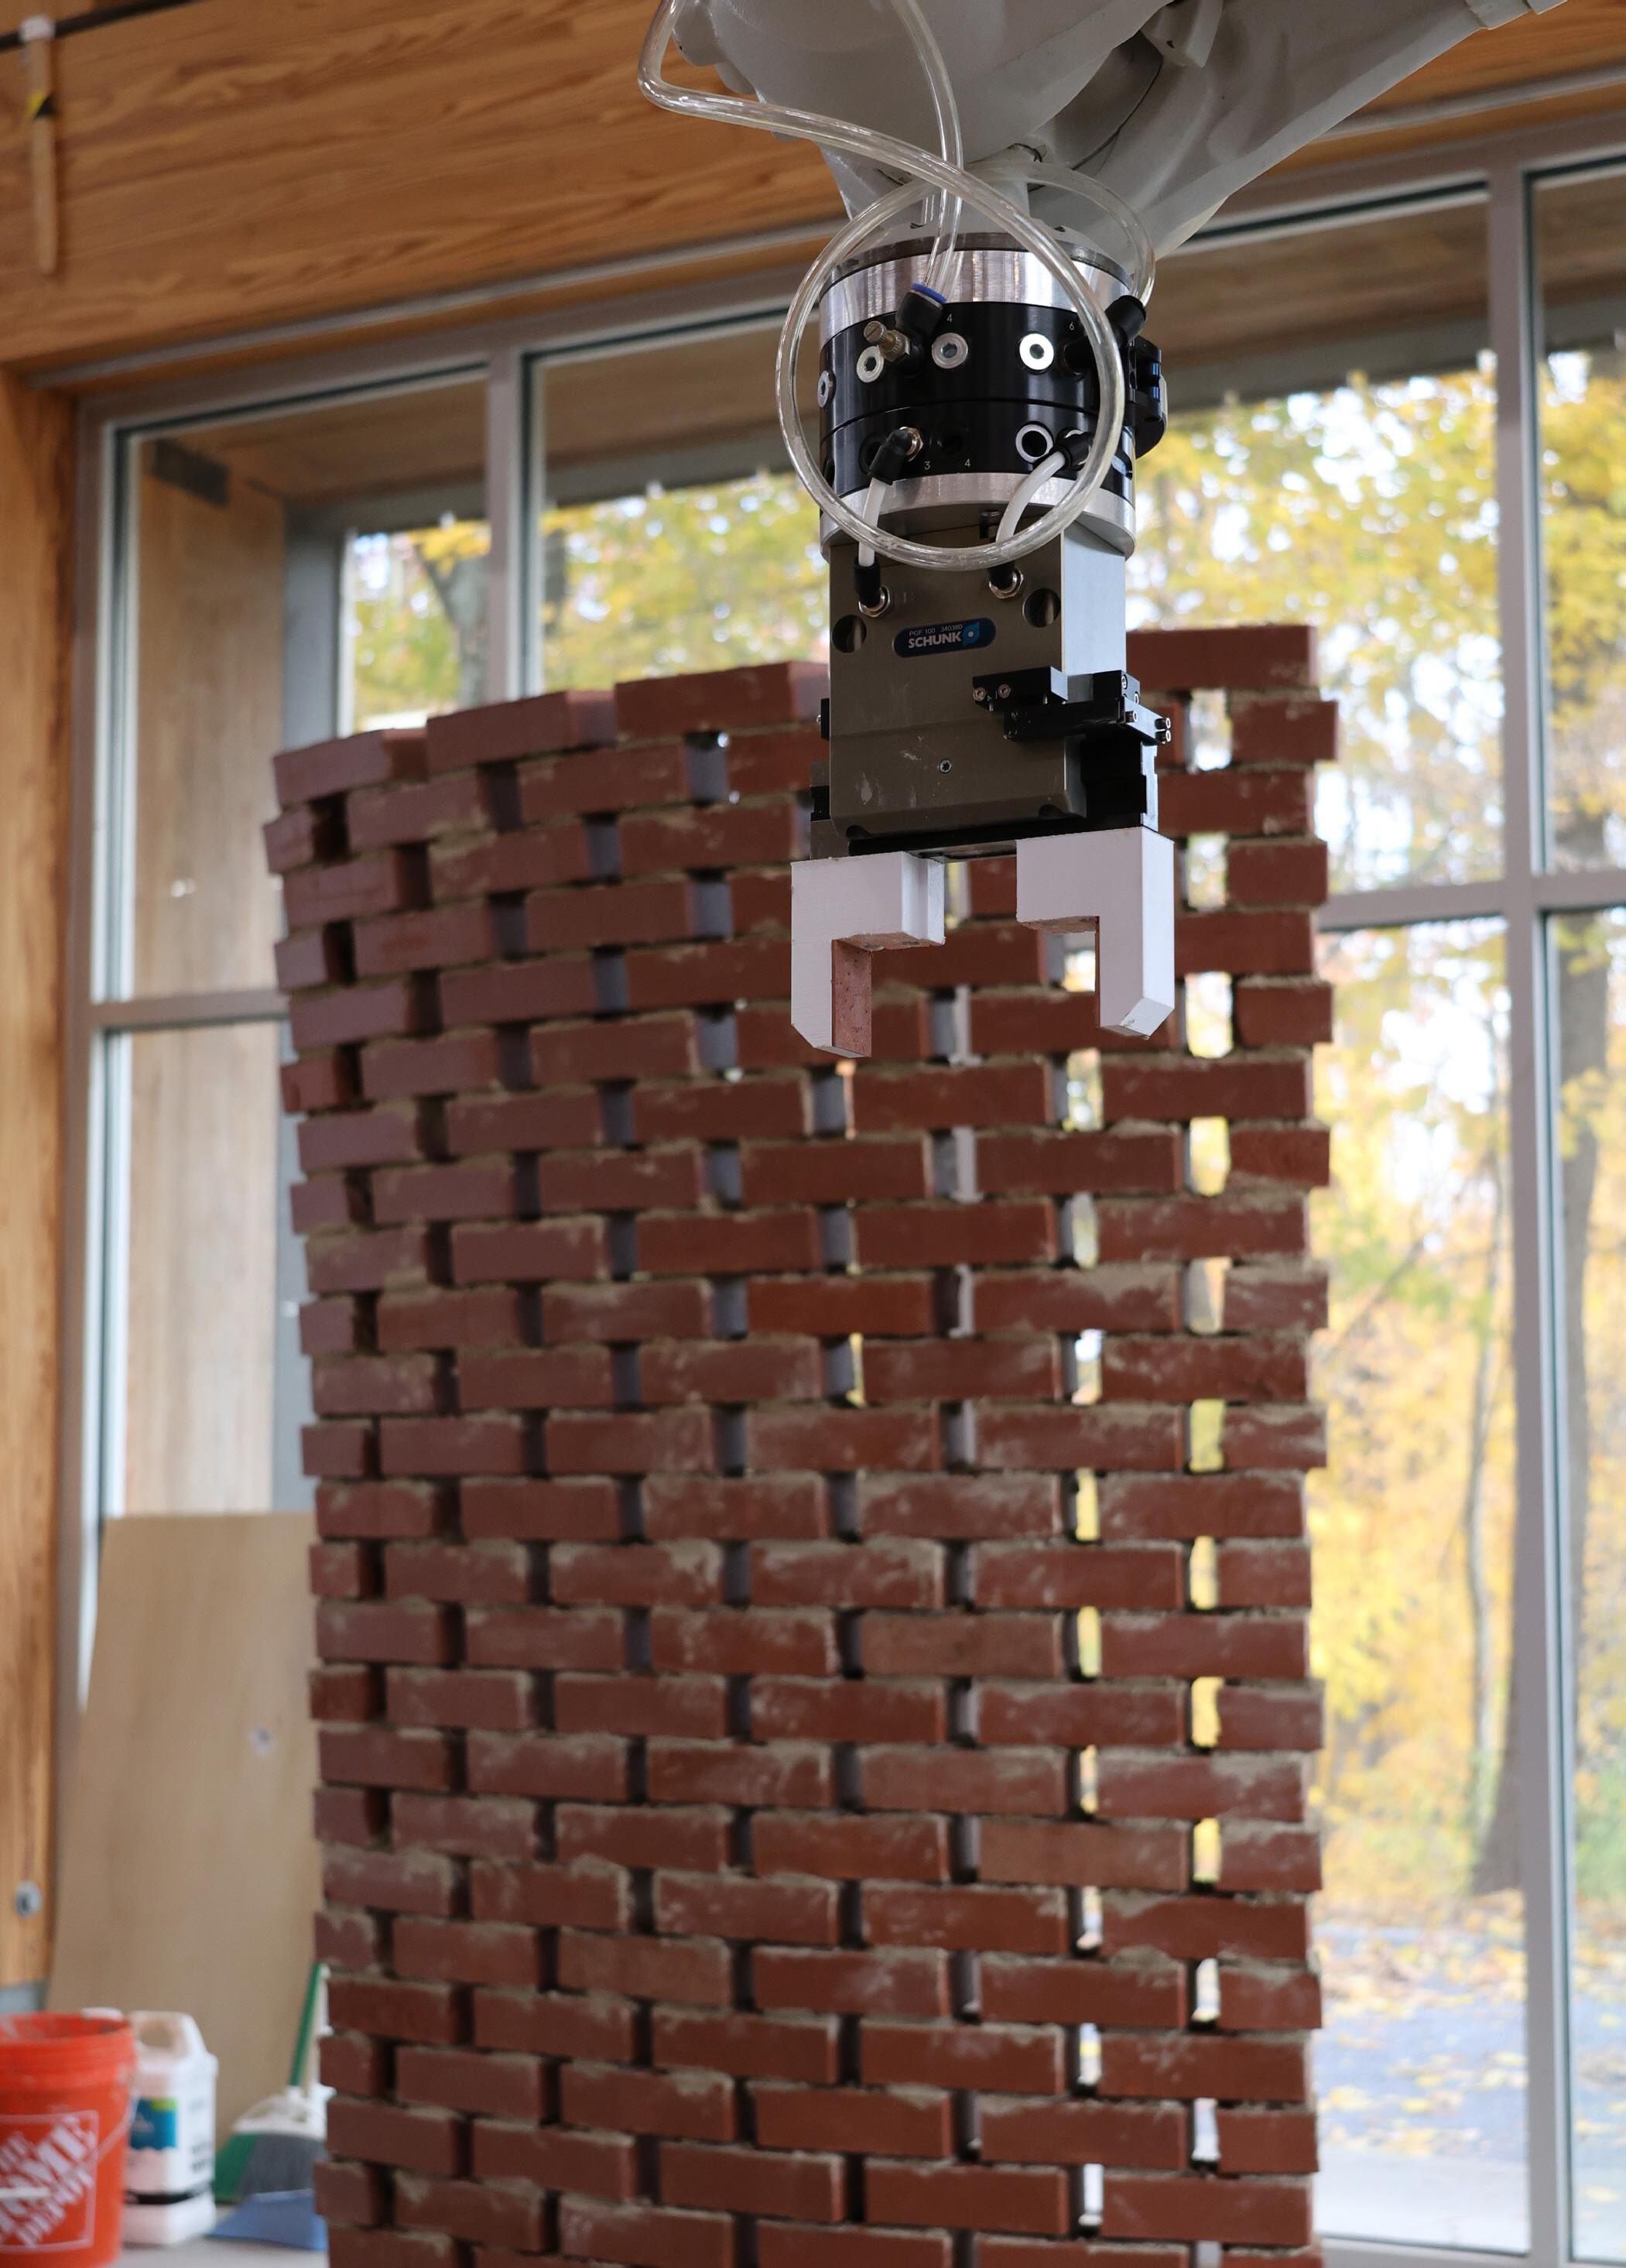
Breaking down this project chronologically, hardships stemmed from the difficulty in grasping the material’s physical properties, the translation of a strictly computational script to robotic fabrication, the scaling of the fabrication from the small robotic arm to the large scale robot, and the physics of the fully fabricated brick wall. Further challenges would have arisen if we were given an empty canvas, rather than a pre-written script. This script, while bridging a gap of knowledge which itself would likely require weeks of further training, influenced every group’s design dramatically because it became the basic lexicon for further intervention. All-in-all, the challenges experienced were rooted in a lack of knowledge and experience from the entire group regarding brick, robots, and computational coding.
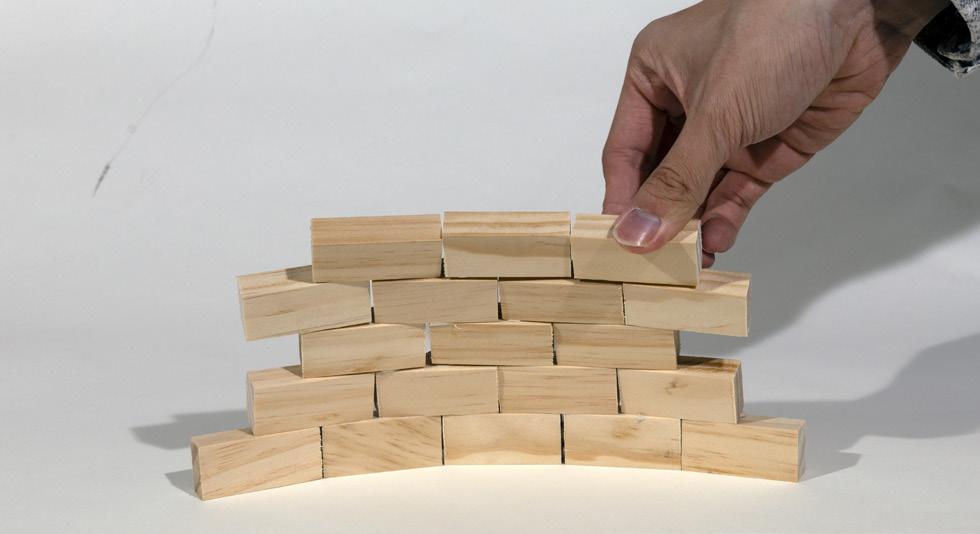


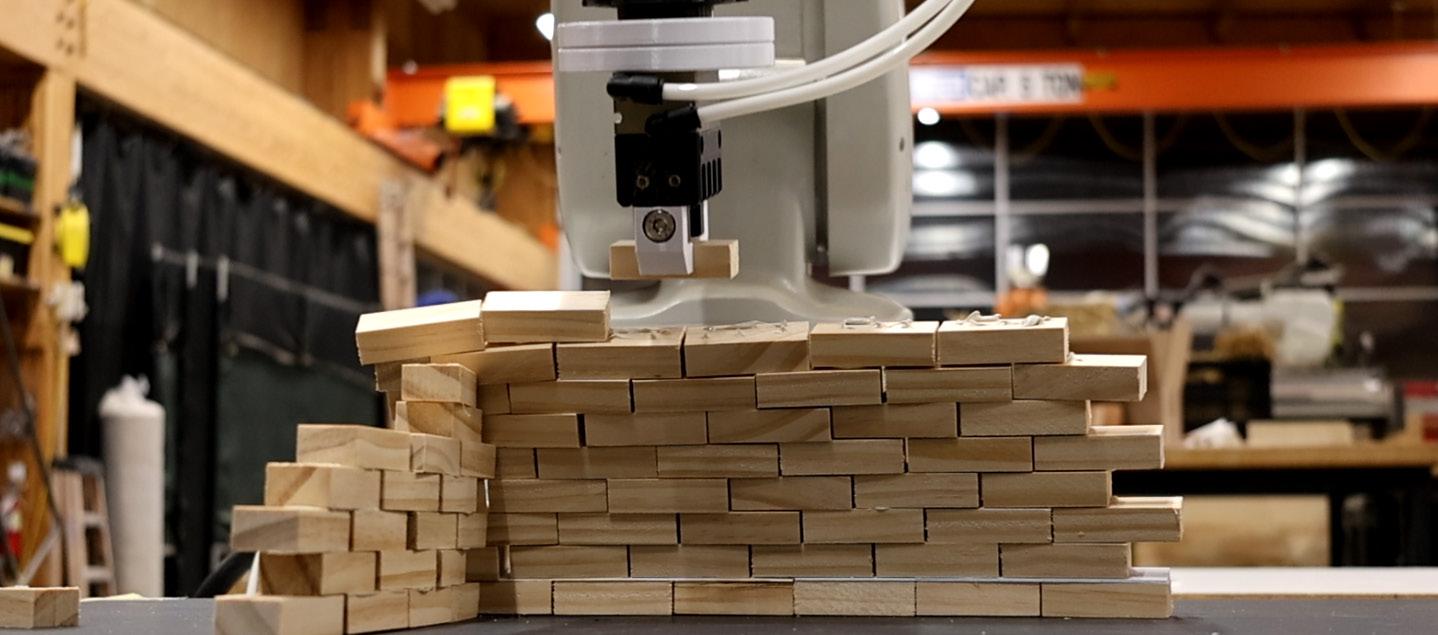
 Machine Assembled Prototype for the Double-Curved Wall
Hand Assembled Prototype for the Double-Curved Wall Jig Developed After Learning from the Machine
35.
Robotic Arm used for Full-Scale Fabrication of the Double-Curved Wall


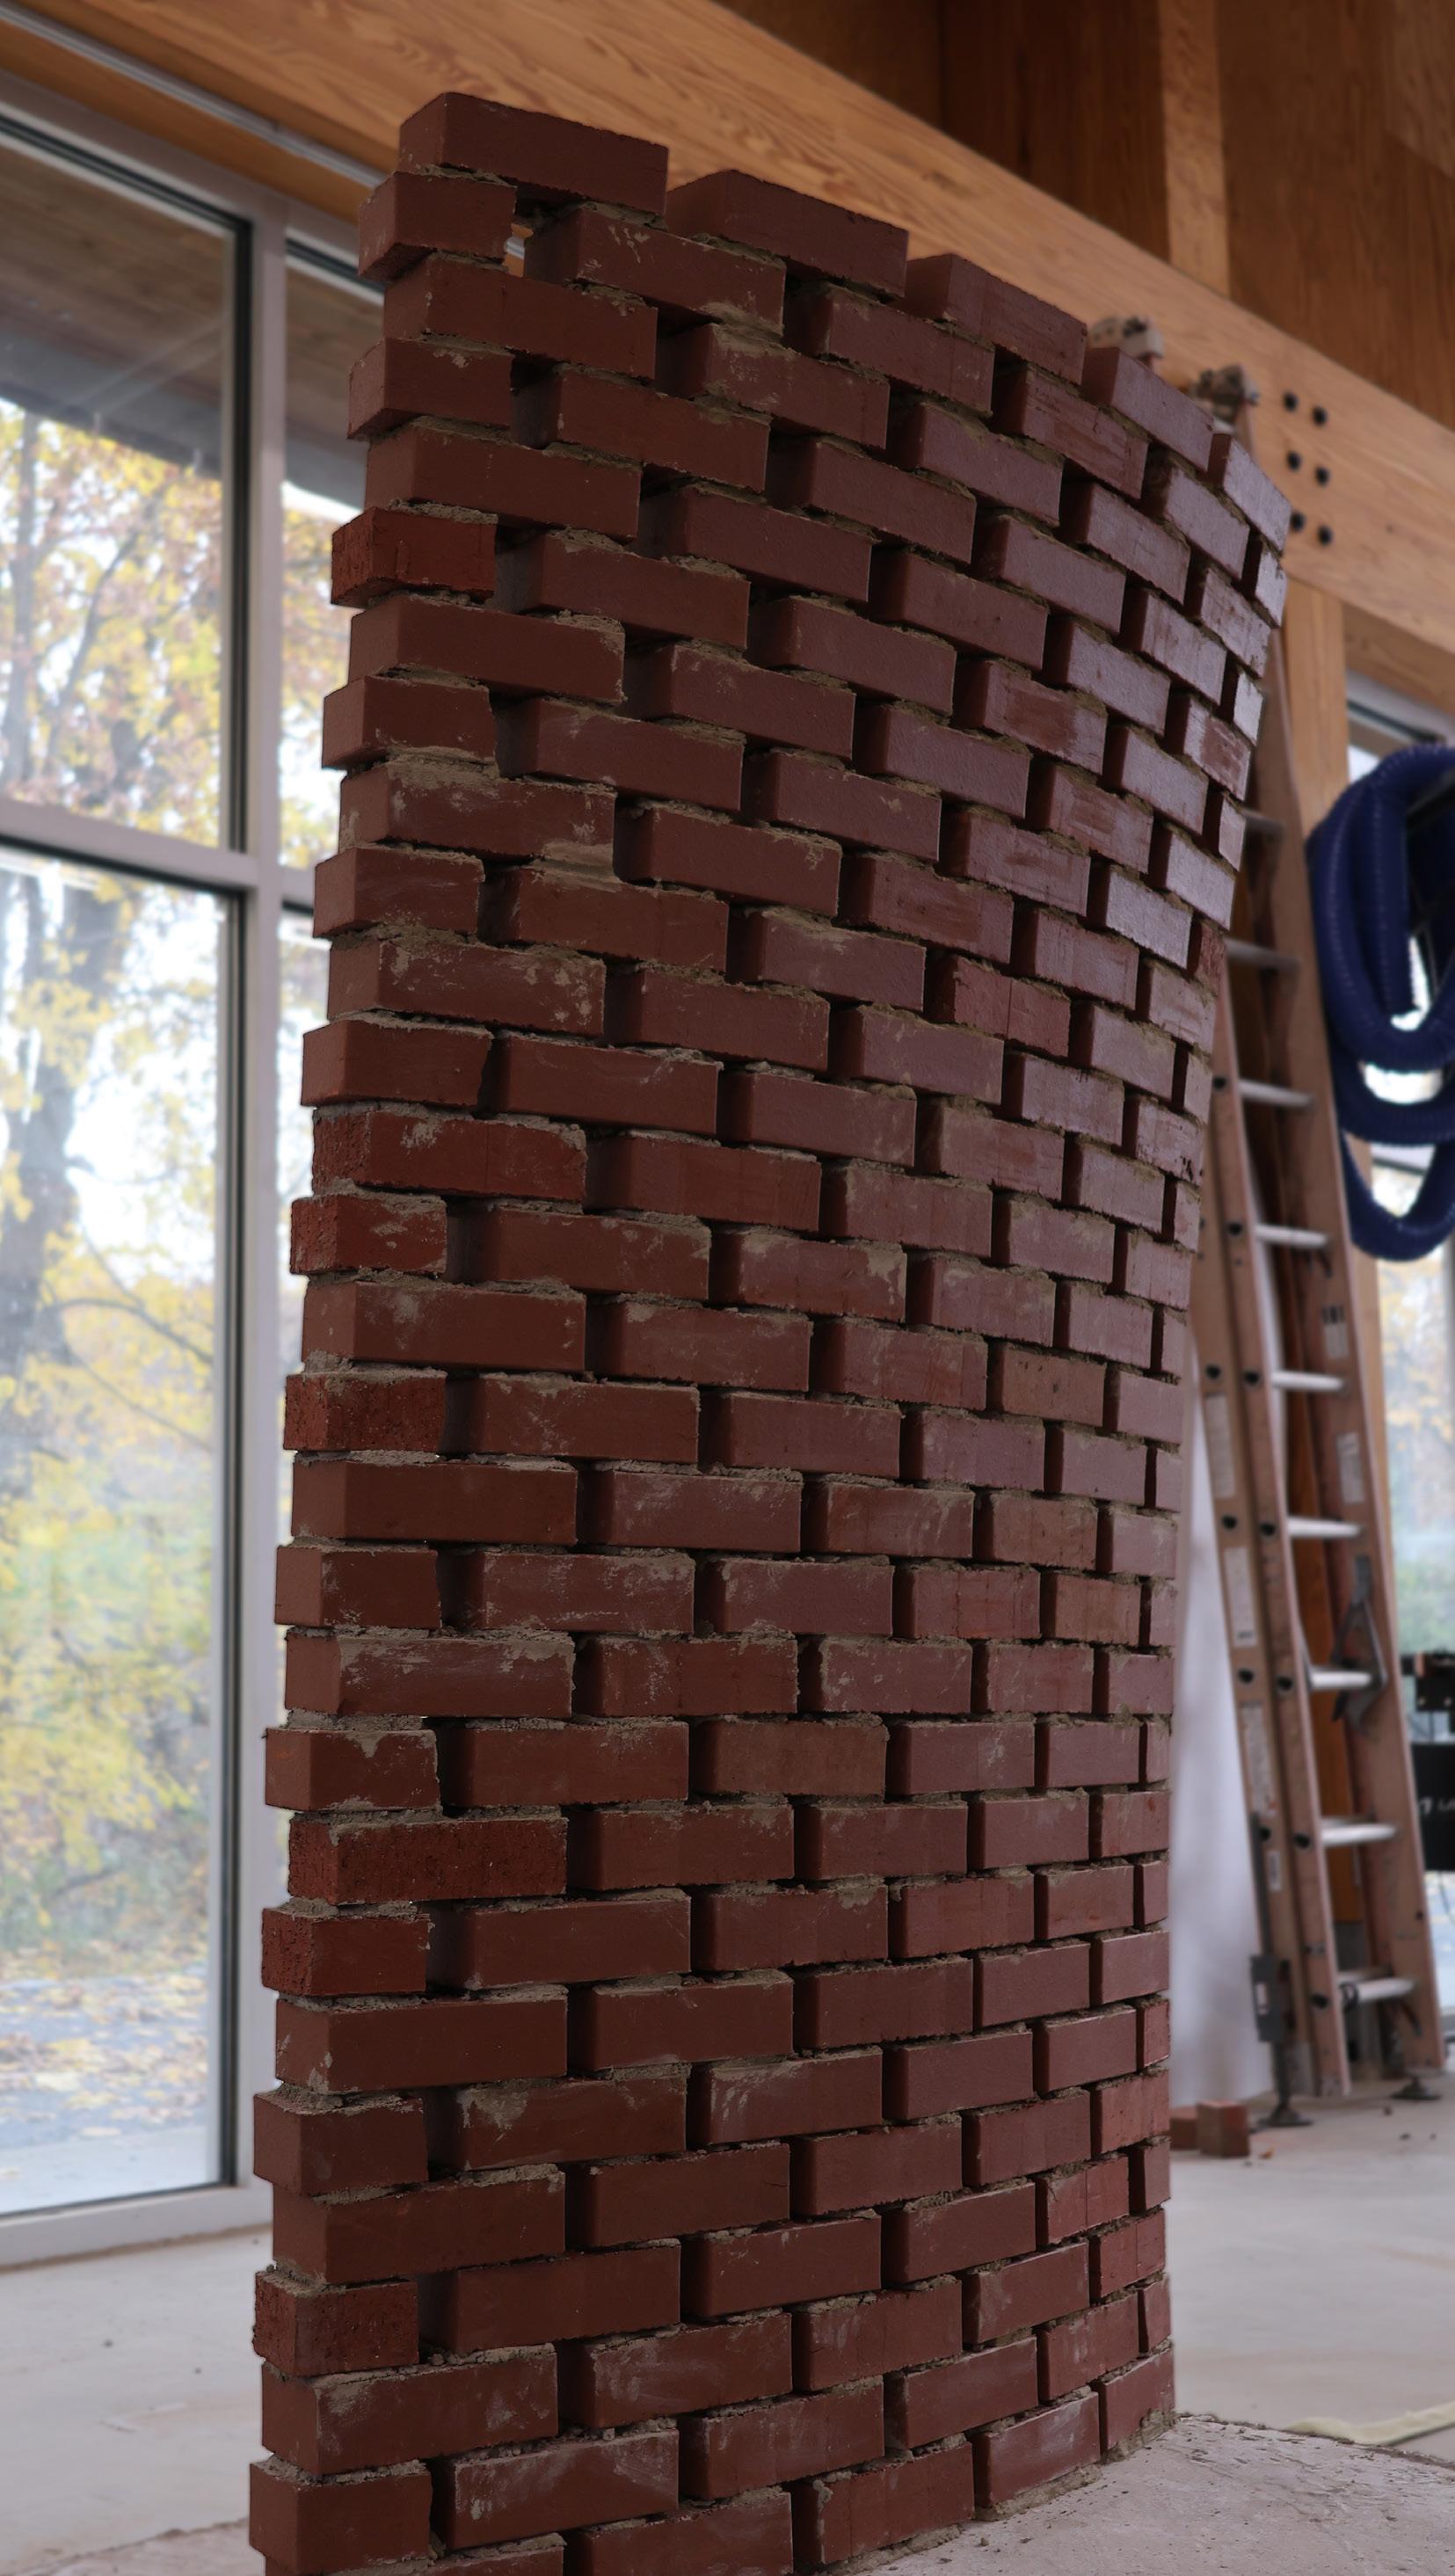 Detailing of the Brick Double-Curved Wall Openings in the Brick Double-Curved Wall
36.
Structural Stability in the Brick Double-Curved Wall
INTERNSHIP EXPERIENCES
Dallas, TX | Shanghai, China | New York City, NY
Summer 2018 - Present

Humphreys Architects & Partners
Dallas, TX // Summer 2018, Summer 2019, Summer 2021
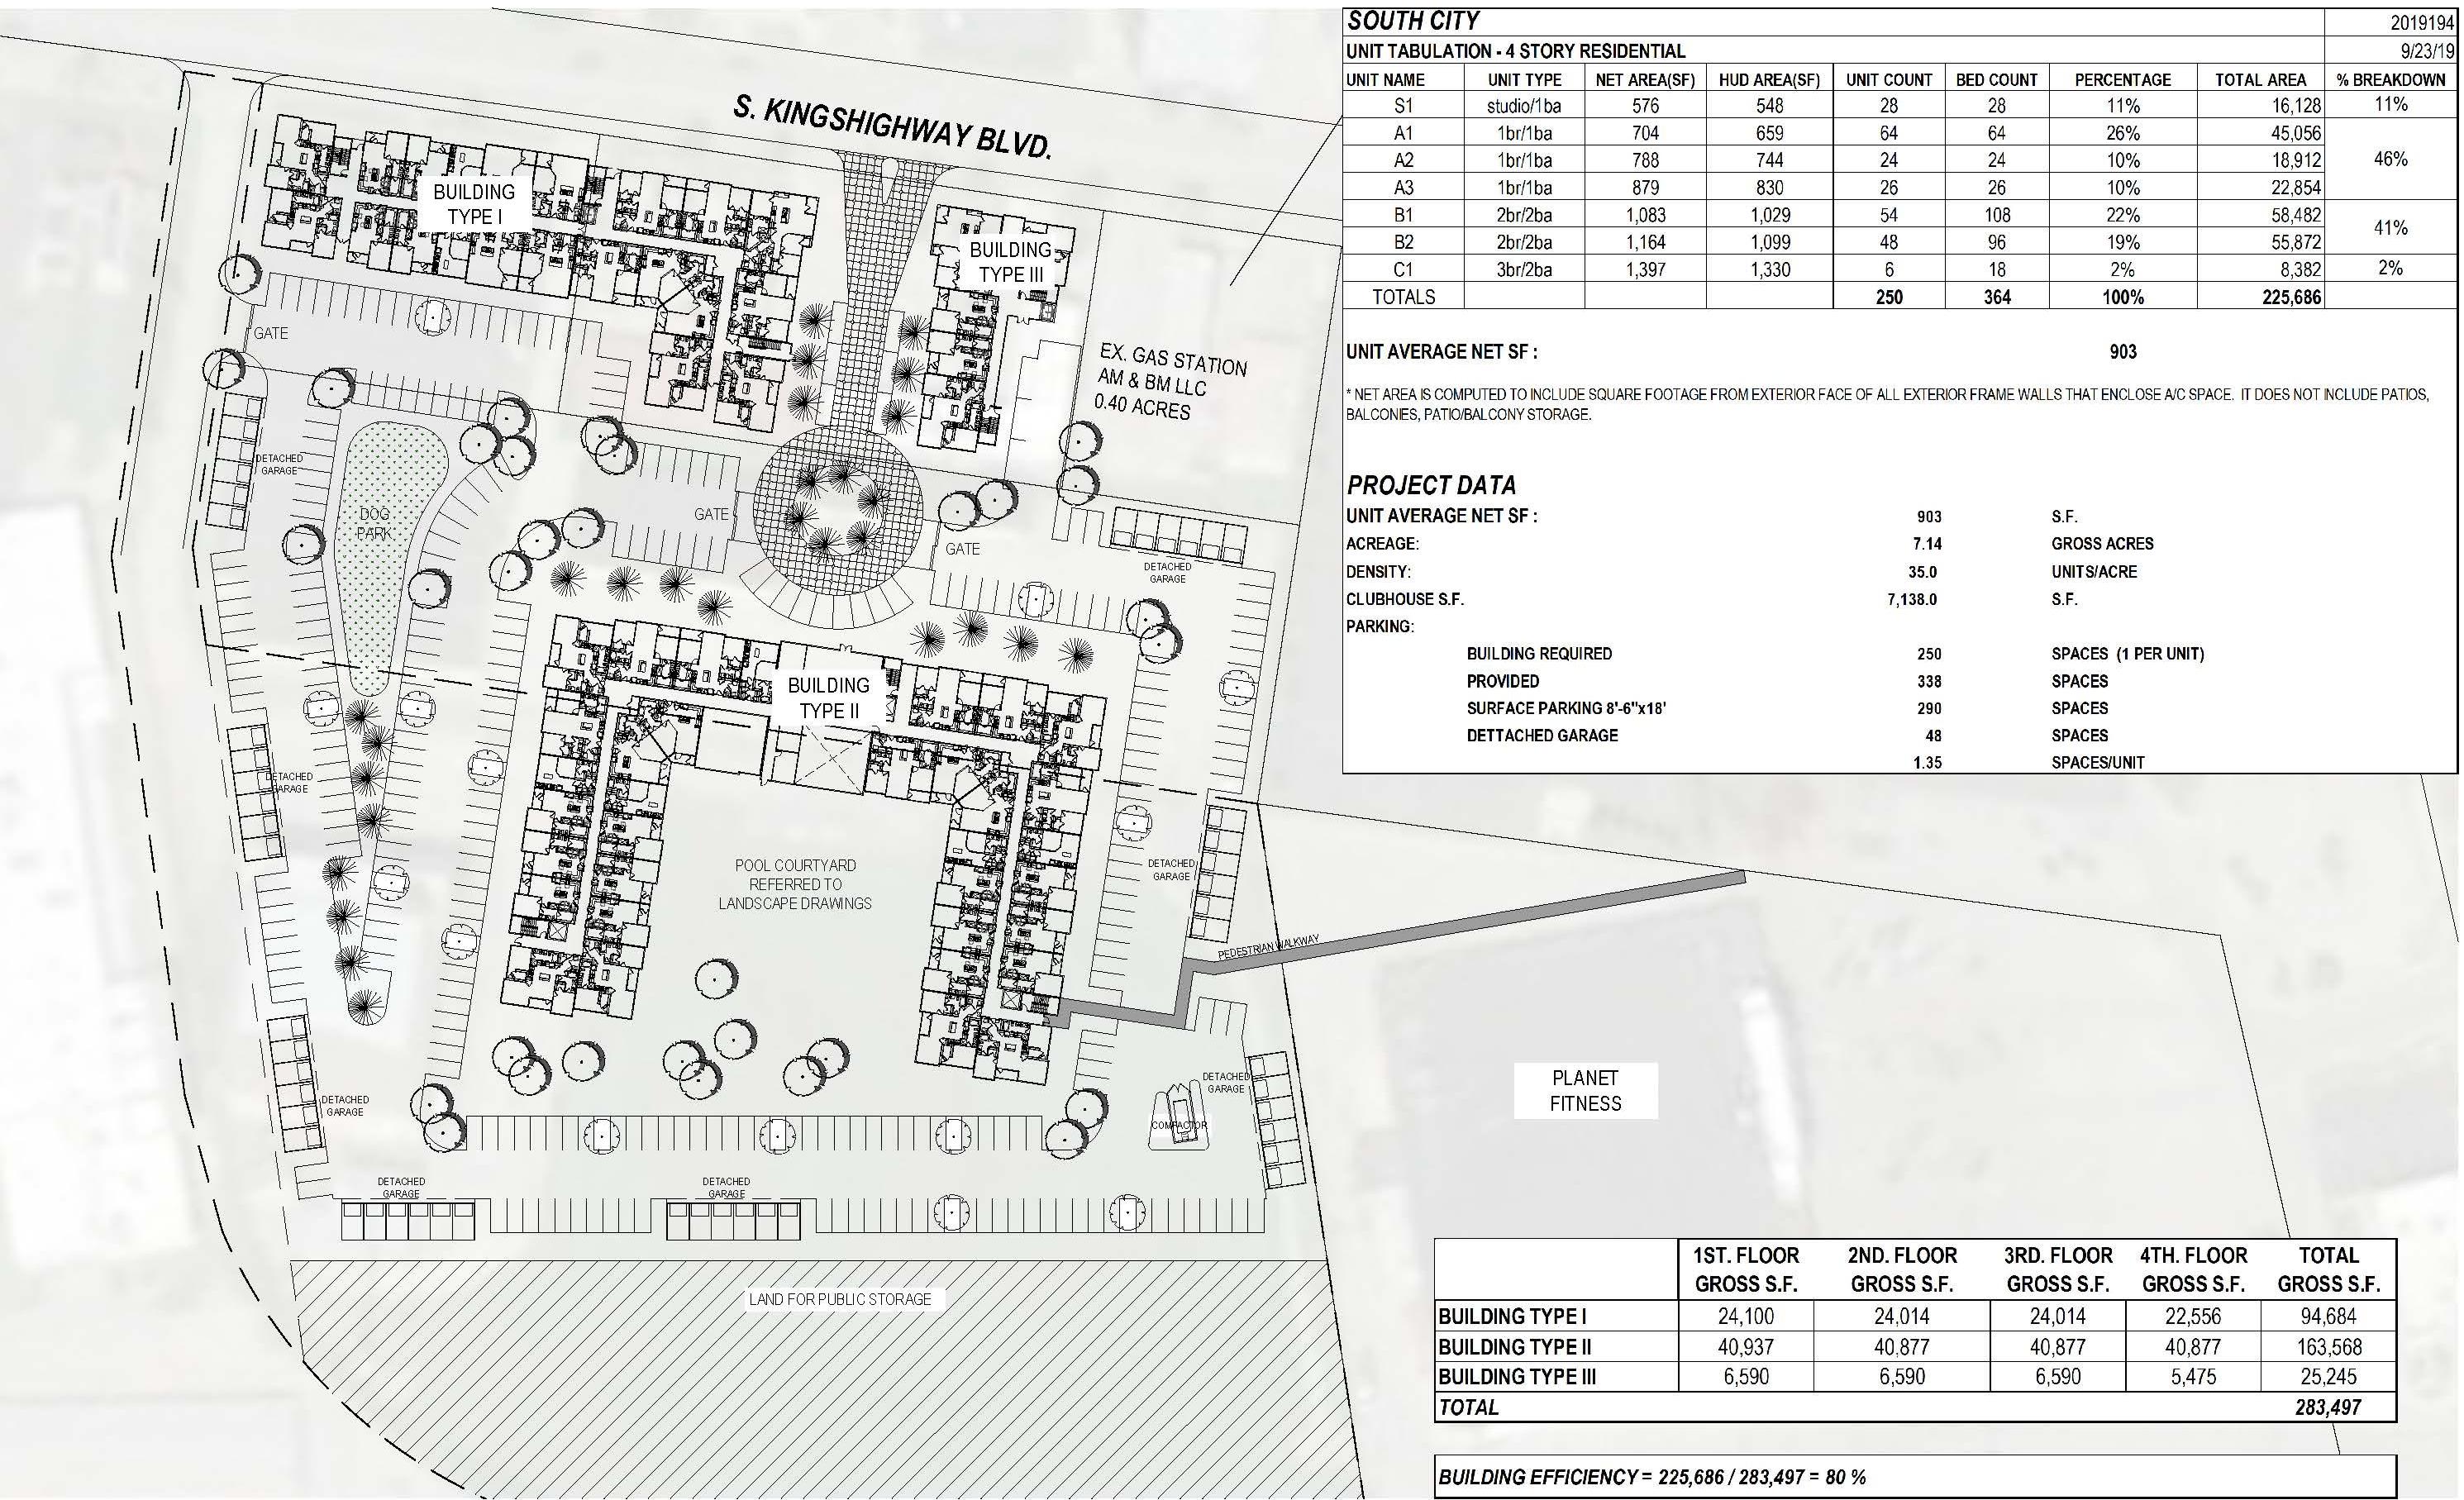
This project, called the SOGRO Apartment Complex, is located in Saint Louis, Missouri and was originally designed in the summer of 2019. As a member of the design team, I was responsible for designing the site plan, the building plans, and the elevations. I designed the project according to the required unit mix, and organized the site plan to maximize parking efficiency while including amenities such as a dog park, a roundabout, and a large courtyard.
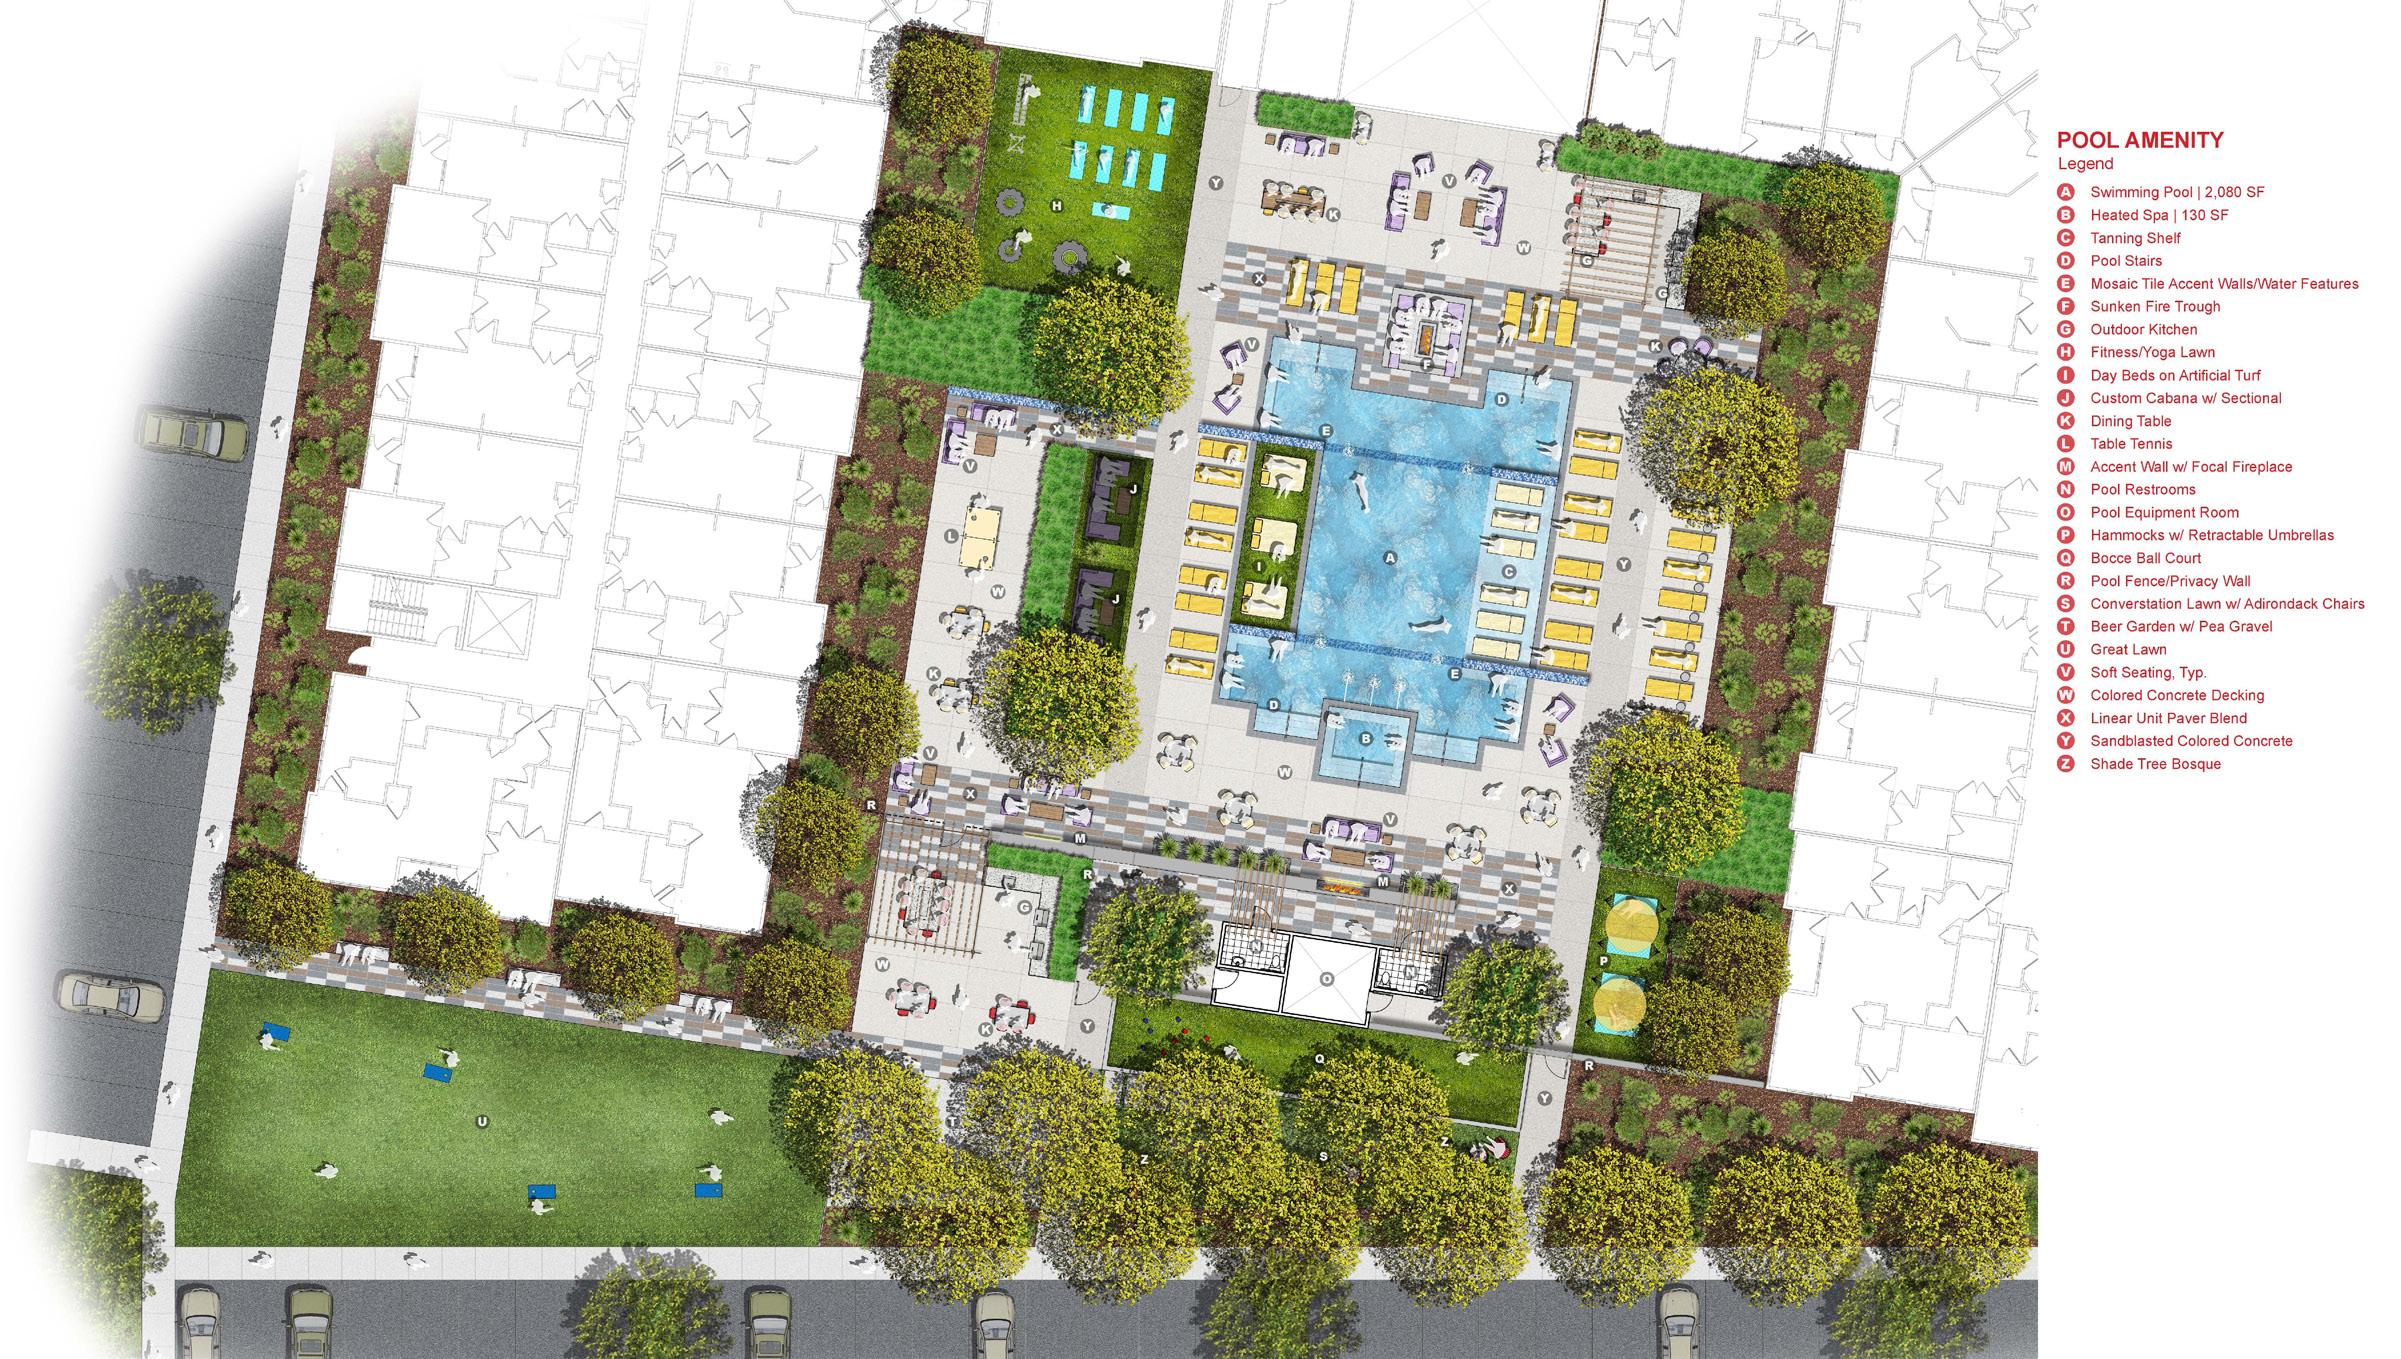

Landscape Plan Drawn by HPLA Render Done by Diamond Graphic Design Company Site Plan Drawn and Designed by Andrew Yu Elevation Drawn and Designed by Andrew Yu [9] 37.
Atelier Z+
Shanghai, China // Summer 2018, Summer 2019
In the Summer of 2018 and 2019, I worked at Atelier Z+ in Shanghai, developing diagrams, renders, 3D models, and physical models for the studio. During my first stint, I also contributed to the team that won the Sanlin Bridge Competition.
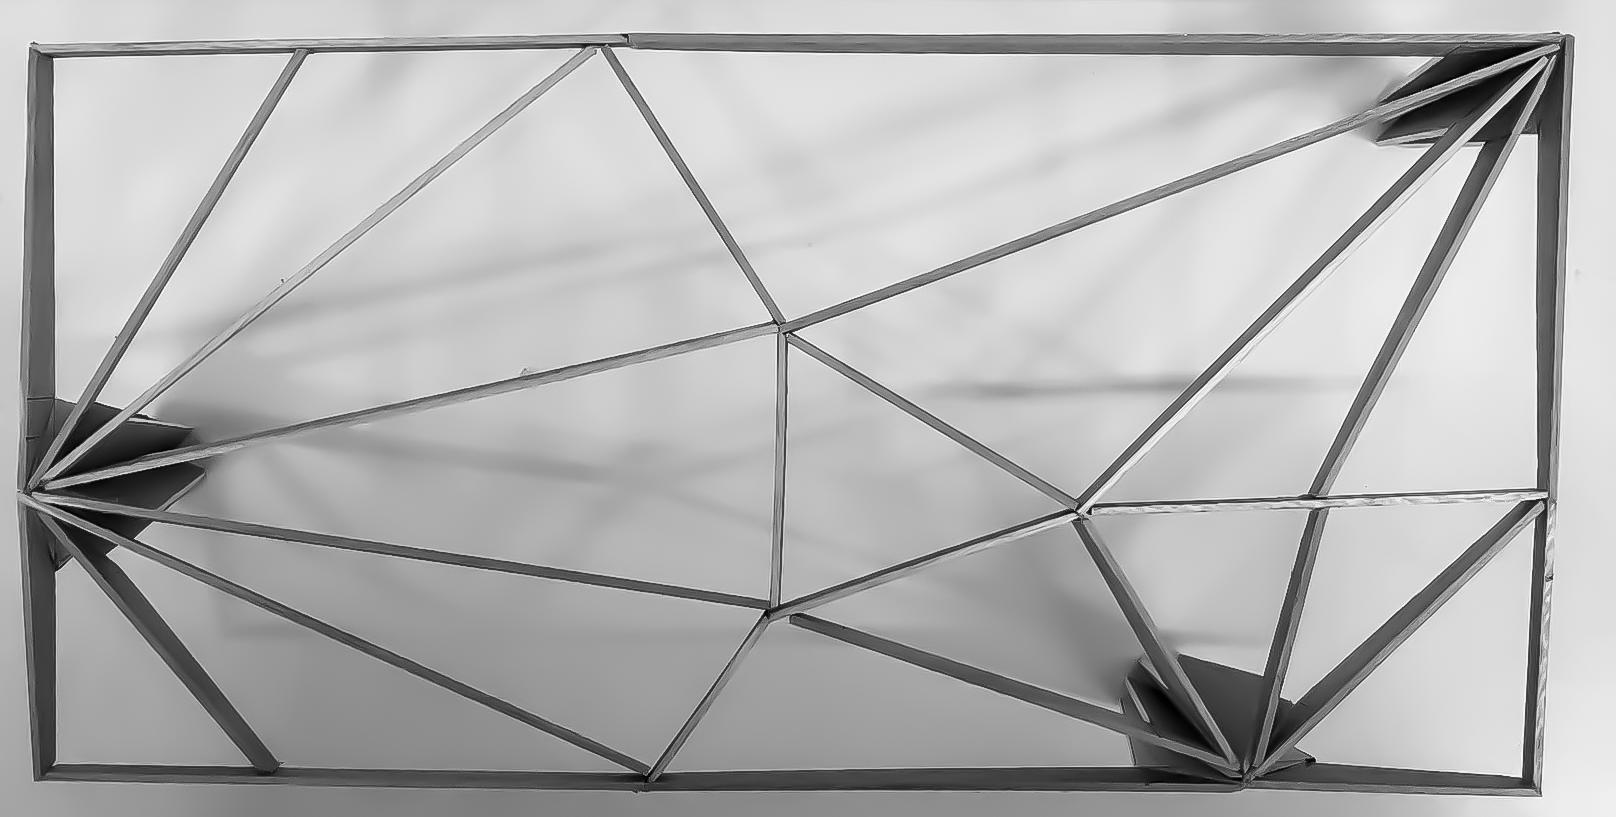
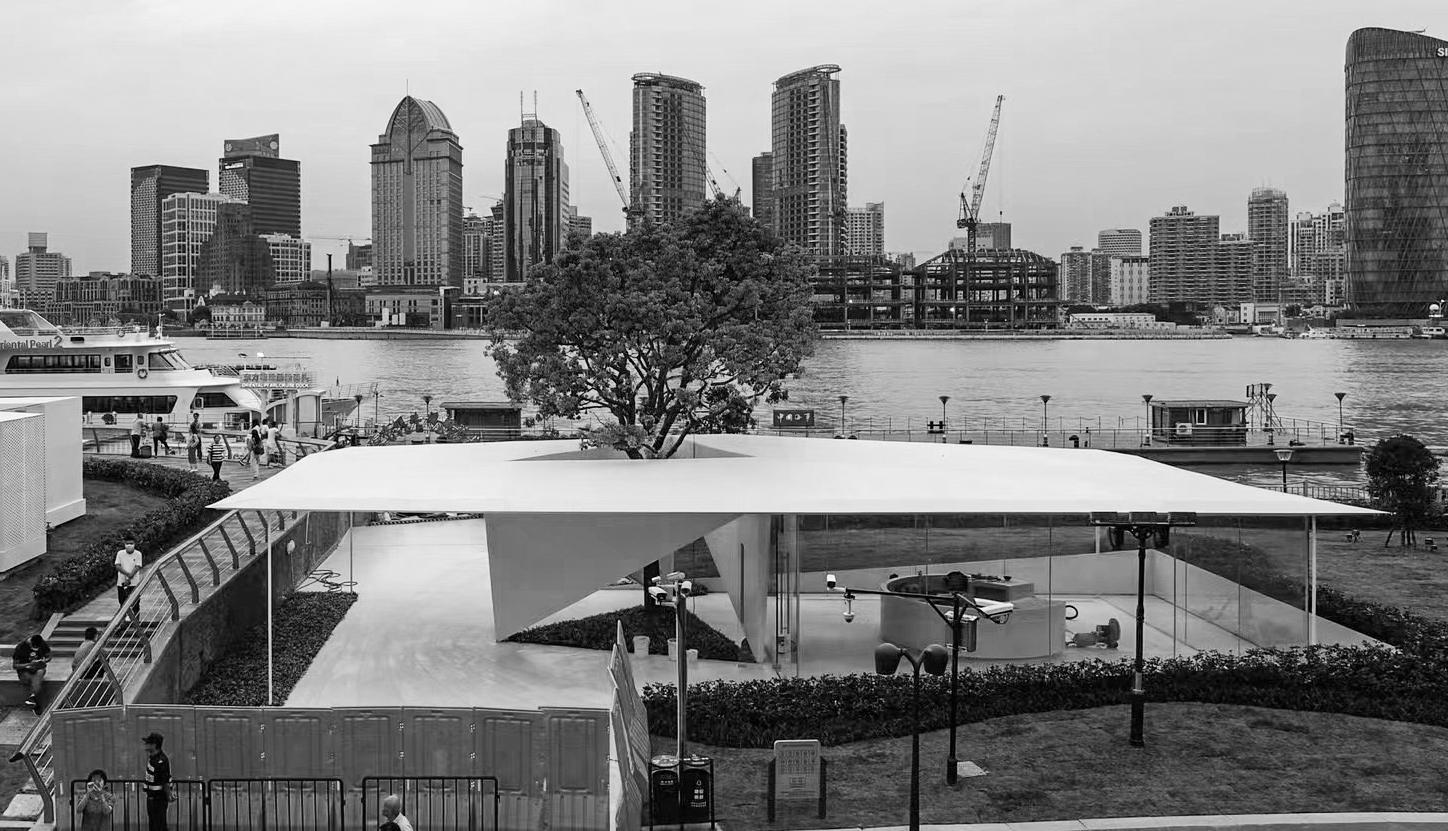
This is a pavilion that was designed in the Summer of 2019. The overall concept was to minimize the structure supporting the roof by using three columnar trunks. Additionally, we wanted a tree to interrupt the roof through the triangular aperture. I was in charge of producing the physical models. After extensive modeling, the structural system was switched to a grid of thin, steel columns so that the roof appears to float.
The pavilion finished construction in 2021.


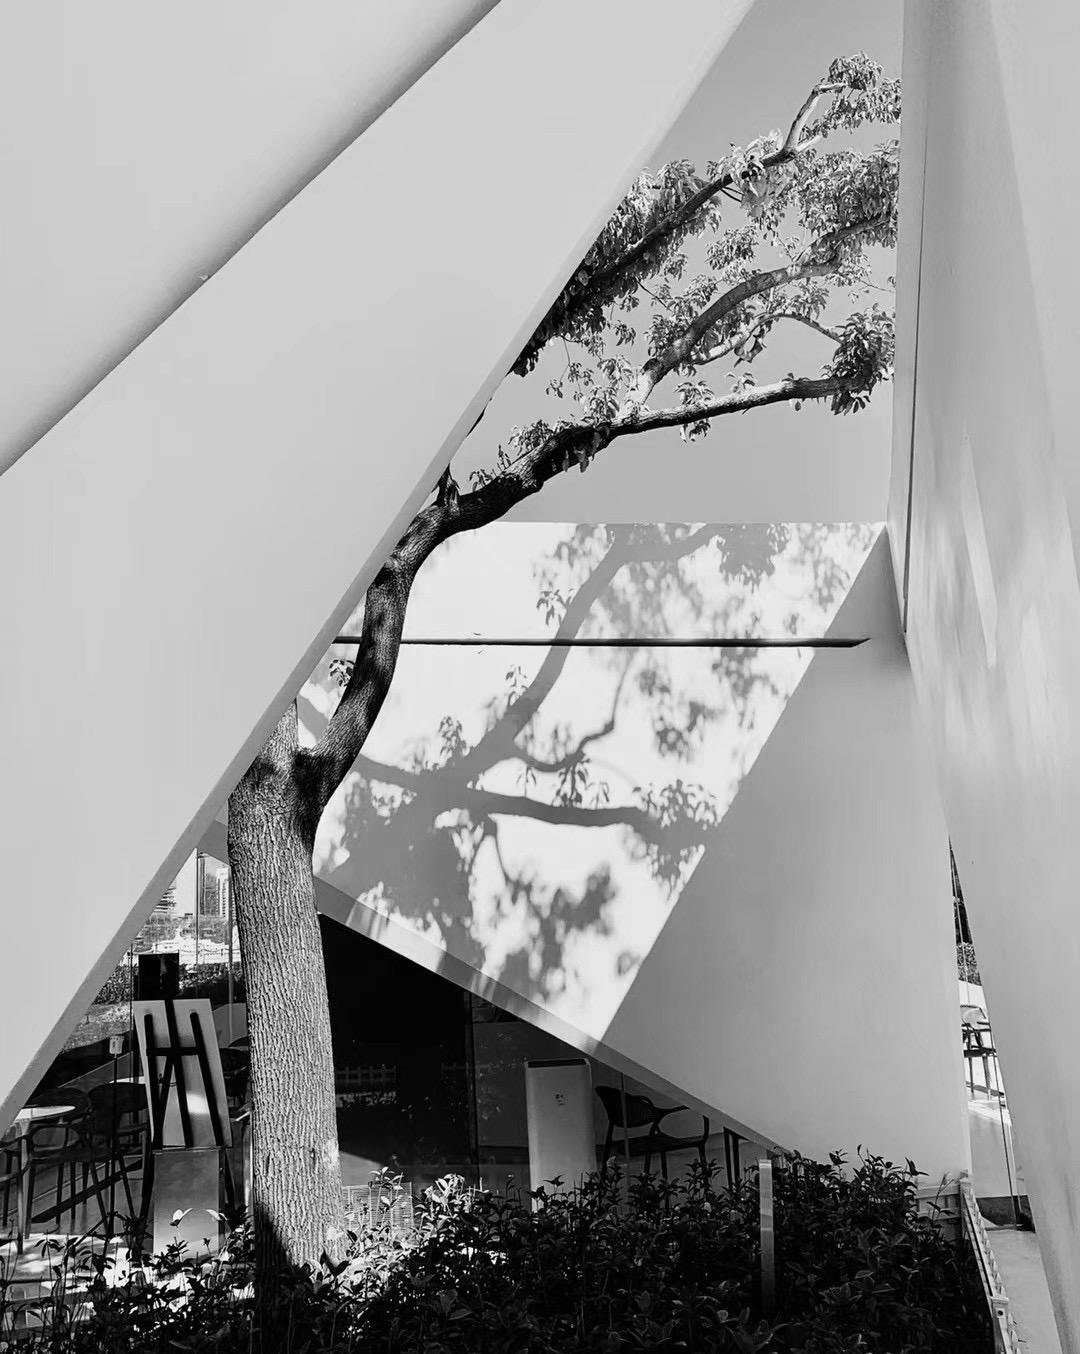


 A Closeup View of the Pavilion, Built 2021
The Tree at the Center of the Pavilion
The Pavilion During the Final Construction Phase, Built 2021
An Aerial View of the Pavilion, Built 2021
38.
Preliminary Models Created by Andrew Yu


 The Inefficient Machine from Beyond the Salton Sea
Photographs from the Salton Sea, Photographed by Andrew Yu


 The Inefficient Desalination Processing of the Salton Sea keeps the Salton Sea in Permanent Stasis
Oasis from Beyond the Salton Sea


 Site model Milled into Walnut
The Space for Sun Drying FIsh
The Flocculation Machine
The Coagulation Machine


 RE:Haven Balcony Rendered by Andrew Yu
RE:Haven Exterior Rendered by Andrew Yu
RE:Haven Exterior Rendered by Andrew Yu














 Diagrams Modeled and Drawn by Andrew Yu; Lineweights Done by Alexander Michel
Preliminary Sketches Drawn by Andrew Yu Below Ground Plan by Andrew Yu
Floor Plan Drawn by Andrew Yu
Plan Drawn by Andrew Yu


 Outdoor Amphitheathre Rendered by Andrew Yu
Nighttime Axonmetric Rendered by Andrew Yu
Daytime Axonmetric Rendered by Andrew Yu
Detailing Drawn by Andrew Yu East-West Section Drawn by Andrew Yu


 Machine Assembled Prototype for the Double-Curved Wall
Hand Assembled Prototype for the Double-Curved Wall Jig Developed After Learning from the Machine


 Detailing of the Brick Double-Curved Wall Openings in the Brick Double-Curved Wall


 A Closeup View of the Pavilion, Built 2021
The Tree at the Center of the Pavilion
The Pavilion During the Final Construction Phase, Built 2021
An Aerial View of the Pavilion, Built 2021