A Guide to Angus Selection Indexes
Ten selection indexes are published for animals within the TransTasman Angus Cattle Evaluation (TACE).
The selection indexes cater for a range of different breeding systems, target markets and production systems, and include:
each animal to identify animals with genetics that are most aligned with the breeding objective for the given selection scenario.
Example Selection Index Calculation
Selection Index = b1T1 + b2T2 + b3T3 + …….. + bⁿTⁿ
Where b = weighting placed on the trait
T = trait
How are selection indexes calculated?
The selection indexes published within the TransTasman Angus Cattle Evaluation are economic selection indexes and are derived using BreedObject software, as developed by the Animal Genetics & Breeding Unit (AGBU) in Armidale, NSW.
What is a selection index?
Selection indexes are utilised by livestock breeders of many species around the world and are considered an essential part of any modern livestock breeding program. Selection indexes aid in the selection of animals for use within a breeding program where there are several traits of economic or functional importance by providing an overall “score” of an animal’s genetic value.
Selection indexes are derived for a specific breeding purpose and are calculated based on weightings placed on individual traits that are deemed to be important for that purpose.
The selection indexes assist in making “balanced” selection decisions, taking into account the relevant attributes of
A range of different selection indexes are published, with each individual selection index reflecting differences in net profitability, being income minus expenses, in a defined breeding system, target market and production system. For the breeding system, target market and production system relevant to each respective selection index, the BreedObject software firstly calculates the net economic value of changing each trait in the breeding objective by one unit, independent of any change in other traits. The BreedObject software then links the economic value of the traits in the breeding objective with the Estimated Breeding Value (EBV) traits published in the TransTasman Angus Cattle Evaluation, and places appropriate emphasis on each EBV based on its relative economic importance in the defined breeding system, target market and production system.

www.angusaustralia.com.au
Index Name Abbreviation Angus Breeding Index $A Domestic Index $D Heavy Grain Index $GN Heavy Grass Index $GS Angus Breeding Low Feed Cost Index $A-L Domestic Low Feed Cost Index $D-L Heavy Grain Low Feed Cost Index $GN-L Heavy Grass Low Feed Cost Index $GS-L AngusPRO Index $PRO Angus Terminal Sire Index $T
Australia
BreedObject
Why use an economic selection index?
Economic selection indexes assist in making balanced selection decisions across the suite of traits that influence net profitability in a commercial beef enterprise.
Importantly, the trait emphasis that is placed on each EBV is determined by science, not the breeding preferences of either individual breeders, researchers, or staff at Angus Australia.
Understanding economic selection indexes
The economic selection indexes published in the TransTasman Angus Cattle Evaluation are reported as genetic differences in units of net profit per cow joined ($) for the given selection scenario.
The selection indexes are developed to reflect the economics in commercial beef production systems, rather than in seedstock breeding enterprises, and consider both income and expenses.
The selection indexes reflect the short term profit generated by the animal, and where applicable, the longer term profit generated through the retention of their progeny in the breeding herd.
The selection indexes are “whole-chain” selection indexes, and consider traits influencing net profitability across the entire commercial supply chain from conception to slaughter.
Economic selection indexes not only consider the influence of each individual trait on net profitability in the scenario defined by the index, but also balance the genetic relationships that exist between traits, both antagonistic and favourable, to place the appropriate emphasis on each EBV.
By comparison to selection based on consideration of individual EBVs alone where each trait is considered sequentially, economic selection indexes consider all traits simultaneously, resulting in a balanced selection outcome across all the available EBVs.
Economic selection indexes form an important decision support tool to assist breeders in the selection of breeding animals.
Selection indexes do not take the selection decision out of the hands of the breeder, but rather should be used in association with consideration of individual EBVs and any other available information to identify animals that possess genetics that are most aligned with the breeding objective of the individual breeding program for which they are being selected.
Angus
Step 1 Define production system and market endpoint Step 2 Calculation of Economic Value Step 3 Allocation of EBV Weighting Step 4 Calculation of Selection Index Values
Angus Selection Indexes
Ten selection indexes are published for animals within the TransTasman Angus Cattle Evaluation. Each selection index caters for a defined breeding system, target market and production system.
Breeding Systems
The majority of selection indexes are maternal selection indexes and are designed for use in a self replacing breeding program where a portion of female progeny are retained as replacements. The exception is the Angus Terminal Sire Index which is designed for use in situations where Angus bulls are being used as a terminal sire over mature breeding females and all progeny, both male and female, are slaughtered.
Target Markets
The Angus Breeding and Angus Breeding Low Feed Cost selection indexes are general purpose selection indexes that are suitable for use in the majority of commercial beef operations.
The Domestic, Domestic Low Feed Cost, Heavy Grain, Heavy Grain Low Feed Cost, Heavy Grass, Heavy Grass Low Feed Cost and AngusPRO selection indexes are specific to beef operations targeting a defined market endpoint with their steer progeny.
Production Systems
The Angus Breeding, Domestic, Heavy Grain, Heavy Grass, AngusPRO and Angus Terminal selection indexes are designed for use in a production system where pasture is fully utilised for the majority of the year.
Table 1 - Angus Selection Indexes
Breeding System
Production system
Pasture is fully utilised for the majority of the year.
An increase in the maintenance requirements of the mature female breeding herd results in additional costs being incurred.
Mature Weight Objective
Angus Breeding Index ($A)
Domestic Index ($D)
Heavy Grain Index ($GN)
Heavy Grass Index ($GS)
AngusPRO ($PRO)
The Angus Breeding Low Feed Cost, Domestic Low Feed Cost, Heavy Grain Low Feed Cost and Heavy Grass Low Feed Cost selection indexes are suitable for use in production systems where pasture is not fully utilised for the majority of the year, or the cost of supplying additional feed is low, and hence, where an increase in the maintenance requirements of the mature female breeding herd results in minimal additional costs being incurred.
The low feed cost versions of the selection indexes do not aim to limit any increase in mature cow weight, which is an objective in the other versions of these selection indexes. The breeding system, target market and production system catered for by each individual selection index is summarised in the table below.
Pasture is not fully utilised for the majority of the year, or the cost of supplying additional feed is low.
Not applicable
Angus Breeding Low Feed Cost Index ($A-L)
Domestic Low Feed Cost Index ($D-L)
Heavy Grain Low Feed Cost Index ($GN-L)
Heavy Grass Low Feed Cost Index ($GS-L)
Angus Terminal Sire Index ($T)
Self-replacing Self-replacing Terminal
Maintain mature weight Do not maintain mature weight
An increase in the maintenance requirements of the mature female breeding herd results in minimal additional costs being incurred. applicable
Not
Index
Names & Abbreviations
Important things to consider when reviewing selection index values
When reviewing the selection indexes for an animal, there are a number of important considerations to make.
1. Animals with extremely favourable EBVs for traits of high economic importance will still rank highly, irrespective of their EBVs for other traits
The nature of an economic selection index means that animals with extremely favourable EBVs for traits of high economic importance will still rank highly on the index, even if they have EBVs for several other traits that many breeders would consider unfavourable. For example, an animal with an extremely high 400 or 600 Day Weight EBV may still rank highly even if its Calving Ease EBV is below average.
This scenario does not reduce the value of the index as a selection tool, but highlights the importance of considering the index value in association with the individual EBVs when making selection decisions.
2. Trait contributions do not indicate the response to selection that will occur.
A common misconception is that the relative emphasis given to each trait in the calculation of the selection index equates to the relative change that will occur in that trait if selection decisions are based on the selection index.
In practice, the relative change that will occur in traits is influenced by not only the trait contribution, but also factors such as the animals that are available for selection and the genetic correlation that exists between traits.
A better representation of the response to selection is the selection advantage. The selection advantage is indicative of the long term direction and relativity of response that will occur in individual traits if selection is based on the selection index.
Angus Terminal Sire Index ($T)
Choosing the selection index of relevance to your breeding program
Are you selecting sires for use in a self-replacing (i.e. heifers are retained for breeding) or terminal breeding program (i.e. all heifers and steers are slaughtered)?
In your production system, is pasture fully utilised for the majority of the year?
In your production system, do you consider the cost associated with supplying additional feed as animal feed requirements increase, via additional pasture production and/or supplementary feeding, is low?
Are you comfortable if the weight of your mature breeding herd increases as a result of your selection decisions?
YES. I AM COMFORTABLE IF THE WEIGHT OF MY MATURE COWS INCREASES
Are you targeting a single market with you steer progeny?
Which market?
GRASS FINISHED HEAVY STEER
Heavy Grass Low Feed Cost Index ($GS-L)
Heavy Grain Low Feed Cost Index ($GN-L)
Angus Breeding Low Feed Cost Index ($A-L)
Are you targeting a single market with you steer progeny? Angus Breeding Index ($A)
DOMESTIC LONG FED GRAIN STEER
Domestic Low Feed Cost Index ($D-L)
GRASS FINISHED HEAVY STEER
Heavy Grass Index ($GS)
TERMINAL LONG FED GRAIN STEER YES NO. I DO NOT WANT THE WEIGHT OF MY MATURE COWS TO INCREASE
Which market? NZ ANGUSPURE
Heavy Grain Index ($GN)
DOMESTIC
Domestic Index ($D)
AngusPRO Index ($PRO)
NO YES NO
YES YES NO NO
SELF REPLACING
Angus Breeding Indexes ($A, $A-L)
The Angus Breeding Index ($A) and Angus Breeding Low Feed Cost Index ($A-L) indexes estimate the genetic differences between animals in net profitability per cow joined in a typical commercial self replacing herd using Angus bulls.
These selection indexes are not specific to a particular market end-point, but identify animals that will improve overall net profitability in the majority of commercial, self replacing, grass and grain finishing beef production systems.
Daughters are retained for breeding and therefore female traits are of importance.
The $A & $A-L indexes are similar, with the difference being the production system on which they are modelled. The $A index caters for production systems where pasture is fully utilised for the majority of the year, while the $A-L index caters for systems where feed is surplus to requirements for the majority of the year, or the cost of supplying additional feed when animal feed requirements increase, via increased pasture production and/or supplementary feeding, is low. The $A index aims to maintain mature cow weight while the $A-L Index does not aim to limit an increase in mature cow weight.
Trait Contributions
Figure 1 shows the traits that are considered in the $A & $A-L indexes, and how much they contribute to the overall balance of each selection index. The larger the segment, the greater the impact on the selection index.
In both the $A & $A-L indexes, there is a focus on improving growth, carcase, calving ease and fertility traits. The main difference is the increased emphasis on mature cow weight in the $A index, whereas this emphasis is given to calving ease and fertility in the $A-L index.
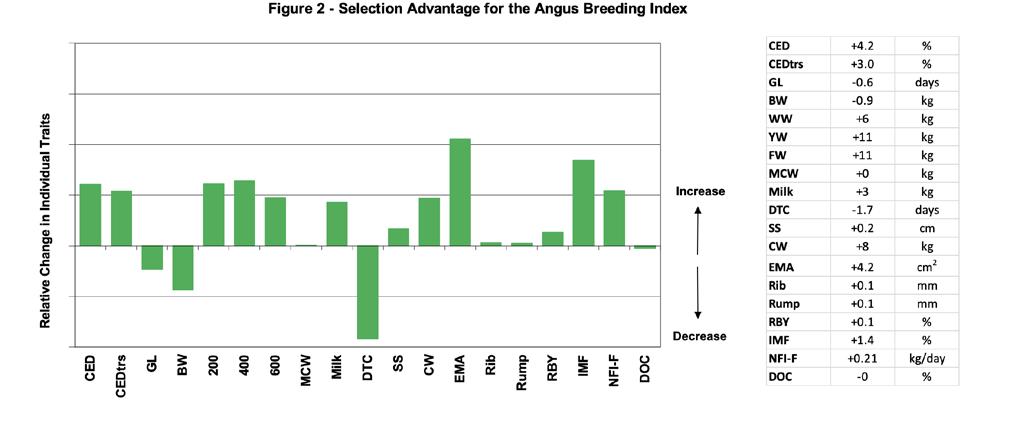
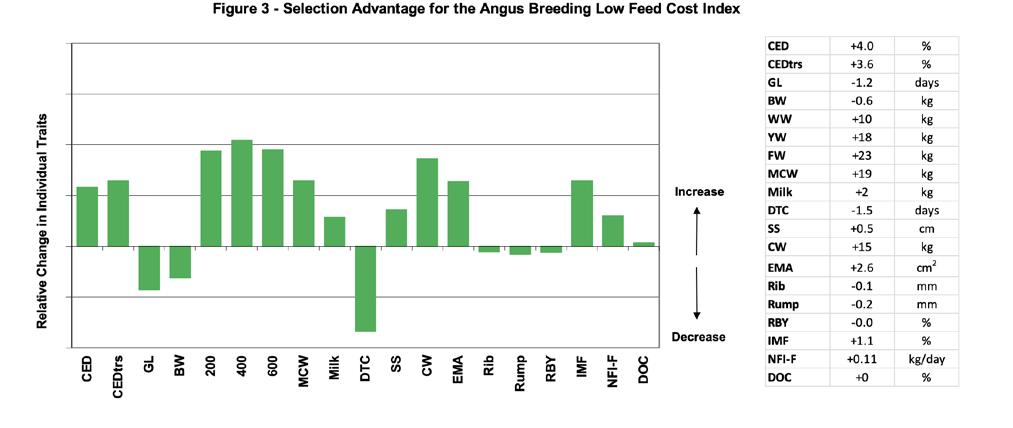
Selection Advantage
Figures 2 & 3 show the selection advantage if animals are selected using the $A & $A-L indexes.
Selection Index Summary
Self replacing herd Daughters are retained for breeding
Identifies animals that will improve overall profitability in the majority of commercial, self replacing, grass and grain finishing beef production systems
$A includes an objective of maintaining mature cow weight, whereas the $A-L does not include this objective
The selection advantage is calculated by ranking well used sires within the Angus breed on each respective selection index, and comparing the average EBVs of the sires in the highest 10% with the average EBVs of all sires from which they were selected. For example, the sires ranked in the highest 10% based on the $A index had 13 kg higher 400 Day Weight EBVs and 0.9 kg lower Birth Weight EBVs than the average EBVs of the sires from which they were selected.
The selection advantage is indicative of the long term direction and relativity of response that will occur in individual traits if selection is based on each respective selection index. The actual response that is observed will vary depending on the features of the individual breeding program.
The main difference in the selection advantage between the $A & $A-L indexes is in the growth traits and mature cow weight. Animals ranking highly on the $A-L index have higher growth EBVs relative to the $A index, meaning selection on the $A-L index will result in a higher increase in growth to 200, 400 and 600 days of age than selection on the $A index, however this is also associated with higher mature cow weight EBVs, meaning an increase in mature weight will also be observed. By comparison, the selection advantage of the $A index for mature cow weight is close to 0, meaning that selection on this index will maintain mature cow weight, while still increasing growth to 200, 400 & 600 days of age.
$A Calving Ease 13% Carcase Quality 11% Growth 25% Carcase Yield 24% Fertility 16% Mature Cow Weight 12% $A-L Calving Ease 24% Carcase Yield 22% Mature Cow Weight 1% Fertility 18% Carcase Quality 10% Growth 25%
Figure 1: Trait Contribution to the Angus Breeding and Angus Breeding Low Feed Cost Indexes
Domestic Indexes ($D, $D-L)
The Domestic Index ($D) and Domestic Low Feed Cost Index ($D-L) estimate the genetic differences between animals in net profitability per cow joined in a commercial self replacing herd targeting the domestic supermarket trade.
Daughters are retained for breeding and therefore female traits are of importance.
Steers are either finished using pasture, pasture supplemented by grain or grain (eg. 50 – 70 days) with steers assumed to be slaughtered at 510 kg live weight (280 kg carcase weight with 12 mm P8 fat depth) at 16 months of age.
Emphasis has been placed on eating quality and tenderness to favour animals that are suited to MSA requirements.
The $D & $D-L indexes are similar, with the difference being the production system on which they are modelled. The $D index caters for production systems where pasture is fully utilised for the majority of the year, while the $D-L index caters for systems where feed is surplus to requirements for the majority of the year, or the cost of supplying additional feed when animal feed requirements increase, via increased pasture production and/or supplementary feeding, is low. The $D index aims to maintain mature cow weight while the $D-L Index does not limit an increase in mature cow weight.
Trait Contributions
Figure 1 shows the traits that are considered in the $D & $D-L indexes, and how much they contribute to the overall balance of each selection index. The larger the segment, the greater the impact on the selection index.
In both the $D & $D-L indexes, there is a focus on improving growth, carcase, calving ease and fertility traits. The main difference is the increased emphasis on mature cow weight in the $D index, whereas this emphasis is given to calving ease and fertility in the $D-L index.
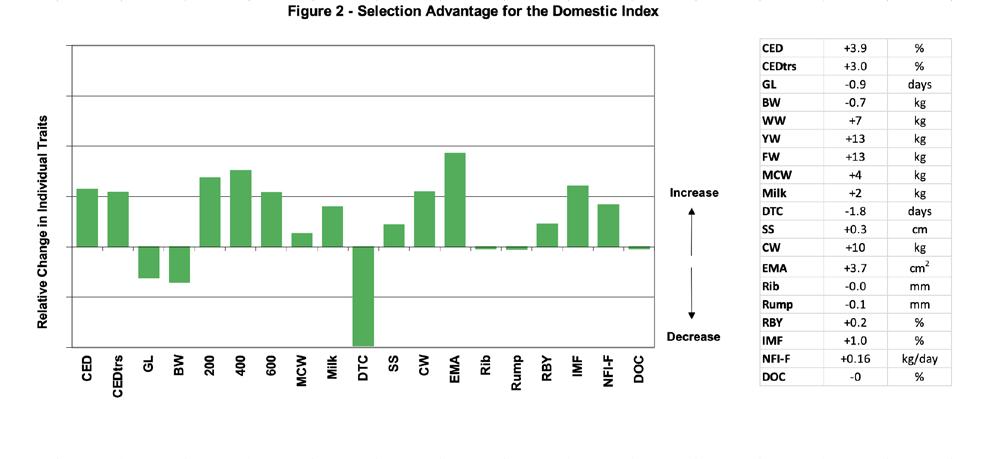
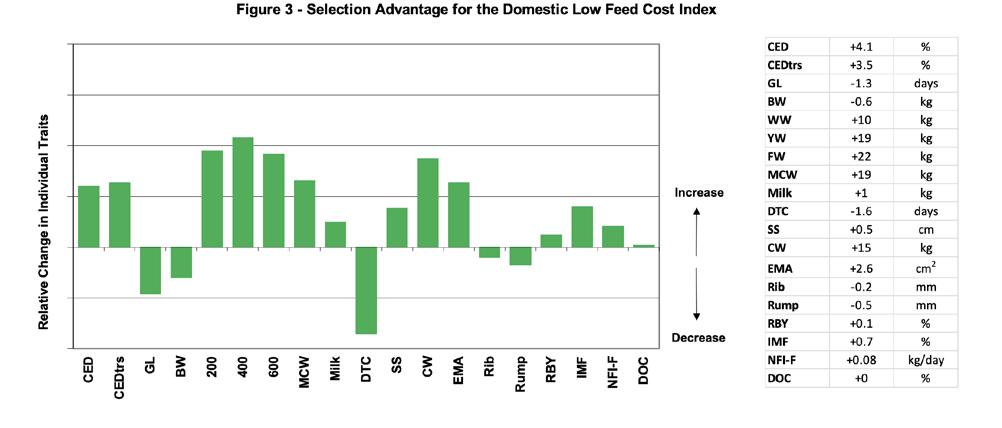
Selection Advantage
Figures 2 & 3 show the selection advantage if animals are selected using the $D & $D-L indexes.
The selection advantage is calculated by ranking well used sires within the Angus breed on the respective selection
Selection Index Summary
Self replacing herd
Daughters are retained for breeding
Steer progeny are either finished using pasture, pasture supplemented by grain or grain (eg. 5070 days)
Steer progeny slaughtered at a carcase weight of 280kg at 16 months of age
Eating quality traits important to suit MSA program
$D includes an objective of maintaining mature cow weight, whereas the $D-L does not include this objective
index, and comparing the average EBVs of the sires in the highest 10% with the average EBVs of all sires from which they were selected. For example, the sires ranked in the highest 10% based on the $D index had 14 kg higher 400 Day Weight EBVs and 1.0 kg lower Birth Weight EBVs than the average EBVs of the sires from which they were selected.
The selection advantage is indicative of the long term direction and relativity of response that will occur in individual traits if selection is based on each respective selection index. The actual response that is observed will vary depending on the features of the individual breeding program.
The main difference in the selection advantage between the $D & $D-L indexes is in the growth traits and mature cow weight. Animals ranking highly on the $D-L index have higher growth EBVs relative to the $D index, meaning selection on the $D-L index will result in a higher increase in growth to 200, 400 and 600 days of age than selection on the $D index, however this is also associated with higher mature cow weight EBVs, meaning an increase in mature weight will also be observed. By comparison, the selection advantage of the $D index for mature cow weight is close to 0, meaning that selection on this index will maintain mature cow weight, while still increasing growth to 200, 400 & 600 days of age.
Calving Ease 23% Fertility 18% Carcase Quality 6% Carcase Yield 20% Growth 32% $D-L $D Growth 32% Carcase Yield 20% Carcase Quality 6% Fertility 17% Mature Cow Weight 10% Calving Ease 12%
Figure 1: Trait Contribution to the Domestic and Domestic Low Feed Cost Indexes
Heavy Grain Indexes ($GN, $GN-L)
The Heavy Grain Index ($GN) and Heavy Grain Low Feed Cost Index ($GN-L) estimate the genetic differences between animals in net profitability per cow joined in a commercial self replacing herd targeting pasture grown steers with a 250 day feedlot finishing period for the grain fed high quality, highly marbled markets.
Daughters are retained for breeding and therefore female traits are of importance.
Steers are assumed to be slaughtered at 800 kg live weight (455 kg carcase weight with 30 mm P8 fat depth) at 24 months of age, with a significant premium for steers that exhibit superior marbling.
The $GN & $GN-L indexes are similar, with the difference being the production system on which they are modelled. The $GN index caters for production systems where pasture is fully utilised for the majority of the year, while the $GN-L index caters for systems where feed is surplus to requirements for the majority of the year, or the cost of supplying additional feed when animal feed requirements increase, via increased pasture production and/or supplementary feeding, is low. The $GN index aims to maintain mature cow weight while the $GN-L Index does not limit an increase in mature cow weight.
Trait Contributions
Figure 1 shows the traits that are considered in the $GN & $GN-L indexes, and how much they contribute to the overall balance of each selection index. The larger the segment, the greater the impact on the selection index. In both the $GN & $GN-L indexes, there is a focus on improving growth, carcase, calving ease and fertility traits. The main difference is the increased emphasis on mature cow weight in the $GN index, whereas this emphasis is given to calving ease and fertility in the $GN-L index.
Selection Advantage
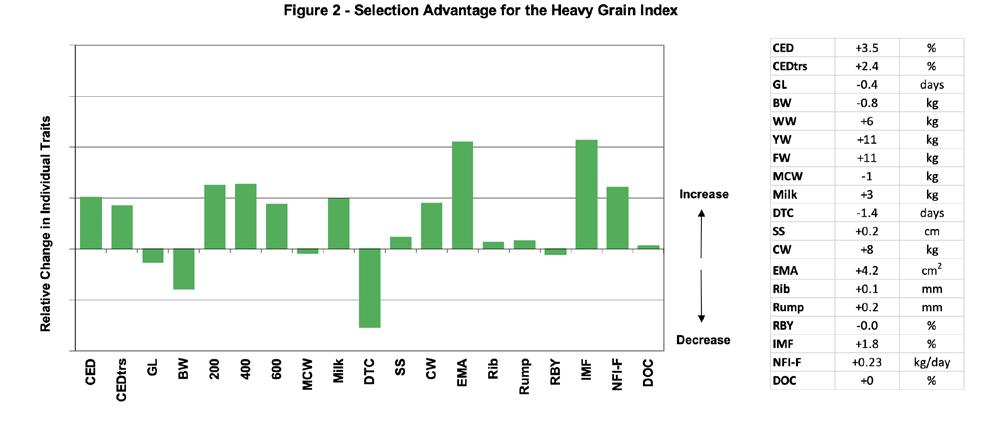
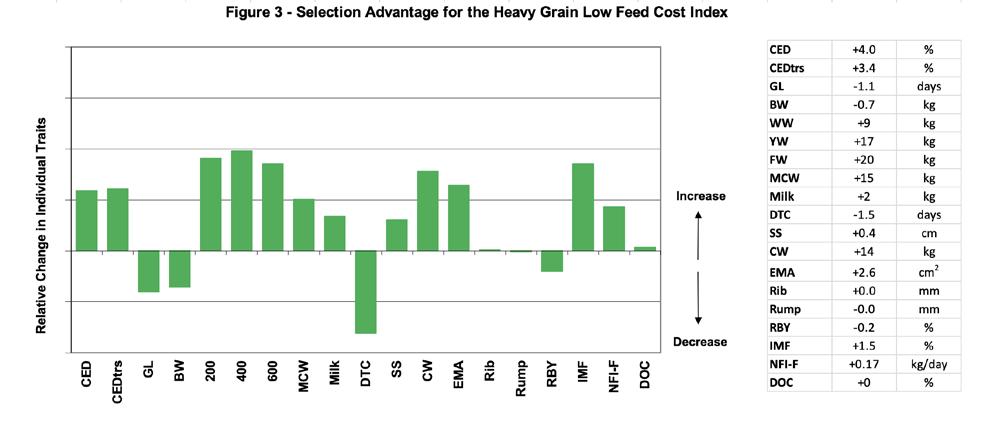
Figures 2 & 3 show the selection advantage if animals are selected using the $GN & $GN-L indexes. The selection advantage is calculated by ranking well used sires within the Angus breed on the respective selection
Selection Index Summary
Self replacing herd
Daughters are retained for breeding
Steer progeny are pasture grown with a 250 day feedlot finishing period
Steer progeny slaughtered at a carcase weight of 455kg at 24 months of age
Targeting high quality, highly marbled markets with a significant premium for superior marketing
$GN includes an objective of maintaining mature cow weight, whereas the $GN-L does not include this objective
index, and comparing the average EBVs of the sires in the highest 10% with the average EBVs of all sires from which they were selected. For example, the sires ranked in the highest 10% based on the $GN index had 13 kg higher 400 Day Weight EBVs and 0.9 kg lower Birth Weight EBVs than the average EBVs of the sires from which they were selected.
The selection advantage is indicative of the long term direction and relativity of response that will occur in individual traits if selection is based on each respective selection index. The actual response that is observed will vary depending on the features of the individual breeding program.
The main difference in the selection advantage between the $GN &$GN-L indexes is in the growth traits and mature cow weight. Animals ranking highly on the $GN index have higher growth EBVs relative to the $GN-L index, meaning selection on the $GN-L index will result in a higher increase in growth to 200, 400 and 600 days of age than selection on the $GN index, however this is also associated with higher mature cow weight EBVs, meaning an increase in mature weight will also be observed. By comparison, the selection advantage of the $GN index for mature cow weight is close to 0, meaning that selection on this index will maintain mature cow weight, while still increasing growth to 200, 400 & 600 days of age.
$GN Calving Ease 13% Mature Cow Weight 12% Fertility 12% Carcase Quality 13% Carcase Yield 25% Growth 25% $GN-L Calving Ease 23% Mature Cow Weight 2% Fertility 16% Carcase Quality 11% Carcase Yield 24% Growth 24%
Figure 1: Trait Contribution to the Heavy Grain and Heavy Grain Low Feed Cost Indexes
Heavy Grass Indexes ($GS, $GS-L)
The Heavy Grass Index ($GS) and Heavy Grass Low Feed Cost Index ($GS-L) estimate the genetic differences between animals in net profitability per cow joined in a commercial self replacing herd targeting pasture finished steers.
Daughters are retained for breeding and therefore female traits are of importance.
Steers are assumed to be slaughtered at 650 kg live weight (350 kg carcase weight with 12 mm P8 fat depth) at 22 months of age. Emphasis has been placed on eating quality and tenderness to favour animals that are suited to MSA requirements.
The $GS & $GS-L indexes are similar, with the difference being the production system on which they are modelled. The $GS index caters for production systems where pasture is fully utilised for the majority of the year, while the $GS-L index caters for systems where feed is surplus to requirements for the majority of the year, or the cost of supplying additional feed when animal feed requirements increase, via increased pasture production and/or supplementary feeding, is low. The $GS index aims to maintain mature cow weight while the $GS-L Index does not limit an increase in mature cow weight.
Trait Contributions
Figure 1 shows the traits that are considered in the $GS & $GS-L indexes, and how much they contribute to the overall balance of each selection index. The larger the segment, the greater the impact on the selection index. In both the $GS & $GS-L indexes, there is a focus on improving growth, carcase, calving ease and fertility traits. The main difference is the increased emphasis on mature cow weight in the $GS index, whereas this emphasis is given to calving ease and fertility in the $GS-L index.
Selection Advantage
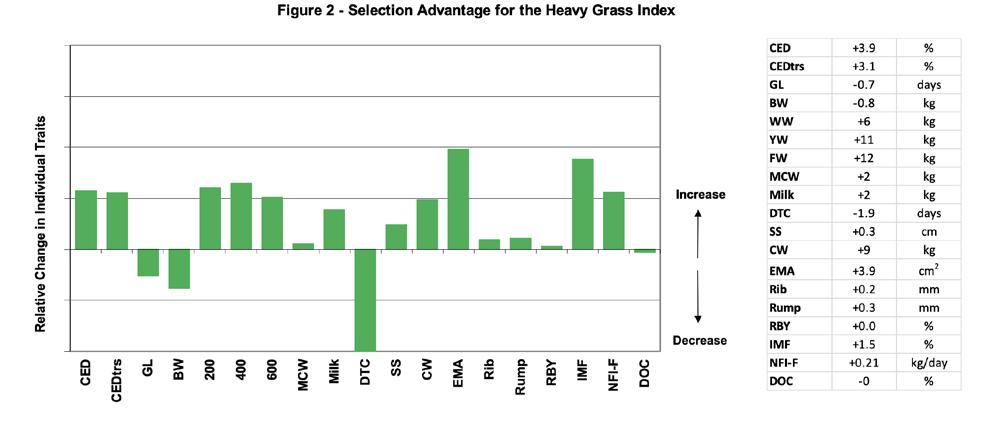
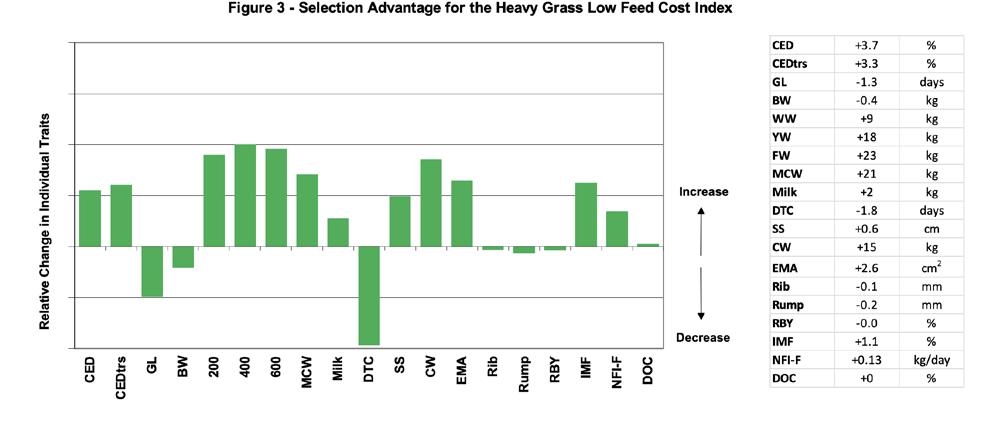
Figures 2 & 3 show the selection advantage if animals are selected using the $GS & $GS-L indexes. The selection advantage is calculated by ranking well used sires within the Angus breed on the respective selection
Selection Index Summary
Self replacing herd
Daughters are retained for breeding
Steer progeny are finished on pasture
Steer progeny slaughtered at a carcase weight of 350kg at 22 months of age
Eating quality traits important to suit MSA program
· $GS includes an objective of maintaining mature cow weight, whereas the $GS-L does not include this objective
index, and comparing the average EBVs of the sires in the highest 10% with the average EBVs of all sires from which they were selected. For example, the sires ranked in the highest 10% based on the $GS index had 12 kg higher 400 Day Weight EBVs and 0.9 kg lower Birth Weight EBVs than the average EBVs of the sires from which they were selected.
The selection advantage is indicative of the long term direction and relativity of response that will occur in individual traits if selection is based on each respective selection index. The actual response that is observed will vary depending on the features of the individual breeding program.
The main difference in the selection advantage between the $GS & $GS-L indexes is in the growth traits and mature cow weight. Animals ranking highly on the $GS-L index have higher growth EBVs relative to the $GS index, meaning selection on the $GS-L index will result in a higher increase in growth to 200, 400 and 600 days of age than selection on the $GS index, however this is also associated with higher mature cow weight EBVs, meaning an increase in mature weight will also be observed. By comparison, the selection advantage of the $GS index for mature cow weight is close to 0, meaning that selection on this index will maintain mature cow weight, while still increasing growth to 200, 400 & 600 days of age.
$GS Calving Ease 15% Mature Cow Weight 12% Fertility 17% Carcase Quality 8% Carcase Yield 24% Growth 24% $GS-L Calving Ease 23% Fertility 25% Carcase Quality 7% Carcase Yield 20% Growth 24%
Figure 1: Trait Contribution to the Heavy Grass and Heavy Grass Low Feed Cost Indexes
Angus Terminal Sire Index ($T)
The Angus Terminal Sire index ($T) is designed for situations where Angus bulls are being used as a terminal sire over mature breeding females and all progeny, both male and female, are slaughtered.
The Angus Terminal Sire Index focusses on increasing growth, carcase yield and eating quality.
Daughters are not retained for breeding and therefore no emphasis is given to female fertility or maternal traits.
Trait Contributions
Figure 1 shows the traits that are considered in the $T index, and how much they contribute to the overall balance of the selection index. The larger the segment, the greater the impact on the selection index.
Selection Advantage
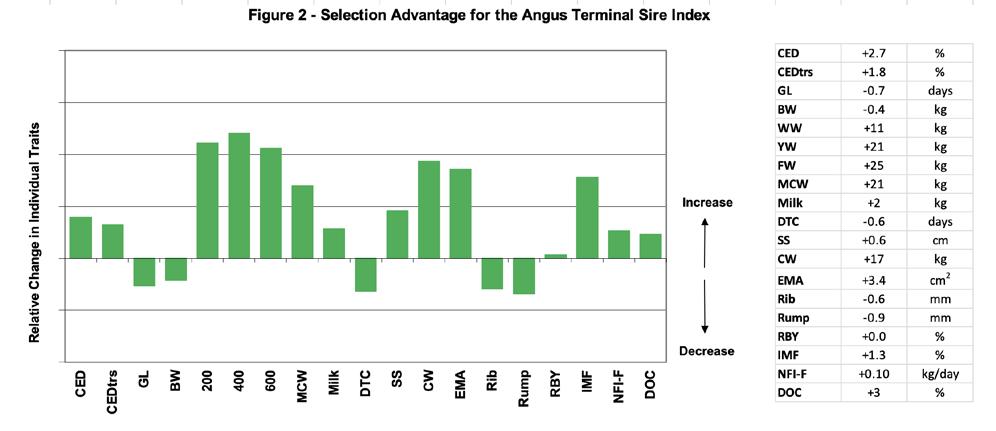
Figure 2 shows the selection advantage if animals are selected using the $T index.
The selection advantage is calculated by ranking well used sires within the Angus breed on the $T index, and comparing the average EBVs of the sires in the highest 10% with the average EBVs of all sires from which they were selected. For example, the sires ranked in the highest 10% based on the $T index had 20 kg higher 400 Day Weight EBVs and 0.4 kg lower Birth Weight EBVs than the average EBVs of the sires from which they were selected.
The selection advantage is indicative of the relativity of response that will occur in individual traits if selection is based on the $T index. The actual response that is observed will vary depending on the features of the individual breeding program.
Selection Index Summary
Terminal breeding program where Angus bulls are being used as a terminal sire over mature females
All progeny, both male and female, are slaughtered
· Focus on increasing growth, carcase yield and eating quality
No emphasis is given to female fertility or maternal traits
$T Calving Ease 16% Growth 32% Carcase Quality 20% Carcase Yield 30%
Figure 1: Trait Contribution to the Angus Terminal Sire Index
AngusPRO Index ($PRO)
The AngusPRO index ($PRO) estimates the genetic differences between animals in net profitability per cow joined in a commercial self replacing herd based in New Zealand that targets the production of grass finished steers for the AngusPure programme.
Daughters are retained for breeding and therefore female traits are of importance.
Steers are assumed marketed at approximately 530 kg live weight (290 kg carcase weight with 10 mm P8 fat depth) at 20 months of age, with a significant premium for steers that exhibit superior marbling.
Trait Contributions
Figure 1 shows the traits that are considered in the $PRO index, and how much they contribute to the overall balance of the selection index. The larger the segment, the greater the impact on the selection index.
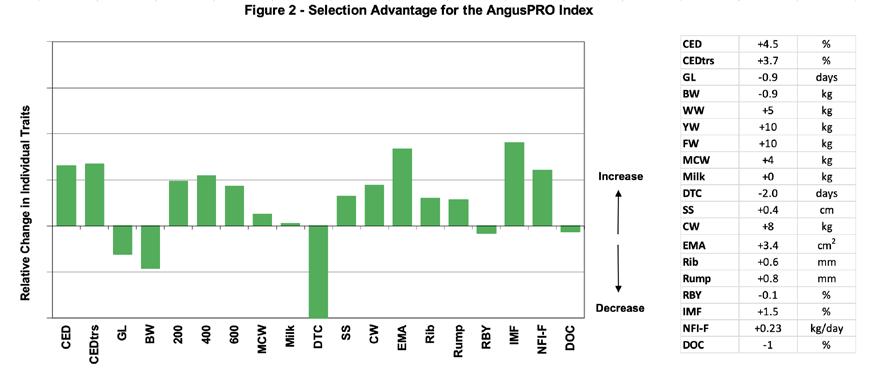
Selection Advantage
Figure 2 shows the selection advantage if animals are selected using the $PRO index.
The selection advantage is calculated by ranking well used sires within the Angus breed on the $PRO index, and comparing the average EBVs of the sires in the highest 10% with the average EBVs of all sires from which they were selected. For example, the sires ranked in the highest 10% based on the $PRO index had 9 kg higher 400 Day Weight EBVs and 1.2 kg lower Birth Weight EBVs than the average EBVs of the sires from which they were selected. The selection advantage is indicative of the long term direction and relativity of response that will occur in individual traits if selection is based on the $PRO index. The actual response that is observed will vary depending on the features of the individual breeding program.
Selection Index Summary
New Zealand production system
Self replacing herd
· Daughters are retained for breeding
Steer progeny are finished on pasture for the AngusPure programme.
Steer progeny slaughtered at a carcase weight of 290 kg at 20 months of age
· Significant premium for steers that exhibit superior marbling
A feature of the $PRO index is a selection advantage of close to 0 for mature cow weight, meaning that selection on this index will maintain mature cow weight, while still increasing growth to 200, 400 & 600 days of age.
$PRO Calving Ease 15% Mature Cow Weight 9% Fertility 17% Carcase Quality 9% Carcase Yield 22% Growth 20%
Figure 1: Trait Contribution to the AngusPRO Index
Angus Selection Index Comparison
· New Zealand production system
· Self replacing herd
Daughters are retained for breeding
· Terminal breeding program where Angus bulls are being used as a terminal sire over mature females
· Steer progeny are finished on pasture for the AngusPure programme. Steer progeny slaughtered at a carcase weight of 290 kg at 20 months of age
· All progeny, both male and female, are slaughtered Focus on increasing growth, carcase yield and eating quality.
Index Description
Selection
$GS & $GS-L
· Self replacing herd Daughters are retained for breeding
· No emphasis is given to female fertility or maternal traits
Significant premium for steers that exhibit superior marbling
$GN & $GN-L
· Self replacing herd Daughters are retained for breeding
Steer progeny are finished on pasture
· Steer progeny slaughtered at a carcase weight of 350 kg at 22 months of age
Steer progeny are pasture grown with a 250 day feedlot
finishing period
Eating quality traits important to suit MSA program
Steer progeny slaughtered at a carcase weight of 455 kg at 24 months of age
· $GS includes an objective of maintaining mature cow weight, whereas the $GS-L does not include this objective
· Targeting high quality, highly marbled markets with a significant premium for superior marbling
$GN includes an objective of maintaining mature cow weight, whereas the $GN-L does not include this objective
$D & $D-L
· Self replacing herd
Daughters are retained for breeding
Steer progeny are either finished using pasture, pasture supplemented by grain or grain (eg. 50 –70 days)
· Steer progeny slaughtered at a carcase weight of 280 kg at 16 months of age
Eating quality traits important to suit MSA program
· $D includes an objective of maintaining mature cow weight, whereas the $D-L does not include this objective
$A & $A-L
· Self replacing herd
Daughters are retained for breeding
Identifies animals that will improve overall profitability in the majority of commercial, self replacing, grass and grain finishing beef production systems.
$A includes an objective of maintaining mature cow weight, whereas the $A-L does not include this objective
$T $PRO
www.angusaustralia.com.au Selection Advantage $A $A-L $D $D-L $GS $GS-L $GN $GN-L $T $PRO Calving Ease Direct Calving Ease Dtrs Gestation Length Birth Weight $A, $A-L YW FW Mature Cow Weight Milk Days to Calving Scrotal Size Carcase Weight Eye Muscle Area Rib Fat Rump Fat Retail Beef Yield Intramuscular Fat NFI (Feedlot) Docility +4.2 % +3.0 % -0.6 days -0.9 kg +6.3 kg +11.3 kg +11.4 kg +0.1 kg +2.6 kg -1.7 days +0.2 cm +8.4 kg +4.2 cm 2 +0.1 mm +0.1 mm +0.1 % +1.4 % +0.2 kg/day -0.3% +4.0 % +3.6 % -1.2 days -0.6 kg +9.7 kg +18.4 kg +22.8 kg +19.1 kg +1.8 kg -1.5 days +0.5 cm +15.3 kg +2.6 cm 2 -0.1 mm -0.2 mm -0.0 % +1.1 % +0.1 kg/day +0.4% +3.9 % +3.0 % -0.9 days -0.7 kg +7.1 kg +13.3 kg +13.0 kg +3.9 kg +2.4 kg -1.8 days +0.3 cm +9.7 kg +3.7 cm 2 -0.0 mm -0.1 mm +0.2 % +1.0 % +0.2 kg/day -0.3% +4.1 % +3.5 % -1.3 days -0.6 kg +9.7 kg +19.0 kg +22.0 kg +19.3 kg +1.5 kg -1.6 days +0.5 cm +15.4 kg +2.6 cm 2 -0.2 mm -0.5 mm +0.1 % +0.7 % +0.1 kg/day +0.2 % +3.9 % +3.1 % -0.7 days -0.8 kg +6.2 kg +11.4 kg +12.2 kg +1.7 kg +2.4 kg -1.9 days +0.3 cm +8.6 kg +3.9 cm 2 +0.2 mm +0.3 mm +0.0 % +1.5 % +0.2 kg/day -0.4 % +3.7 % +3.3 % -1.3 days -0.4 kg +9.2 kg +17.5 kg +22.9 kg +20.8 kg +1.7 kg -1.8 days +0.6 cm +15.1 kg +2.6 cm 2 -0.1 mm -0.2 mm -0.0 % +1.1 % +0.1 kg/day +0.3 % +3.5 % +2.4 % -0.4 days -0.8 kg +6.4 kg +11.2 kg +10.5 kg -1.3 kg +3.0 kg -1.4 days +0.2 cm +8.0 kg +4.2 cm 2 +0.1 mm +0.2 mm -0.0 % +1.8 % +0.2 kg/day +0.4 % +4.0 % +3.4 % -1.1 days -0.7 kg +9.4 kg +17.2 kg +20.4 kg +14.9 kg +2.1 kg -1.5 days +0.4 cm +13.8 kg +2.6 cm 2 -0.0 mm -0.0 mm +0.2 % +1.5 % +0.2 kg/day +0.4 % +2.7 % +1.8 % -0.7 days -0.4 kg +11.4 kg +21.1 kg +25.3 kg +20.5 kg +1.7 kg -0.6 days +0.6 cm +16.5 kg +3.4 cm 2 -0.6 mm -0.9 mm +0.0 % +1.3 % +0.1 kg/day -2.9 % +4.5 % +3.7 % -0.9 days -0.9 kg +5.0 kg +9.6 kg +10.4 kg +3.8 kg +0.2 kg -2.0 days +0.4 cm +7.8 kg +3.4 cm 2 +0.6 mm +0.8 mm -0.1 % +1.5 % +0.2 kg/day -0.8 %
Selection Advantage
Questions
To further discuss the selection indexes that are published within the TransTasman Angus Cattle Evaluation, please contact staff at Angus Australia on 02 6773 4600.
Further information is also available from the ‘Understanding Selection Indexes’ module in the Angus Education Centre, which can be accessed from the Angus Australia website.