
Building a Safe and Complete Transportation Network: Bicycle and Pedestrian Master Plans for FDOT’s Districts One and Seven


Bessie Reina, CNU-A Jensen Hackett
Musselman,Jennifer PE

Patty Hurd PE, AICP


Presenters

1 Why are FDOT Districts Developing Active Transportation Plans? 2 What Are People Asking for On State Roadways 4 Elements of the Plans Coordination with Local PlansAGENDA3

11%were2021Nationally,roadfatalitiesupover2020 lives42,915lost in 2021 in the United States Road Fatalities: A Public Health Crisis


Fatality Trends in Florida Ped/Bike 22% Intersection 33% Lane Departure 37% Other 8% Fatalities (3-Year Average)fof22%roadatalities in Florida are people walking or biking Road Fatalities: A Public Heath Crisis

Florida(2021) is 1st in BICYCLE FATALITIES by total number (161) and by rate per population (2019) in nationthe Road Fatalities: A Public Heath Crisis


“As one FDOT team, we serve the people of Florida by providing a transportation network that is well planned, supports economic growth, and has the goal of being congestion and fatality free.”
FDOT has adopted the Vision Zero target

9 Fatalities and Serious Injuries are RedundancySafetyResponsibilityHumansHumansUnacceptableMakeMistakesareVulnerableisSharedisProactiveisCrucialSafe654321 Systems Approach

Plan for shared use paths and separated bicycle lanes

•
Assign bicycle facilities through a consistent and efficient process

•
Insure integration of FDOT facilities with local and regional plans
•
FDOT Design Manual
•
Cost efficient
Connectivity Create continuousaandconnectednetwork Comfort Foster forconvenienceandcomfortalltypesofusers Equity Increase access to civiceducation,employment,andresourcesforunderservedcommunities Safety walkingsafetyImproveforpeopleandbiking EconomicVitality culturalconnectingeconomicPromotegrowthbyfacilities,schools,transithubs,andemploymentcenters MASTER PLAN GOALS


13 Types of Cyclists • Cautious: prefer off-street or physically separated facilities in most settings • Somewhat Confident: prefer separated facilities but willing to ride on bicycle lanes or paved shoulders • Confident: comfortable with riding in traffic and using roads without bike lanes Consistent with FDOT’s Complete Streets Policy, the default D7 target user will be the Cautious group, unless unique conditions require special consideration

14 Bicycle Counts in District 5 Count data shows that comfort decreases with vehicles speeds. At 45 mph and above, less than 10% of people biking rode in a bike lane PostedSpeedLimit(mph) Number SegmentsRoadwayof Bicyclists Count Percentage of Bicyclists In LaneBicycle SidewalkOn In LaneBicycle On Sidewalk 30 16 9,466 6,353 59.8% 40.2% 35 7 0 166 0.0% 100.0% 40 20 2,583 6,724 27.8% 72.2% 45 68 2,301 21,307 9.7% 90.3% 50 12 447 4,133 9.8% 90.2% PostedSpeedLimit(mph) Number SegmentsRoadwayof Bicyclists Count Percentage of Bicyclists In LaneBicycle OnUseSharedPath In LaneBicycle OnUseSharedPath 50 4 325 925 25.8% 74.2% 55 2 0 494 0 100% Bicycle Counts Where There is a Bicycle Lane and Sidewalk Bicycle Counts Where There is a Bicycle Lane and Shared Use Path
15 36 Partner Agencies 17 Local Governments 3 Colleges/Universities & School Districts 11 Bicycle Organizations 3 Transit Agencies When: June 6, 2021 – August 17,2021 User Survey – District 1 53.2% WOMEN 43.8% MEN 2,033 RESPONSES(3%prefernottoanswer/nonbinary,orprefertoselfdescribe) How: Social media, flyer, and through the help of partnerships
16

17 Bicycle Facility Comfort Trail Separated Bike Lane All Groups Women BufferedMen Bike Lane Sidewalk Roadway Shoulder Travel Lane Vehicleswith 74%86%78% 48%59%56% 46%56%51% 21%21%12% 4%12%8%96%96%97% I’M COMFORTABLE RIDING A BICYCLE ON (SELECT ALL THAT APPLY)


Other (please specify) biking on the road under most roadway conditions
Of the 137 comments provided for this question’s other (please specify) option, 42 were about driver behavior, and 40 were about bicycle infrastructure. I DO NOT FEEL COMFORTABLE BIKING WHEN… Bicycle Comfort
There are too many cars
Drivers are aggressive (honk/drive too close)
There are large intersections
There is poor lighting
There are obstructions in the sidewalk
There are no bicycle lanes
There are too many trucks
The bicycle lanes are not separated from the vehicle lanes
I feel comfortable
The bicycle lanes are narrow
18 62%66%66%67%70%76%76%79% 39%42%47%49%51%53% 15% 7%8%

Drivers go too fast
There is no trail
There is no shade
The pavement or surface is uneven (i.e., potholes, drainage grates, debris)
There are too many cars turning at intersections or driveways
The sidewalk is too narrow to ride on
19 86% 91% 26% 10% 1%2% 14% 18% 35% 3%3% 88% 94% 61%64% 5% 10% 37%40% 60% 0% 8% 74% 94% 45% 16% 3%3% 29%29% 52% 3%3%Gochurch/attendVisitCommuteCommute(example:PersonalExercise/healthRecreation/joyerrandsgrocery…toworktoschoolGettothebusafriend/attendsocial…toarestaurant/barGettoapark/trailIdonotbikeOther(pleasespecify) All LowTransitResponsesUsersincomeresponses All respondents reported they primarily bike for recreation and Transithealth.users also reported biking for the following reasons at a higher rate than other respondents: • Run errands (64%) • Commute to work (61%) • Visit friends (37%) • Go to restaurants (40%) • Get to the park (60%) Why People Bike
20 5% 95% 5% 95% 32% 68% 27% 73% Yes for Walking No for Walking Yes for Biking No for Biking All Responses Low income responses Why People Walk and Bike A significant percentage of low-income respondents reported that they bike or walk because there are no or few means of transportation available to them I WALK/BIKE BECAUSE THERE ARE NO/FEW OTHER MEANS OF TRANSPORTATION AVAILABLE TO ME…
21 34% 34% 29% 26% 22% 20% 13% factorsconditionsClimate(seasonallikeheatorcold) Otherspecify)(please There is no place for me to walk to It is difficultphysicallyformetowalk There is no sidewalk near me Weather (e.g. rain or wind) I don’t feel walkingsafe Why People Walk The built form is a significant reason why respondents reported not wanting to walk to destinations— 29% responded that THERE ARE NOT PLACES FOR THEM TO WALK. I DO NOT WALK TO DESTINATIONS BECAUSE…


Existing Bicycle and Pedestrian Master Plans and Long Range Plans

Comparison to

*Bright colors indicate segments identified in local Bicycle and Pedestrian Masters Plans/LRTPs. Dull colors reflect the scoring on the rest of the network.

24 • Understand walk and bike conditions on state roads • Provide guidance on where to apply treatments in the FDOT Design Manual and Traffic Engineering Manual • Identify gaps in the walk and bike network and prioritize projects for implementation
District 7 Plan Goals

25
D7 Plan Overview

D7 Intended Outcomes


For state roadways within 7 SelectionFacilityPlanning

Bicycle
District
Identify Preliminary Bicycle Facility
* For curbed roadways, one way separated bicycle lanes are generally preferable, if feasible. If one way separated bicycle lanes cannot be incorporated, a two way separated bicycle lane or shared use path should be considered. The primary consideration in choosing between the two include anticipated level of pedestrian demand and potential for bicycle and pedestrian conflict; where pedestrian demand is high, a separated bicycle lane is preferred over a shared use path. On flush shoulder roadways, a shared use path is the preferred facility type.

Gap Identification: Preliminary Bicycle Facility


29

Gap Identification: Minimum Bicycle Facility


30

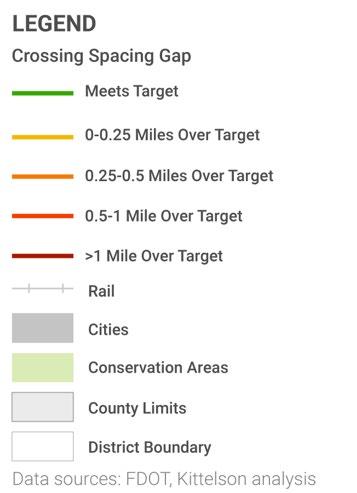
31 Recommended Pedestrian Crossing Spacing Context Classification Target Spacing Range (Feet) C2T-Rural Town 250-500* C3R-Suburban Residential Within 250 feet of pedestrian generator or no more than 2640 CommercialC3C-Suburban Within 250 feet of pedestrian generator or no more than 1320 C4-Urban General 250-660 C5-Urban Center and C6-Urban Core 250-500* *Based on typical downtown and rural town center block lengths in D7 Proposed to apply only to enhanced crossings
32
Prioritizing Gaps


33 Existing Conditions Priority Bicycle and Pedestrian Investment Areas Bicycle and Pedestrian Facilities Toolkit (Systemic Investments) D1 Plan Overview


Lane Use Elements • Colleges/universities • Cultural facilities/tourist attractions sports arenas • Public schools • Activity centers • Rail/transit stops StreetLight Data D1 Demand Analysis

D1 Priority Areas • Priority investmentmultimodalcorridors • Priority corridorsmanagementspeed • Priority intersectionssignalized • Priority candidates for green paint Priority Multimodal Investment Corridors

Advanced Safety Tool Presents • Existing contextpreliminaryclassification • Future contextpreliminaryclassification • Advanced safety score components and composite score • Bicycle StreetLight data • Pedestrian StreetLight data • Level of traffic stress • Priority corridors • Priority intersections


LocationsPreferred for Shared Use Paths and BicycleSeparatedFacilities

39 • Review recommendationsplan for all ongoing and upcoming projects • Review current work program for high priority gaps • Look for other opportunities to proactively fill priority gaps Advancing the Plans34th St S (St. Petersburg) Wide Sidewalks and Additional Crossings


How to Find Out
D1 Planning Manager (863)- 519Bessie.Reina@dot.state.fl.us2656
Bessie Reina, CNU-A
40
(813) Jensen.Hackett@dot.state.fl.us975-6283
D7 Bike & Ped Coordinator | MPO Liaison
More?Jensen
Hackett