
Andrea Galinski . Assistant Scholar UF Shimberg Center for Housing Studies New Tools for Planners: Affordable Housing & Coastal Flood Hazard Exposure Tool [PART 1] Creating a Housing Resilience Strategic Plan: Protecting Vulnerable People and Properties Florida Chapter, American Planning Association Conference Friday Sept. 9, 2022


and 3)
• Includes state/regionally standardized flood hazard datasets
• Includes non-subsidized affordable housing or “naturally occurring affordable housing” (NOAH) (unique and useful dataset)

Benefits:
REACH Affordable Housing + Coastal Flood Hazards
• Create a browser-based tool for display of housing exposed to coastal flood hazards

Goals: publicly assisted, affordable market-rate, mobile home stock vulnerable to coastal flood hazards across the 7-county Resilience Coalition footprint
Assesses 1)
• Enable housing characteristics to be queried, summarized, visualized, and downloaded for further analysis on the desktop
• Assists local governments in conducting vulnerability assessments per FDEP’s state-wide VA standards
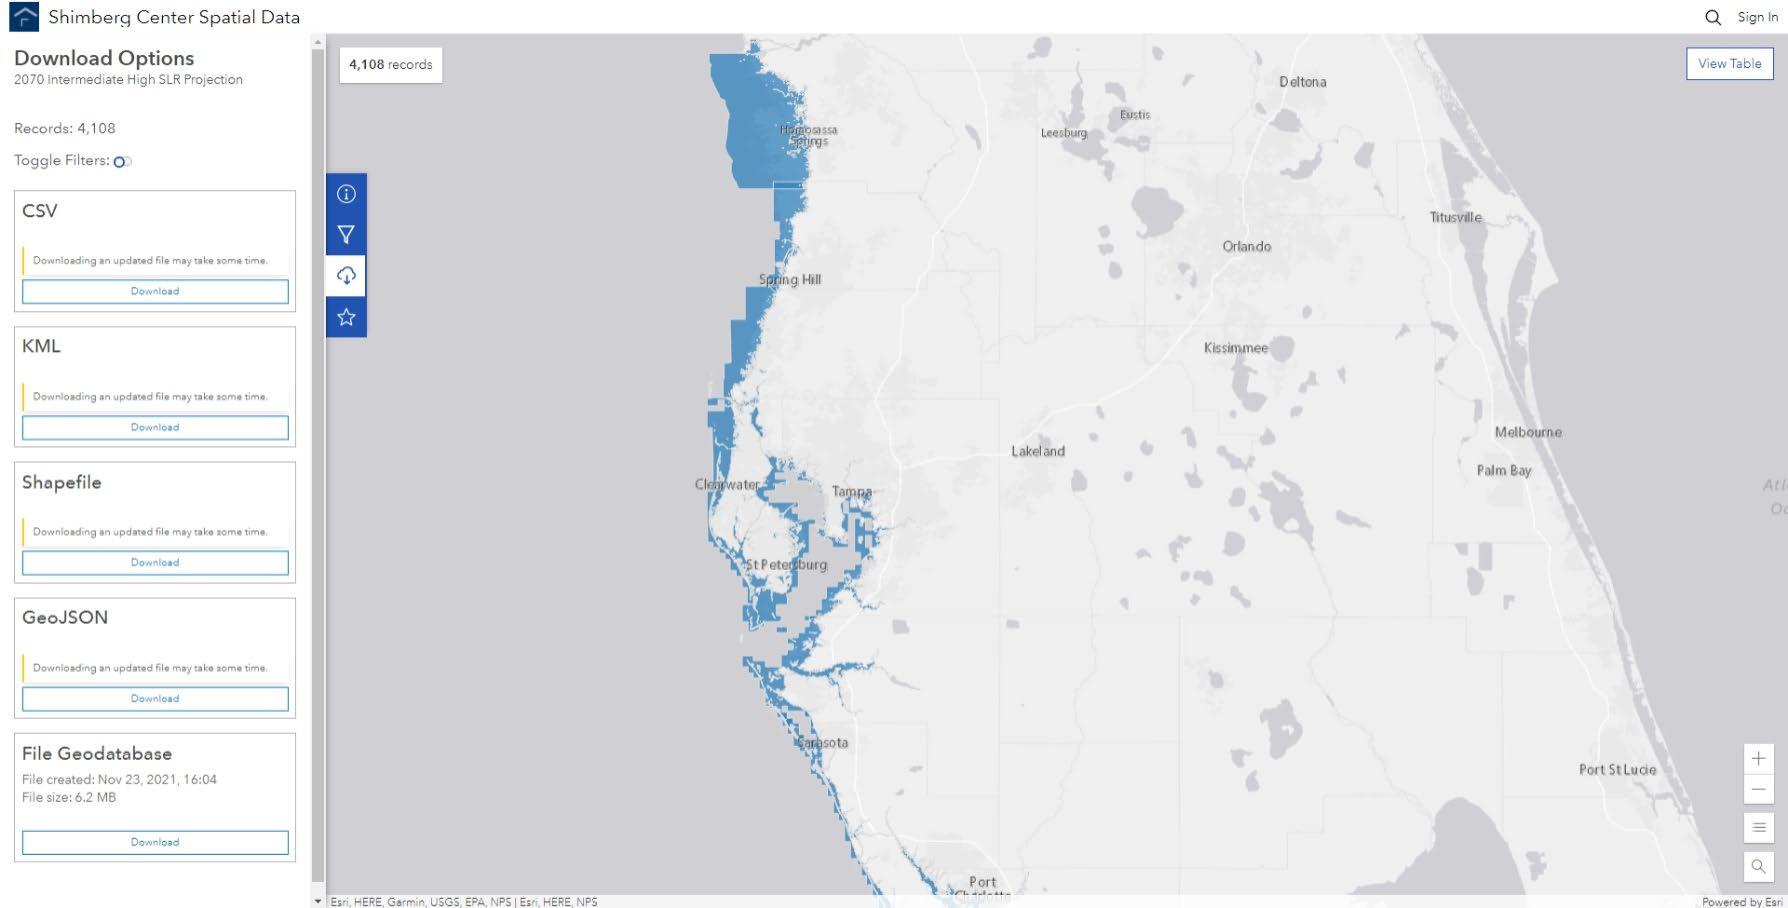
housing and flood hazard web application https://arcg.is/Hzvzv
2)
Web App
housing and flood hazard web application 1. 100 year Floodplain 2. 500 year Floodplain 3. High Frequency Storm Surge Exposure (Cat 1 3) 4. Low Frequency Storm Surge Exposure (Cat 4-5) 5. Post Irma Flooded Lands 6. 2020 SLR (NOAA, IH) 7. 2040 SLR (NOAA, IH) 8. 2070 SLR (NOAA, IH) 9. 2020 King Tide + SLR (NOAA, IH) 10. 2040 King Tide + SLR (NOAA, IH) 11. 2070 King Tide + SLR (NOAA, IH) 12. 2020 10 Year Storm Surge + SLR (NOAA, IH) 13. 2040 10 Year Storm Surge + SLR (NOAA, IH) 14. 2070 10 Year Storm Surge + SLR (NOAA, IH) 15. 2020 SLR (NOAA, IL) 16. 2040 SLR (NOAA, IL) 17. 2070 SLR (NOAA, IL) 18. 2020 King Tide + SLR (NOAA, IL) 19. 2040 King Tide + SLR (NOAA, IL) 20. 2070 King Tide + SLR (NOAA, IL) 21. 2020 10-Year Storm Surge + SLR (NOAA, IL) 22. 2040 10 Year Storm Surge + SLR (NOAA, IL) 23. 2070 10 Year Storm Surge + SLR (NOAA, IL) How can we better understand coastal flood hazards? Flood Hazard Exposure Index (Cumulative, All Scenarios, 2020-2070) FloodplainsFEMA King Tide SeaRiseLevelStorm Surge Post-IrmaFlooding


0
Flood Hazard Exposure Index (Cumulative, All Scenarios, 2020-2070)
housing and flood hazard web application


• = flood hazards
= 16-23
None, Low, Medium, and High
• score = flood hazards
How can we better understand coastal flood hazards?
• score = flood hazards
Low
Medium
• score flood hazards

Overall exposure is a sum of values:
1-7
None
8-15
High
WHY TO: APPLICATIONS + USE CASES

Floodplain100-Year Floodplain500-YearHigh Frequency Storm Surge Cat 3Storm10-yearSurge* Low StormFrequencySurgeCat 5 King Tide* applications + use cases Use Case #1: Where are properties exposed to flood hazards? Mobile Homes, Current day, 2020 * 2020, IH


Use Case #2: How does flood hazard exposure change over time?


Assisted Housing, 2020 vs. 2070 (IL/IH)
2070 IntermediateLow 2020 2070 IntermediateHigh
applications + use cases
applications + use cases Use Case #3: Who lives in areas potentially exposed to flood hazards? 2070 (IH) NameDevelopment City County UnitsAssisted PopulationTarget BuiltYear % Elderly % Children % White % Black % Hispanic Avg. IncomeHH Floodplain ExposureComposite ApartmentsAqua Tampa Hillsborough 197 FamilyElderly; 1971 97% 0% 10% 5% 85% $11,410 Floodplain100-Year High Landings At Sea Forest New RicheyPort Pasco 200 FamilyElderly; 1998 93% 44% $21,079 Floodplain100-Year High Laurel Trace PetersburgSt. Pinellas 9 Persons Disabilitiesw/ n/a 100 FloodplainYear High SpringsTarponRiverside SpringsTarpon Pinellas 258 Family 2001 17% 58% $22,894 500 FloodplainYear High Table results from web application


Use Case #4: What are local housing patterns?
Clustering of Housing by Type
applications + use cases
• In Pinellas County, affordable market-rate housing (single family, multifamily, condos) is distributed in clusters across the county

• Mobile homes tend to cluster more towards the central and northern portion of the county

• Subsidized multifamily (AHI) and affordable market-rate housing (NOAH) are often co-located in similar Census tracts


1) Tract-scale mitigation opportunities, or
2) Investments in community development/ redevelopment initiatives
AHI and NOAH are co-located in some areas, offering opportunities for mitigation and investments
applications + use cases
• Clusters of mobile homes could indicate areas for potential mitigation opportunities in more “rural” areas
• Clusters of AHI and NOAH could indicate areas for potential prioritization of:
• However, AHI and mobile homes are clustered in different tracts
Circles show tracts where extent of FHEI has increased.
• Average FHEI for AHI properties by Census tract over time (2020, 2070)
AHI + Flood Hazard Exposure Index (FHEI), 2020-2070
2020 2070
Use Case #5: Where does AHI increasing flood hazard exposure change over time?
• Note the areas where the AHI property exposure increases over time


applications + use cases
• Provides one approach for the prioritization of mitigation strategies
Mitigation Applications Putting information to action applications + use cases • Information can be used to determine and prioritize mitigation activities • Use hazard, housing, and tenant information to refine flood mitigation actions • Shimberg analysis is conducted at a preliminary planning scale • Prioritize certain sub-geographies (Census tracts or hot spots) for more detailed flood studies • For example, you could explore tracts or hot spots with: • High counts of co-located AHI and NOAH • Large mobile home parks • “High” flood hazard exposure index • High counts of properties in the floodway • Could overlay the above Census tracts or hot spots with watershed boundaries for more holistic mitigation approaches
of new development, as well as mitigation of existing development • Huge need for affordable housing, but where is it going? • How can we balance access to transit, jobs, and flood hazards?
Applications Putting
Mitigation information to Housing planners and program managers need to be involved in hazard assessment and mitigation planning (LMS) location
action applications + use cases • Better compete for pre-disaster or post-disaster mitigation funding (BRIC, etc.) •
• Think about
HOW TO: USE THE AFFORDABLE HOUSING + FLOOD HAZARD WEB APP
Main widget barAddress or name search bar Navigation widgets REACH Affordable Housing + Coastal Flood Hazard Tool https://arcg.is/Hzvzv

List of data layers widget


Assisted Housing Inventory Questions

Query widget


Residential Parcel Questions


Drag and drop or select CSV file
Identify flood hazards for a list of properties widget

HOW TO: USE THE OPEN DATA LIBRARY
housing and flood hazard web application REACH Open Data Library Developed Tools and Resources • Assisted Housing Inventory Flood Hazard Exposure • Residential Parcel Flood Hazard Exposure (NOAH + MH) • Regional Flood Hazard Mesh • Social Vulnerability and Demographic Data • 2040/2070 NOAA SLR Scenarios (2017 IH and IL) • TBRPC and county boundaries • Data fields crosswalk and definitions https://shimberg center spatial data 1 1 ufl.hub.arcgis.com/pages/reach project

REACHhttps://shimberg-center-spatial-data-1-1-ufl.hub.arcgis.com/pages/reach-projectOpenDataLibrary


More info Filter data Download data Add to favorites

RESOURCES
• REACH Housing and Flood Hazard Web Application, https://arcg.is/Hzvzv
• Housing Needs Data Portal for Local Governments, http://flhousingdata.shimberg.ufl.edu/reach


Hazard Web App Resources
resources
REACH Affordable Housing + Coastal Flood

• Tampa Bay RPC REACH Page, https://www.tbrpc.org/reach/

• REACH Web-Based Geospatial Data Library, https://shimbergcenter-spatial-data-1-1-ufl.hub.arcgis.com/pages/reach-project
THANK http://andrea.galinski@ufl.eduYOU!www.shimberg.ufl.edu / @ ShimbergCenter

FGDL, 2020
TBRPC/AECOM, 2021 CSAP, NOAA,20182017
Flood Hazard Zones of the Digital Flood Insurance Rate Map (DFIRM) in the State of Florida- November 2020 100-year (1.0%) and 500-year (0.2%) floodplains
Sea Level Rise (SLR) Sea level rise projections based on NOAA 2017 Intermediate-Low and Intermediate-High values for 2020, 2040, 2070
Storm Surge Projected surge inundation based on SLOSH modeling and coastal digital elevation models (DEMs); includes High Frequency (Category 1-3) and Low Frequency storms (Category 4-5)
Satellite imagery of flooded coastal and inland areas post-Hurricane Irma in September, 2017 Atmospheric and Environmental Research, 2017
Hazard Data Layer(s) + Notes Source
housing and flood hazard web application
NOAA National Hurricane Center, 2018
Flood Hazard Data Layers + Sources
King Tide Flooding (+SLR) SLR projections added to King Tide projections developed by AECOM TBRPC/AECOM, 2021
10 Year Storm Surge (+SLR) SLR projections added to storm surge projections developed by AECOM TBRPC/AECOM, 2021
FEMA Digital Flood Insurance Rate Map (DFIRM)
FEMA
Post-Irma Flooding
UF Shimberg Center for Housing Studies, 2021
Housing + Households Data Layers + Notes Source
U.S. Census Bureau, 2019
UF Shimberg Center for Housing Studies, 2021
FGDL, Florida Department of Revenue (FDOR), 2020
Details on population variables are available here
UF GeoPlan 2020 Statewide Parcel Data based on FDOR County and municipal property tax data
Social Vulnerability CDC Social Vulnerability Index and U.S. Census Bureau’s ACS Demographics
Assisted Housing + Households
Shimberg Center analysis of DOR residential parcel data to identify affordable market-rate properties (based on TBRPC regional average rent threshold and other spatial characteristics)
CDC, U.S. Census Bureau, 2018
Assisted Housing Inventory, Florida Housing Data Clearinghouse, accessed April 19, 2021
U.S. Census Bureau, 2015-2019 American Community Survey
All Residential Parcels
Naturally Occurring Affordable Housing (NOAH)
Housing Data Layers + Sources
housing and flood hazard web application
NOAH Household Attributes