Sustainability from


How this is being
Wrap up and
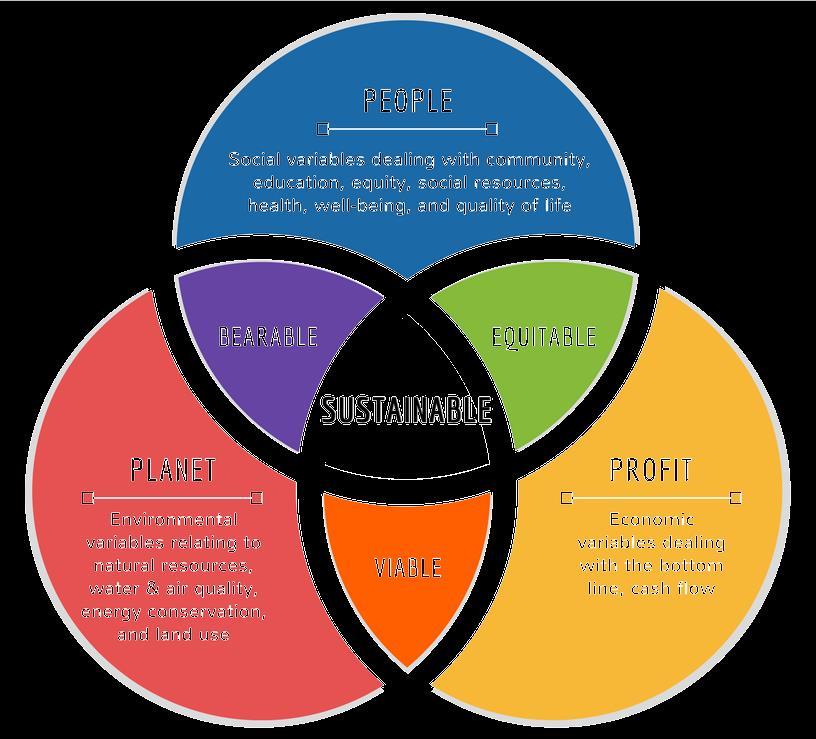
• Organized transportation and utility infrastructure
• Protection for environmental and cultural resources
• Global economy changed the economic base of most U.S. communities, leaving many formerly vibrant manufacturing regions with declining populations, fragile economies, outdated infrastructure
• End of cheap oil heralds a likely end to unbridled exurban expansion and a more diverse and complex energy future
• Serious environmental challenges demand new thinking about how communities are planned https://www.planning.org/divisions/sustainable/
Social sustainability is largely neglected in mainstream sustainability debates. Priority has been given to economic and environmental sustainability in particular in the context of planning, housing and communities, where policy and investment has focused on renewable resources, low carbon communities and encouraging pro-environmental behaviour in households. As a result, there are few practical resources that directly address the question of how to create places that are socially sustainable, as well as physical infrastructure that is environmentally sustainable. Social Life, www.social life.co
the relationship between people and
places – how people are affected by changes in the built environment


The fraction of Americans earning more than their
parents has shrunk from more than 90% of those born in the 1940s to 50% of those born in the 1980s
…
• We’re getting older
Income inequality worsened – upward mobility stalled
Housing is not as affordable, supply not keeping up with demand
Homes, subdivisions, stores got bigger
Infrastructure is aging, straining local budgets
Since the 1960s:
(100,000 short in the next 4-year period)
Between 2000 and 2040:
Median home price increased 121%
Strong external demand
Median rent increased by 72%
The fraction of Americans earning more than their parents has shrunk from more than 90% of those born in the 1940s to 50% of those born in the 1980s
The number of Americans age 65+ will more than double The number of Americans 85+ will nearly quadruple
Second home buyers, investors
Median household income increased 29%
Strong job growth
Material and labor shortages
…
• We’re getting older
• Income inequality worsened – upward mobility stalled
• Housing is not as affordable, supply not keeping up with demand
• Homes, subdivisions, stores got bigger
• Infrastructure is aging, straining local budgets
…
• We’re getting older
• Income inequality worsened – upward mobility stalled
• Housing is not as affordable, supply not keeping up with demand
• Homes, subdivisions, stores got bigger
• Infrastructure is aging, straining local budgets


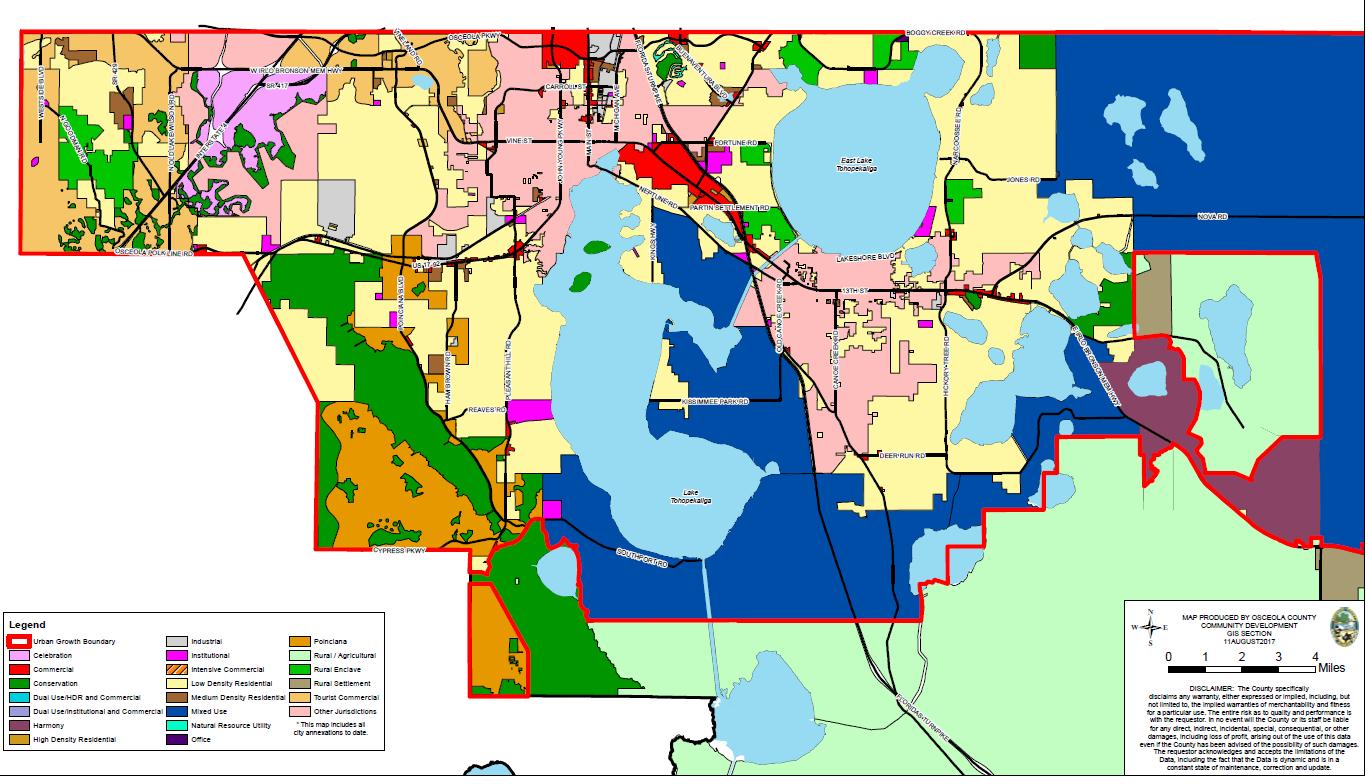

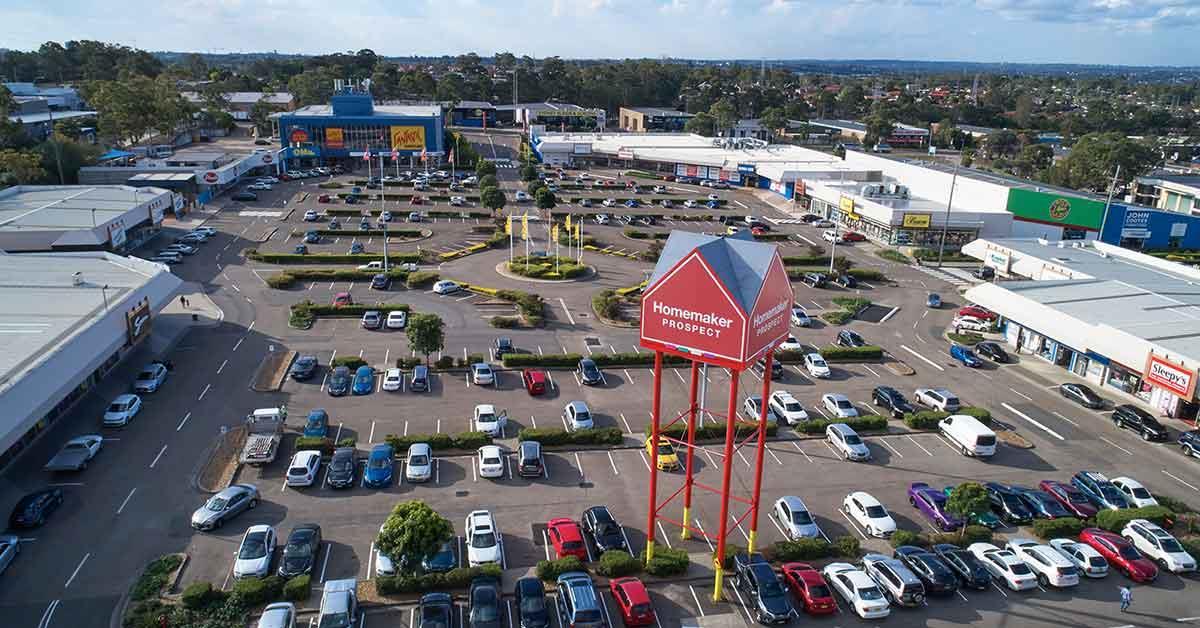
Yes it’s ugly, but more importantly, it’s highly inconvenient – and even more importantly, it’s unsafe. And the people who live near these areas and have to navigate them are, in large part, low-income people without cars (and to a smaller extent, seniors and sometimes children/teens, who can’t drive).
From a planning perspective, a community that’s sustainable should work for everyone, but if people can’t get around on a daily basis without a car, it simply does not work for them.
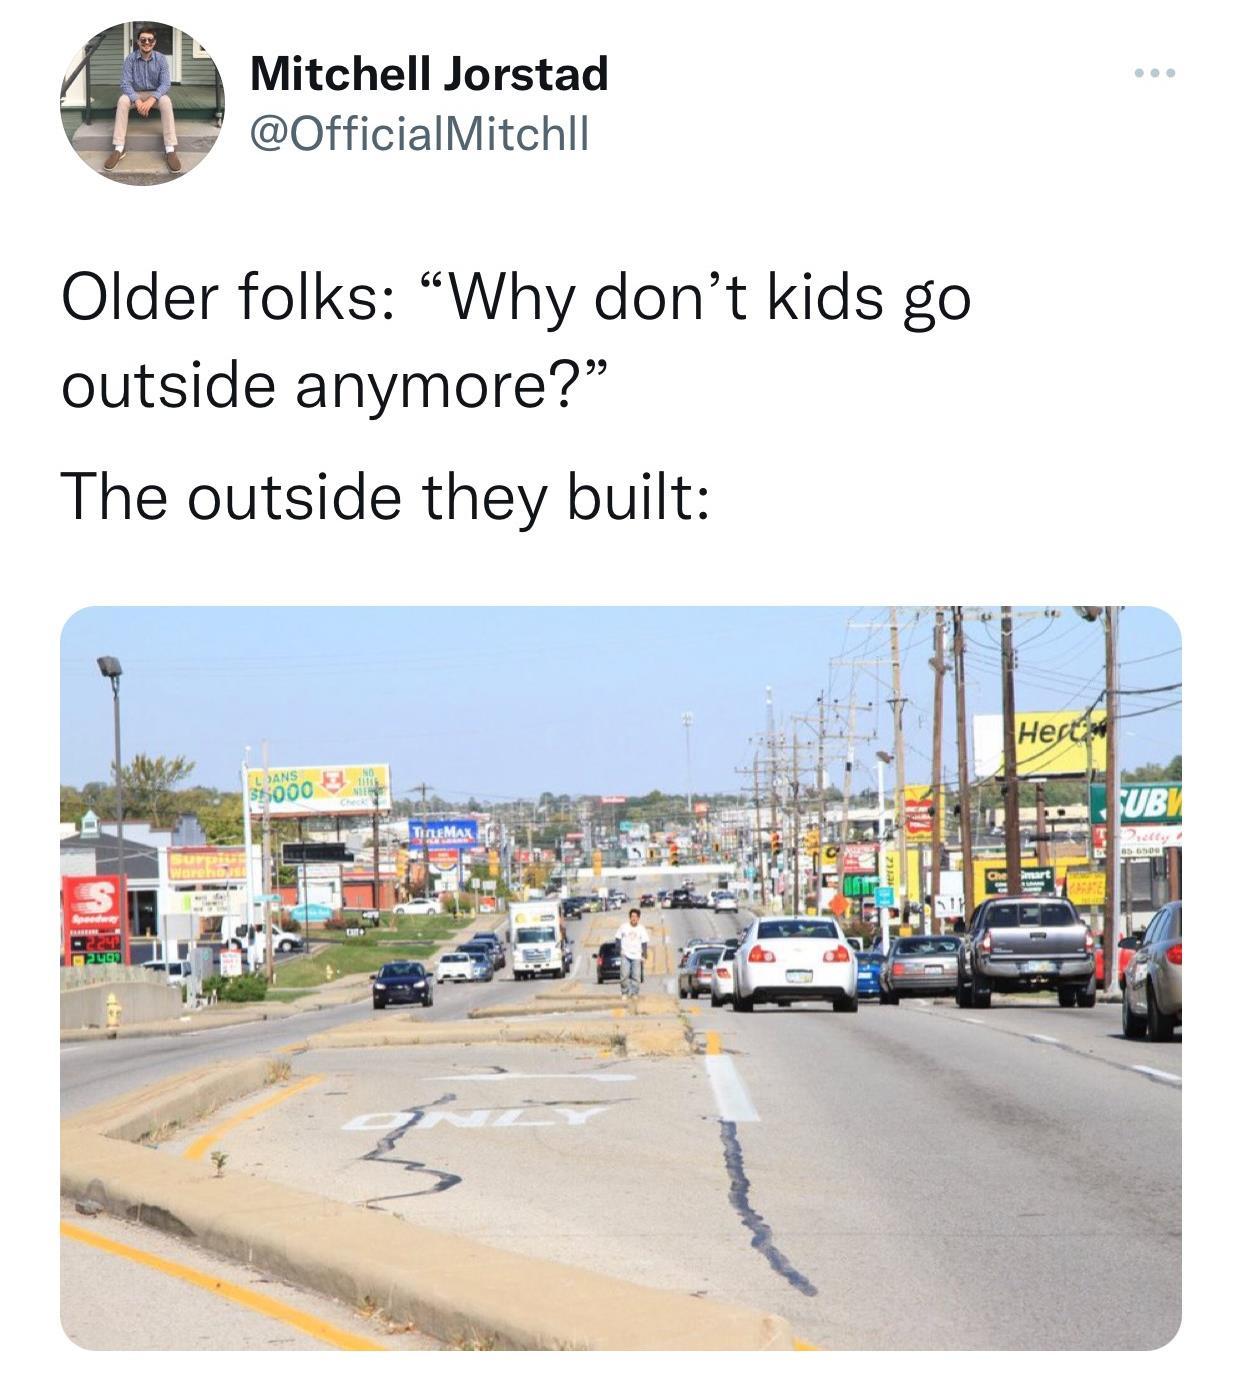
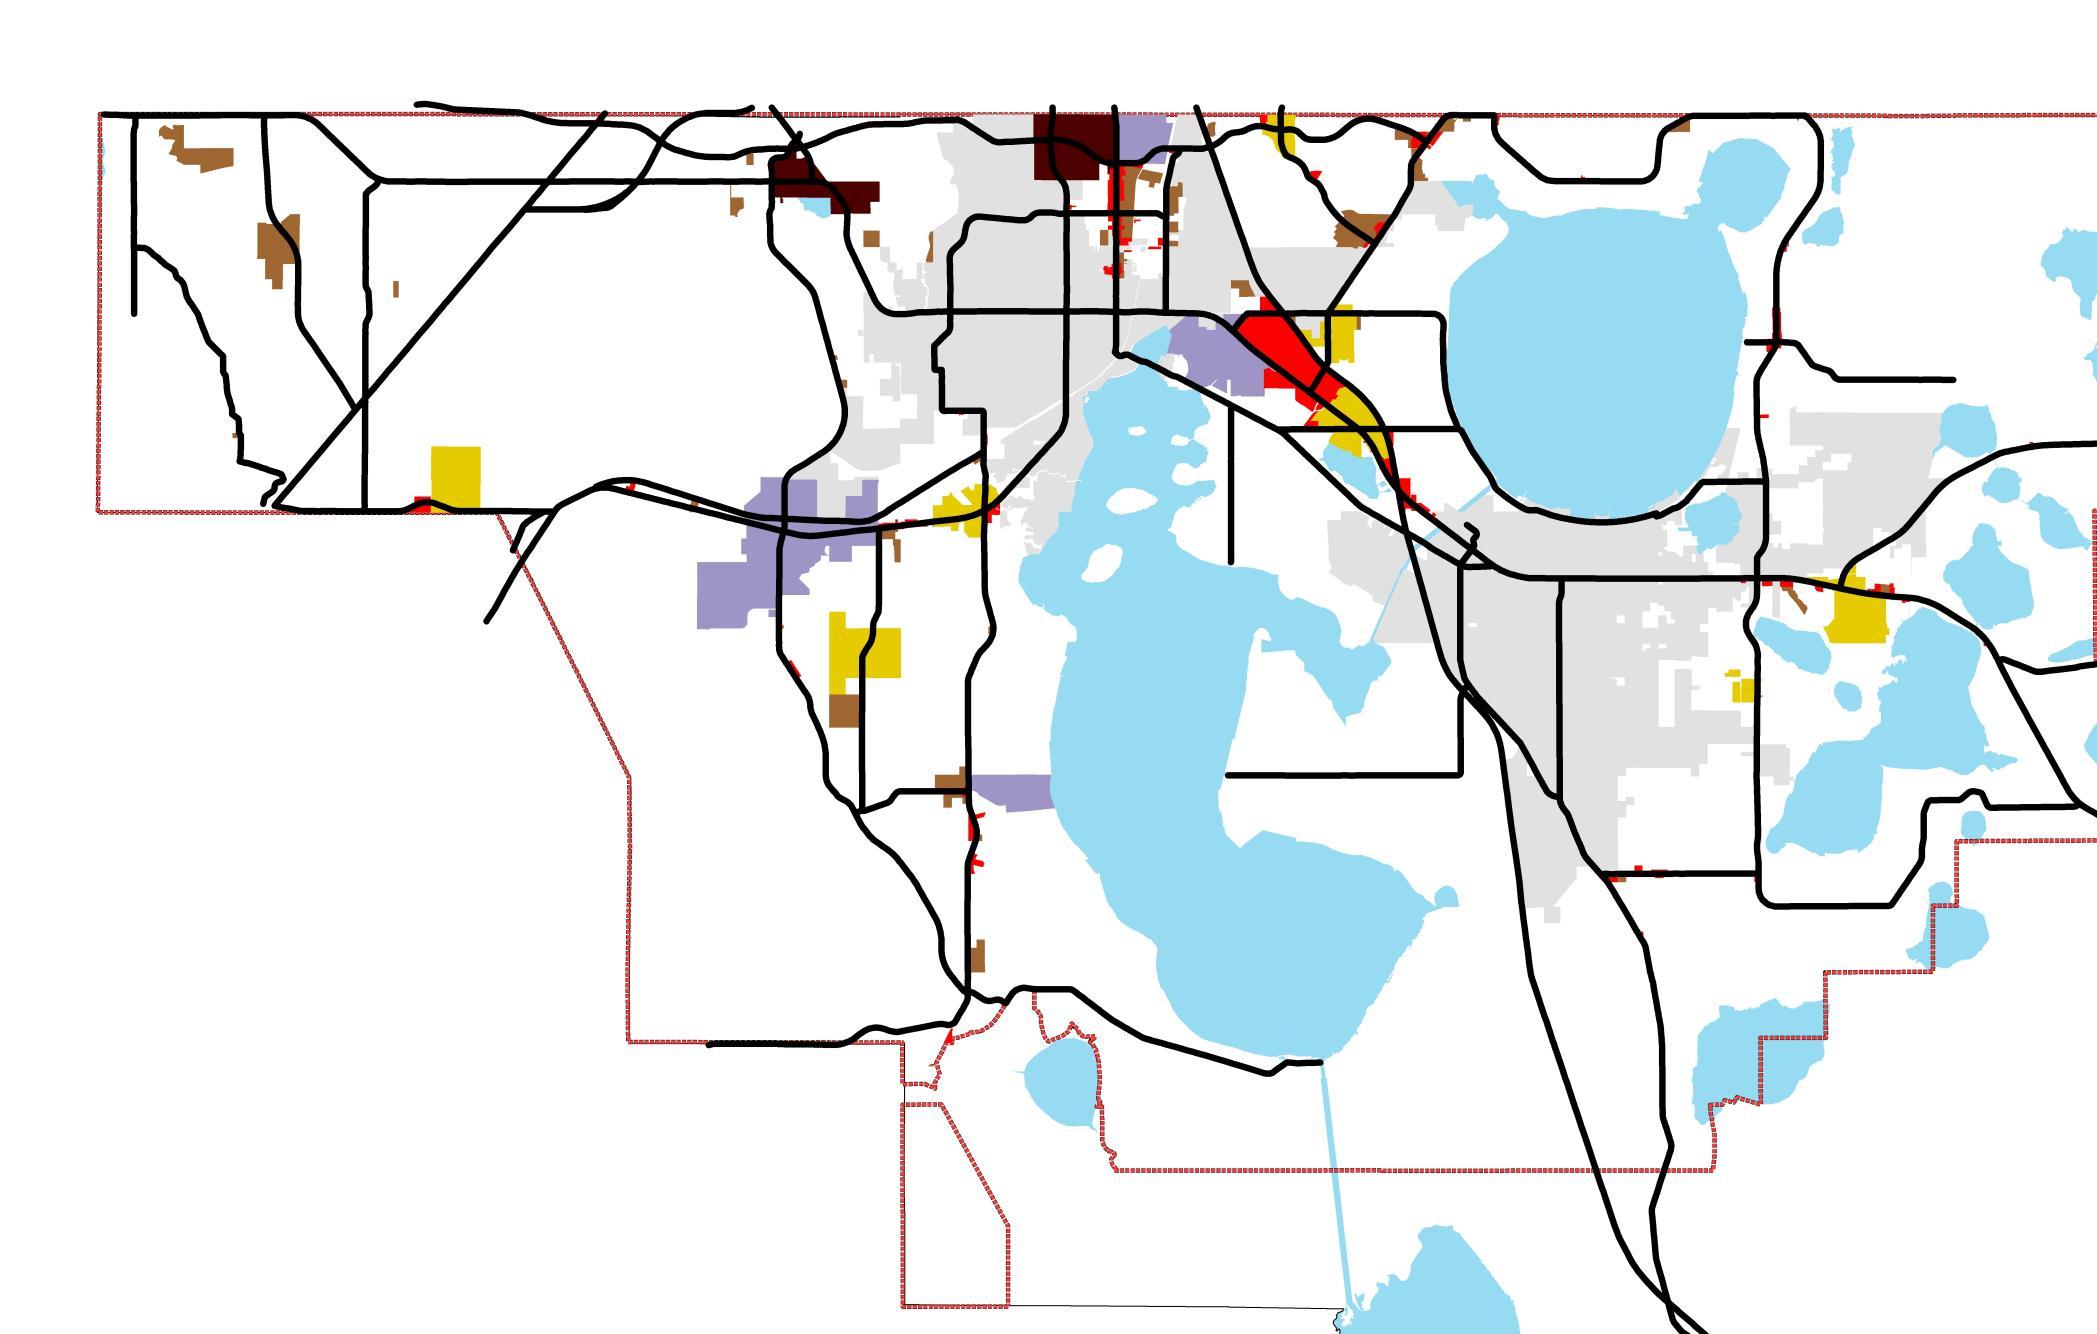
And from a fiscal perspective: Osceola County maintains about 2,000 miles of road. The question is, is that money well spent? How much of that road makes up an effective network?
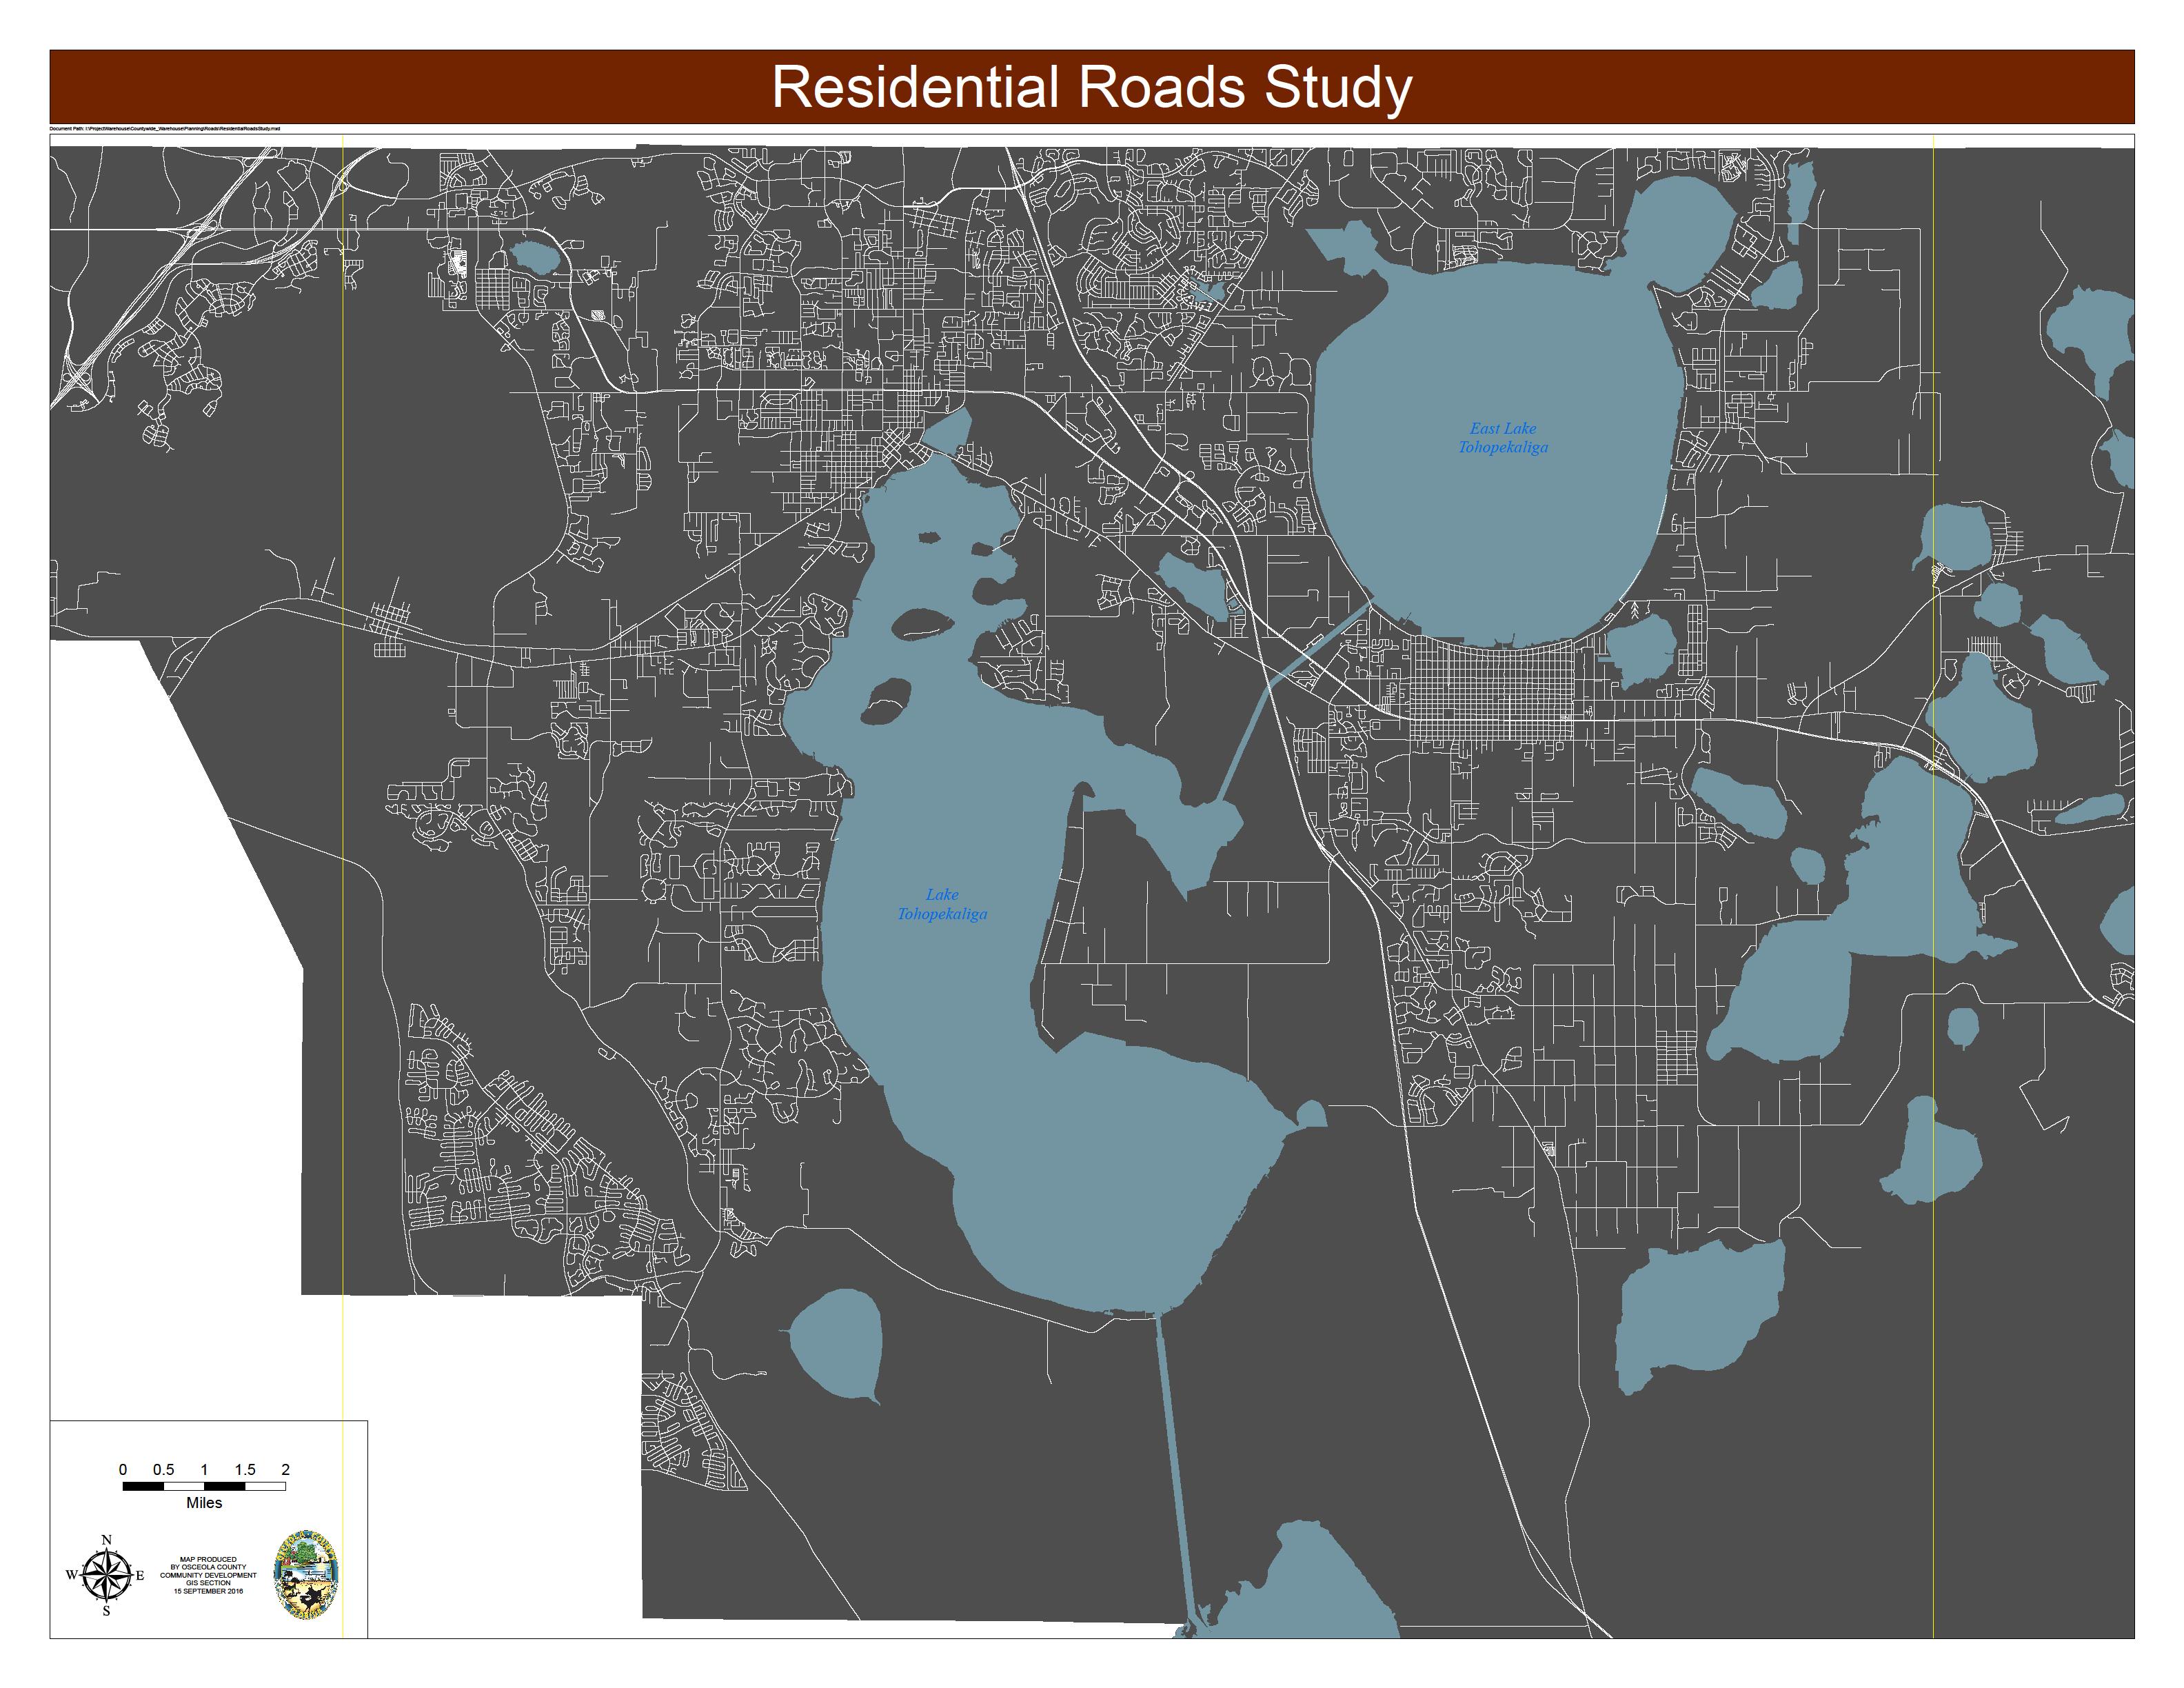

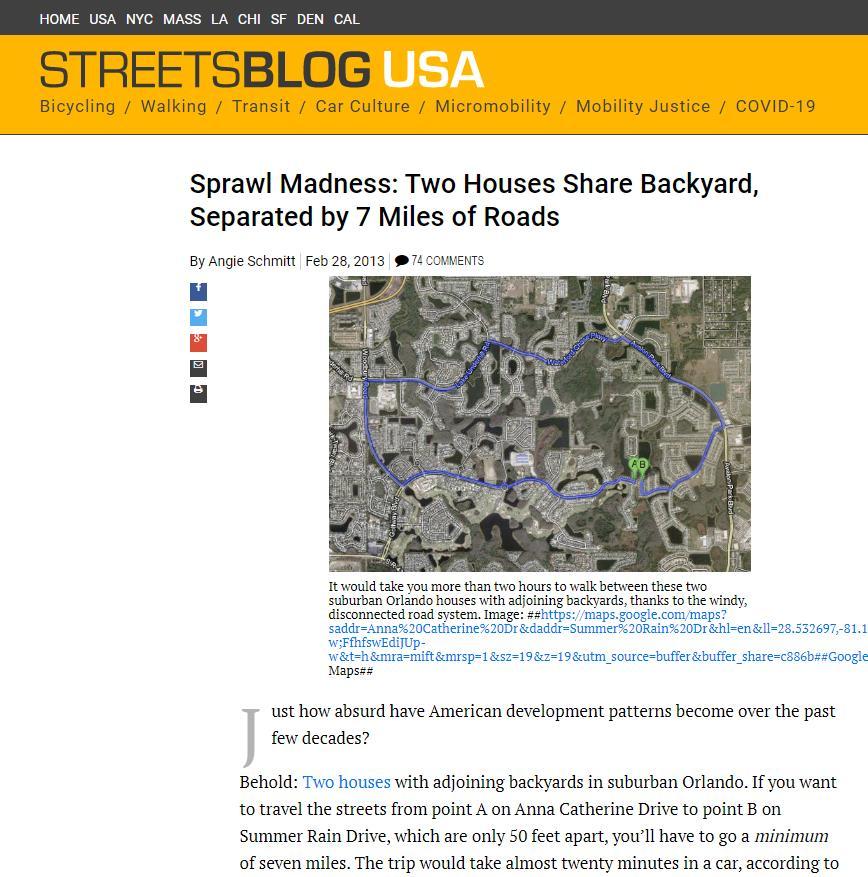
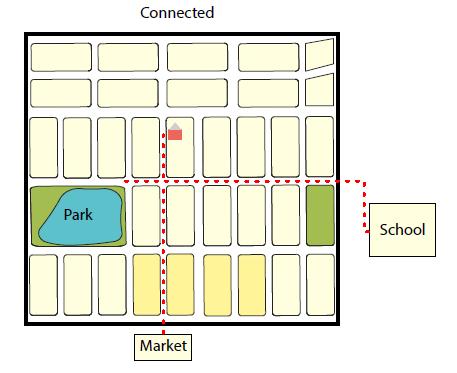
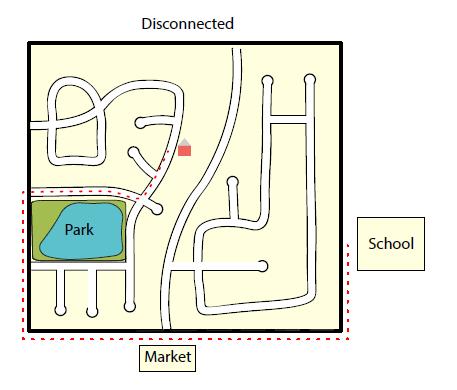
If we gray out any road that performs only one function –getting people to their homes – this is what’s left.
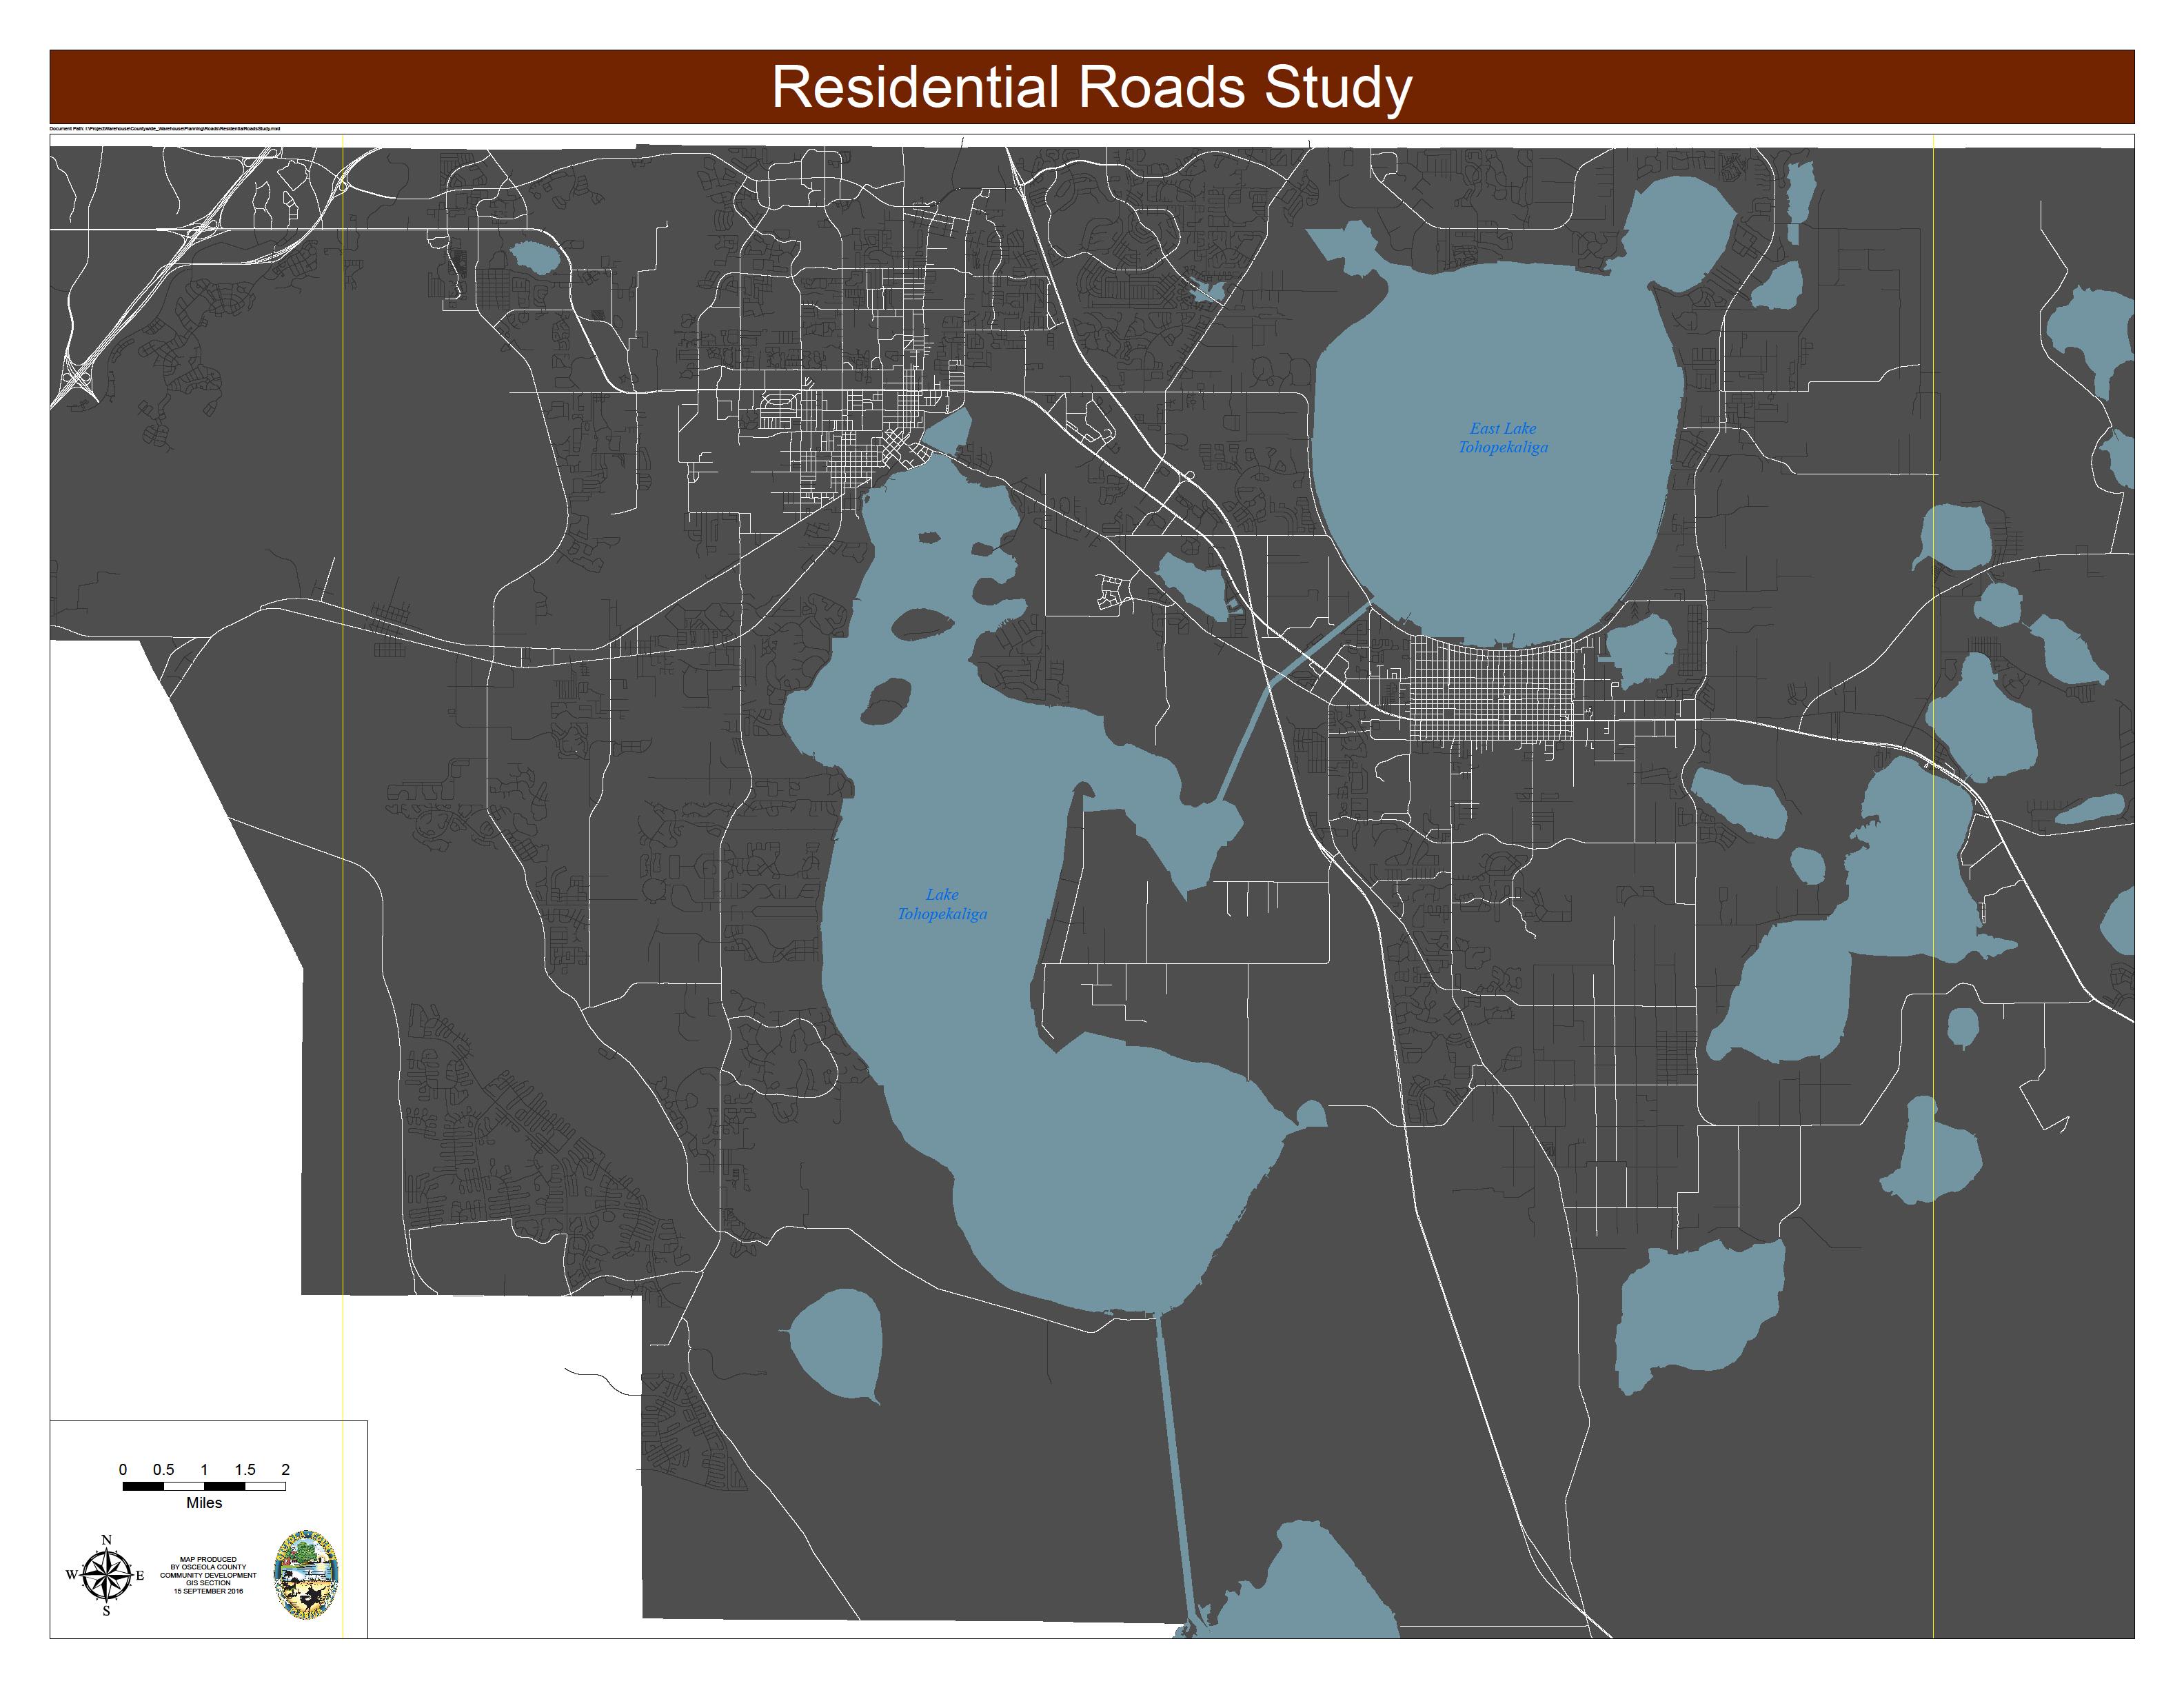
This network:


• Funnels people to only a few roads, resulting in congestion
• Makes getting around without a car difficult or impossible

In Pine Hills, between 1990 and 2000:
• Labor force-age population grew by 11%
• Percent of population actually in the work force grew by 1%
• Percent of workers commuting more than 90 minutes to work grew by approximately 700%
• Vehicle availability (the total number of vehicles to Pine Hills households) decreased during this period, but at the same time...
• Several of the roads were widened to 6-lane (for people west of Pine Hills to commute to downtown)
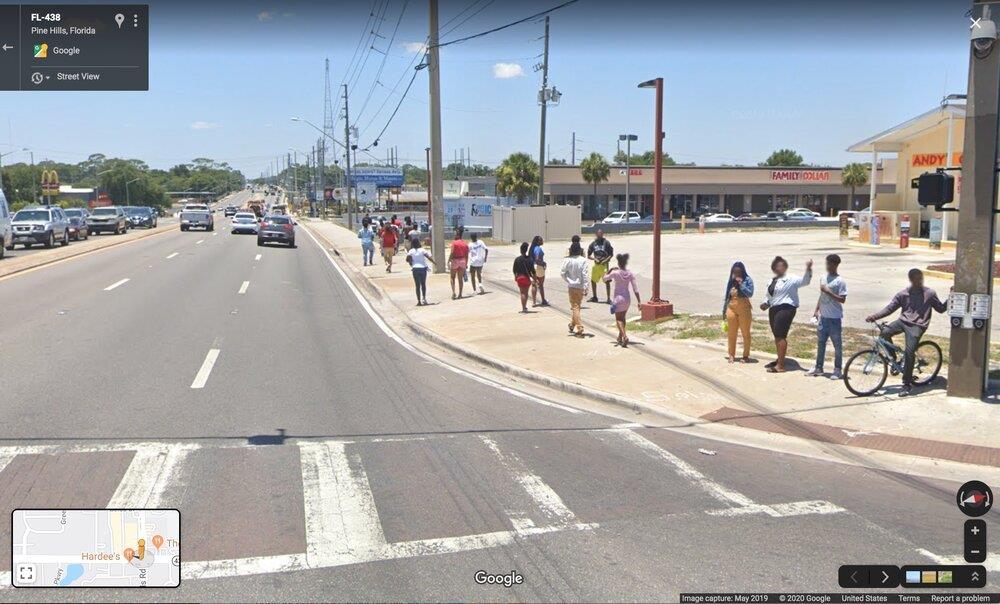
• Older areas decline – jobs move out – households don’t build wealth – fewer households have cars commuting by transit or walking to jobs located farther away but roads around them get widened. Safety and quality of life suffer, cycle continues

This is Evans High School in Pine Hills at the end of the school day. Children walking in an unsafe and inhospitable environment. (Other images available in the article or on Google Maps)

This is a scary trend, because the suburbs are not set up to handle poverty
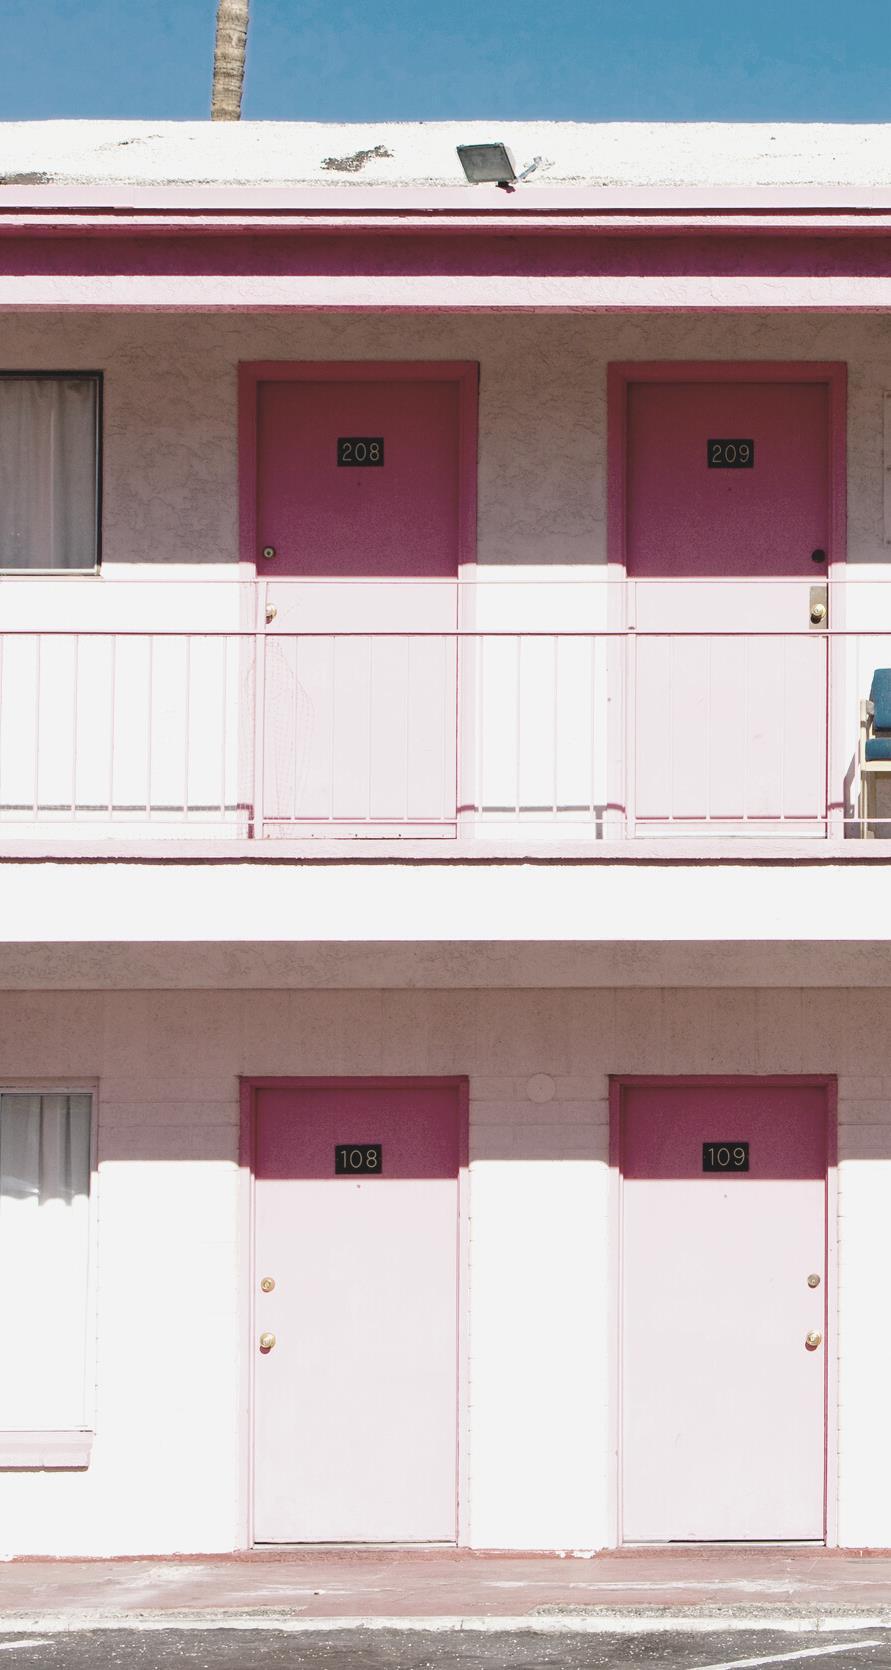
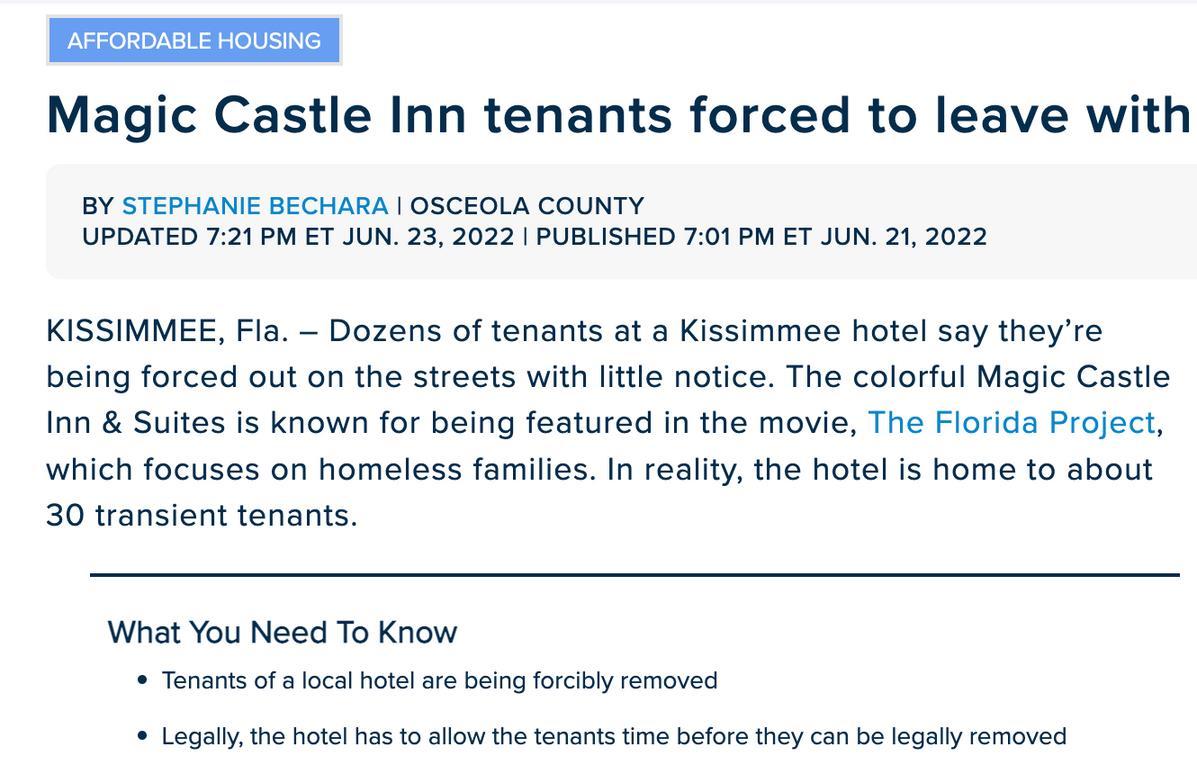
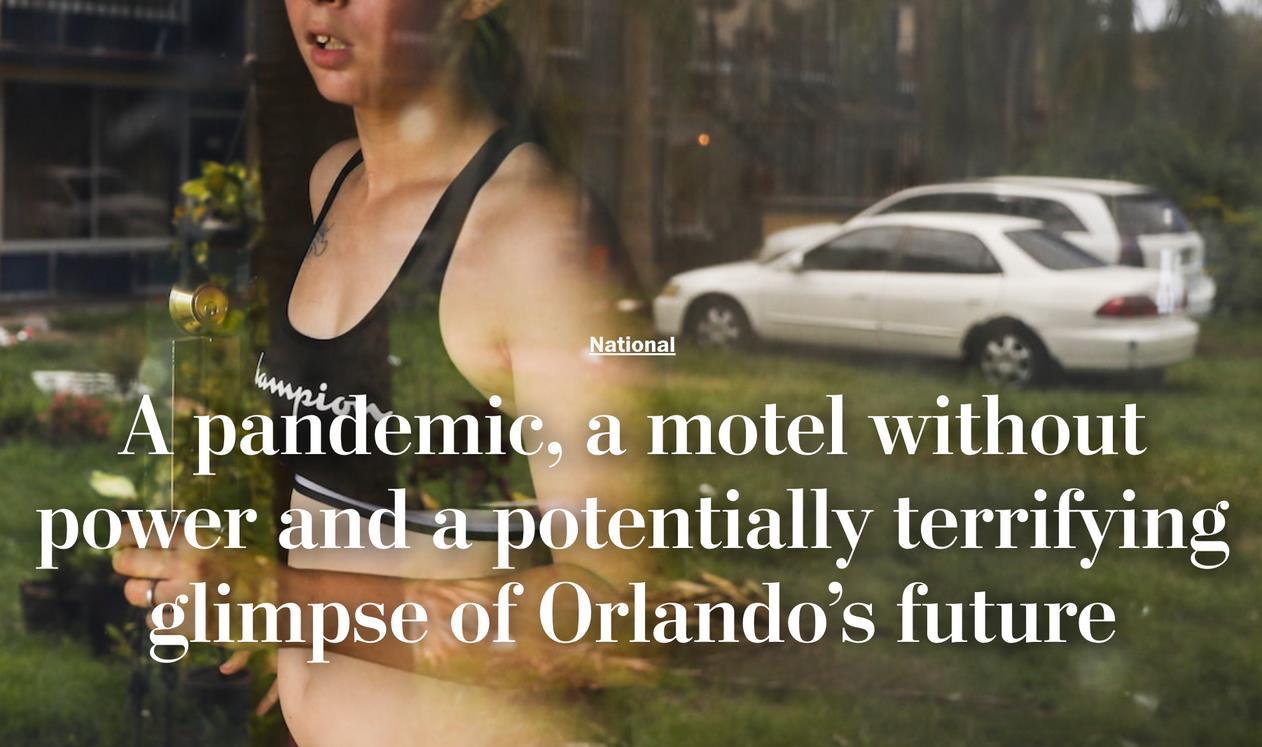
a low-income person living in this motel
you can get to
tourist
without


plan for and build


Young, single… Rental, small unit ok
In college… Rental, near school and part-time jobs, roommates or small unit
Working… Can afford more housing as wages increase – rental or first time homeownership
Married… Multiple incomes, move to first-time homeownership
Children… Larger home, school location is a consideration

Move up… Depending on circumstances (income, school, job changes) move to larger home
Empty nest (young old)… Children move out, parents may want to downsize
Old old… Loss of spouse, back to 1-person household, may need assistance with daily activity
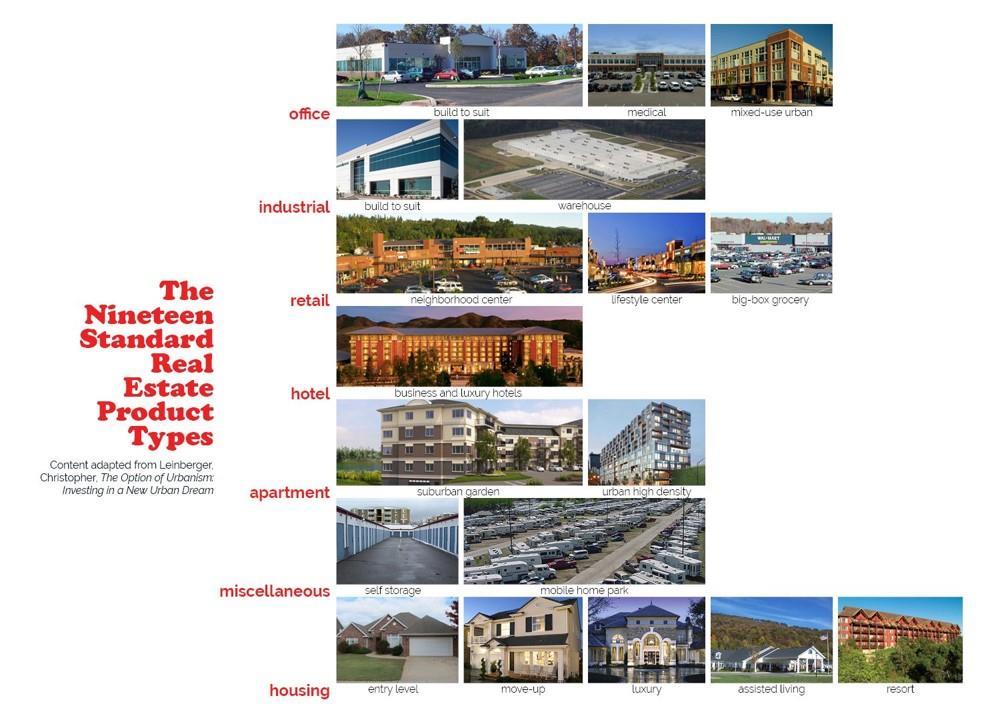
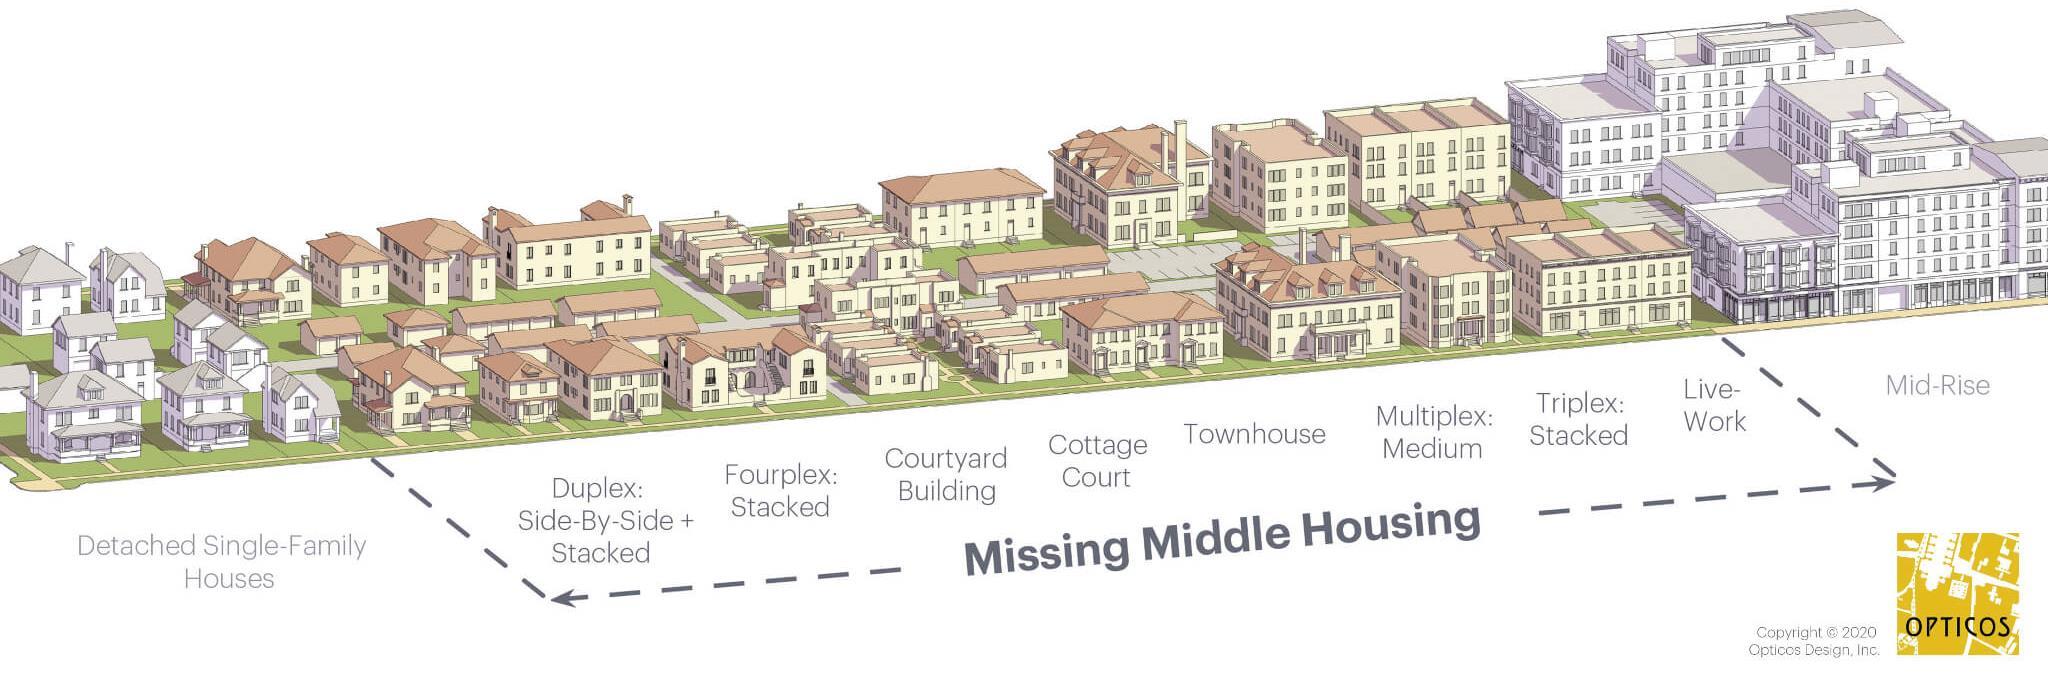
This is a continuum representing housing products and services, from homelessness all the way to market rate housing. Relative to the life span continuum at left: in an ideal world, all of the housing needs for the typical life span would be met in the last two market rate types, but they’re not.

This is just the continuum of a normal life span –housing needs differ throughout out lives. But without a continuum of housing types, we’re trying to fit people with vastly different needs into a few products at a few price points. That’s where missing middle comes in.


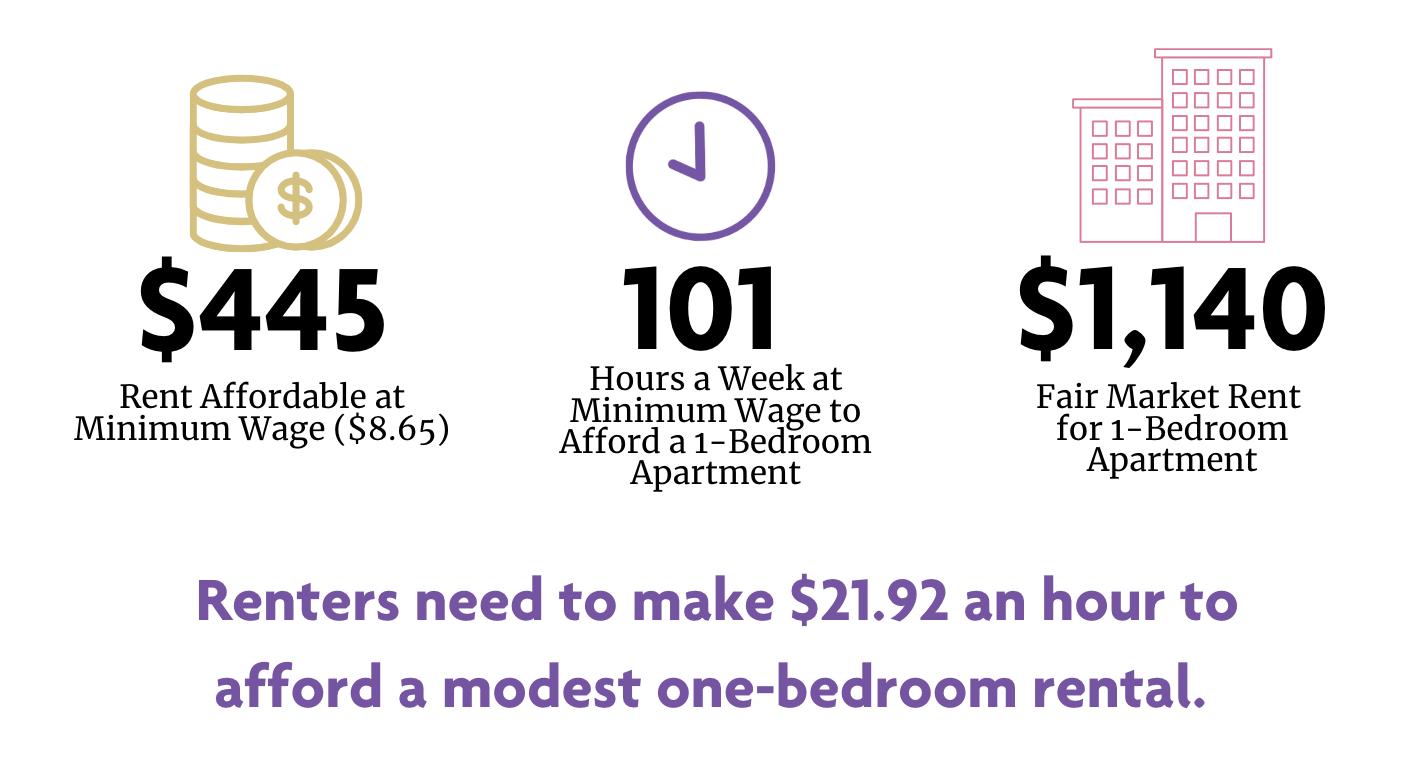


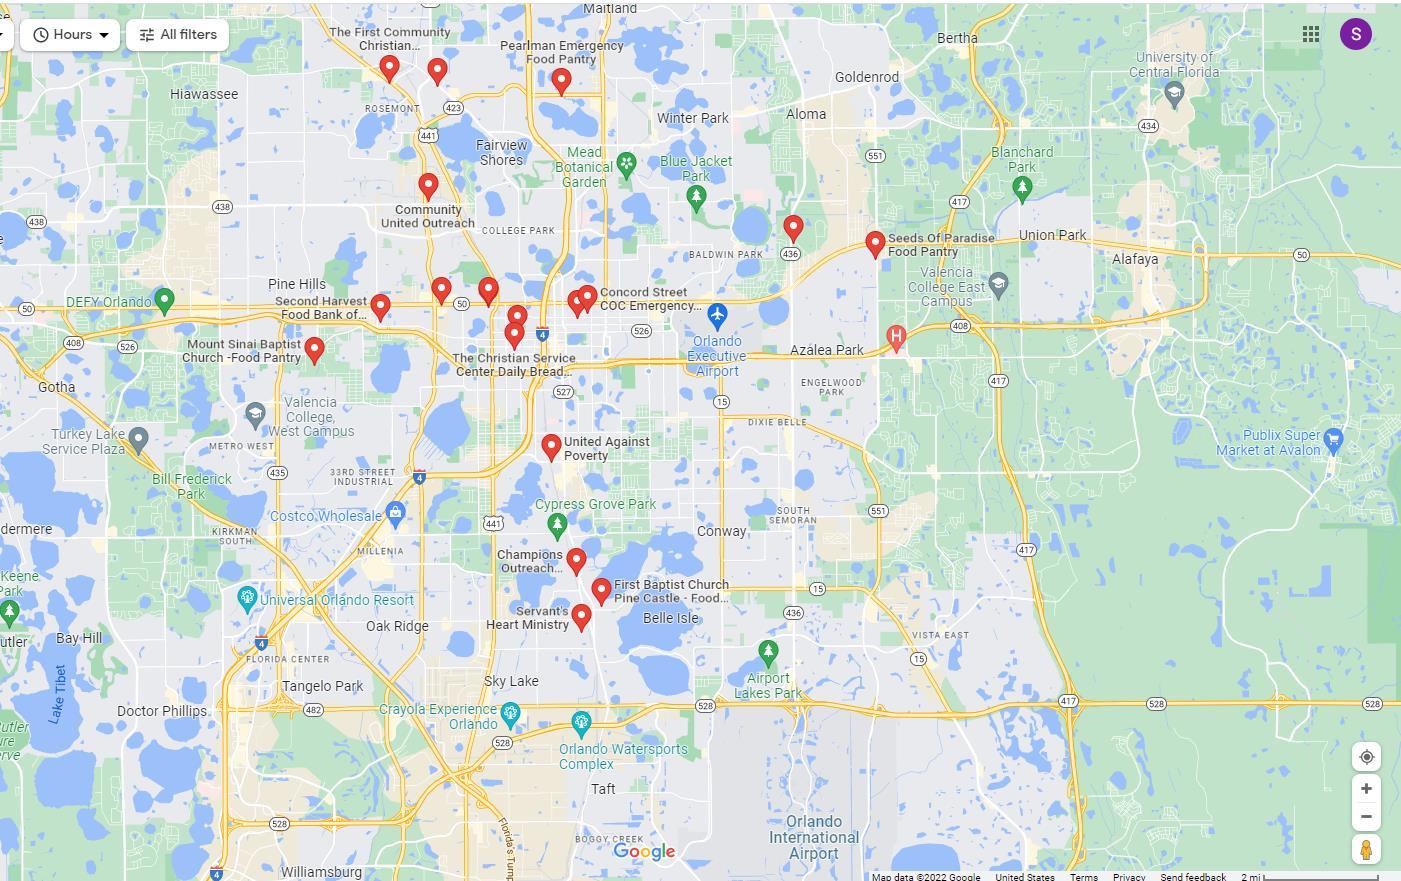
There are 60,733 extremely low-income renters in Central Florida and only 11,200 available and attainable housing units. What about the remaining renters? These families end up paying more than 50% of their income on rent, or they resort to living in situations that aren’t stable, such as hotels, motels, or doubled up with other families.

94% of extremely low-income households are cost-burdened and there are only 18 units of housing per 100 units available
91% of extremely low-income households are cost-burdened and there are only 25 units of housing per 100 units available


Families living in hotels, motels, doubled up or spending more than half their income on rent
EMPOWERING NEIGHBORS. STRENGTHENING COMMUNITIES. BUILDING HOPE. www.thehopepartnership.org


<$21,240
$21,240-$35,400









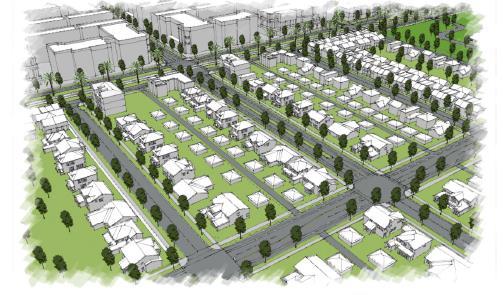
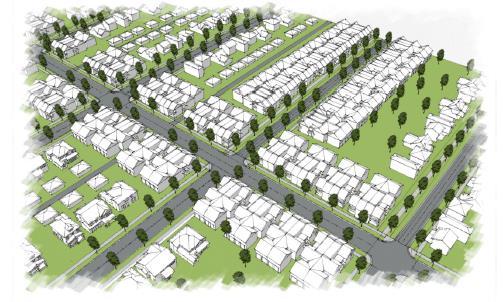
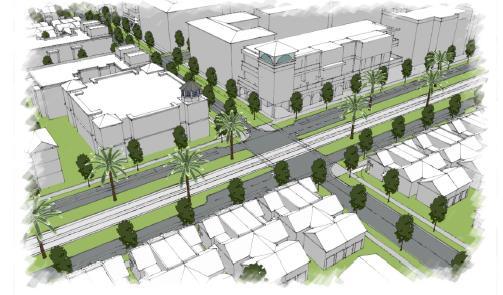





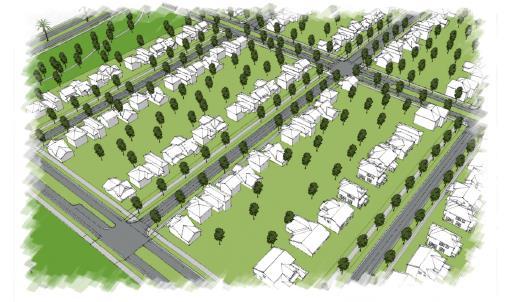 Single Family with Mansion Homes Single Family with Mansion Homes
Single Family with Mansion Homes Single Family with Mansion Homes
Single Family with Mansion Homes Single Family with Mansion Homes
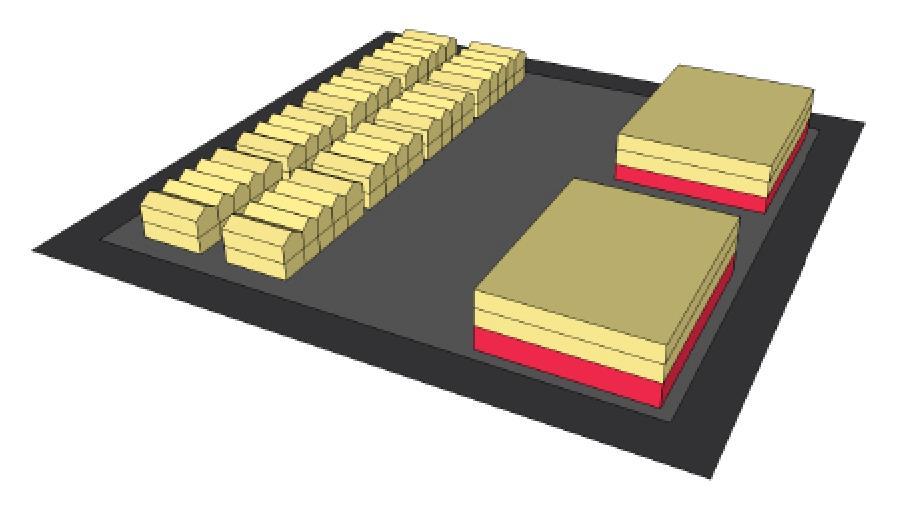
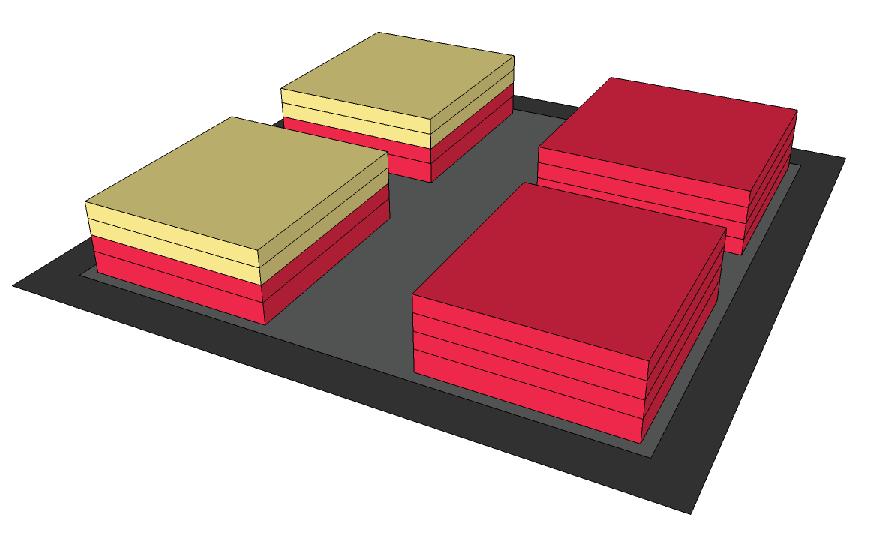
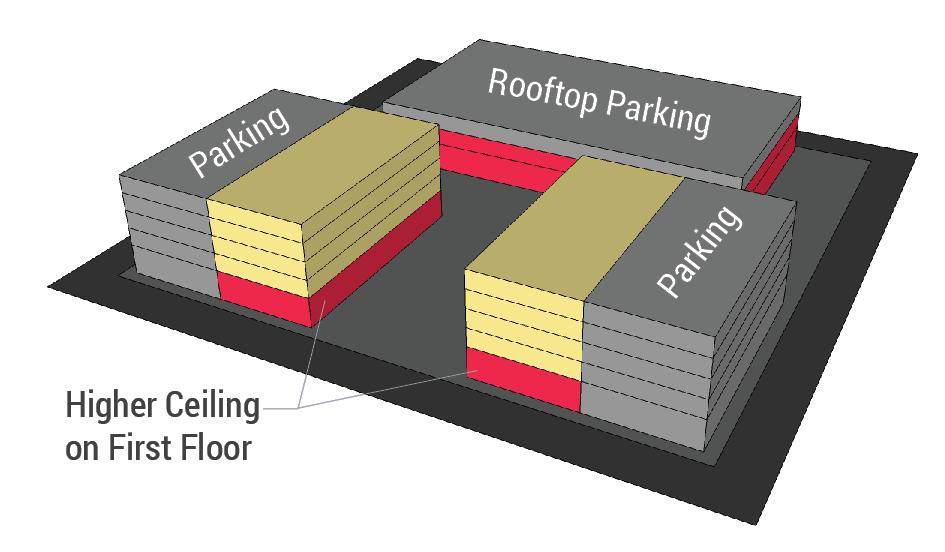




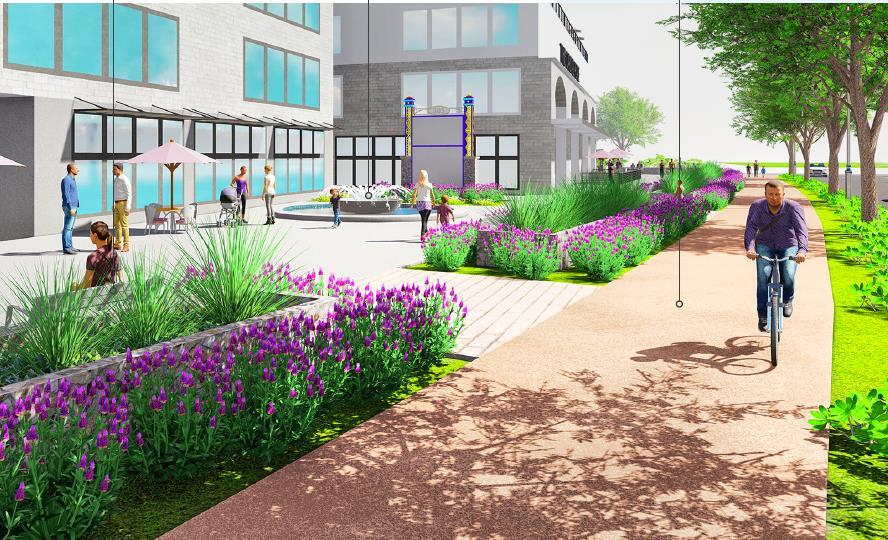

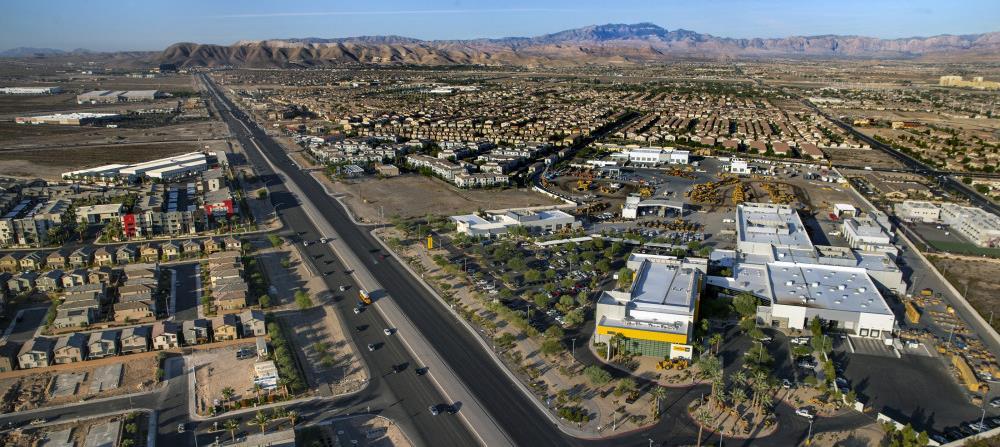

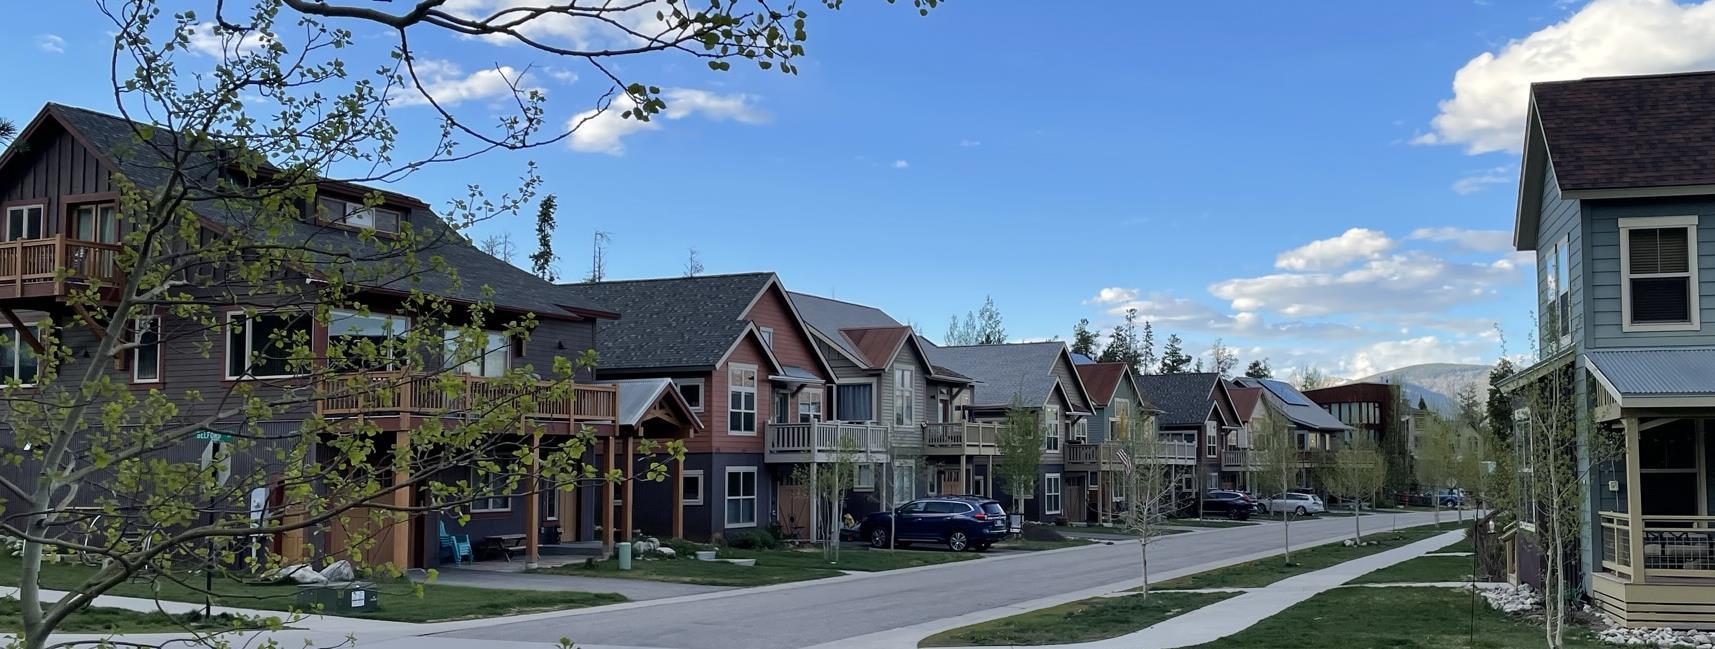


There’s a huge role for planning in sustainability.
There’s also a huge challenge.
