
THE JOURNEY IN PLANNING TAMPA’S NEXT 30 YEARS OF MOBILITY

Meet Your Presenters!
Brandie Miklus, AICP


Infrastructure and Mobility Program Coordinator at the City of Tampa


Riva Heinrich, AICP Planner at Kittelson & Associates

Anthea Fernandes Transportation Analyst Kittelson & Associates

Alana Brasier, AICP* Chief Transportation Planner City of Tampa


Haitao Yu, PhD, AICP Transportation Planner Kittelson & Associates


The Rest (and Best) of the Team
Danni Jorgenson, P.E., AICP Transportation Engineering Manager City of Tampa
Kelly Fearon, P.E. Vision Zero Engineer City of Tampa
Jady Chen Transportation Analyst Kittelson & Associates
*Project Managers


Jennifer Musselman, P.E.* Associate Engineer/Planner Kittelson & Associates


1. The Story of Tampa’s Mobility Plan 2. Public Outreach & Prioritizing Community in Uncertain Times 3. Including Communities through Data 4. The Story of Tampa’s Mobility Future What to Expect


THE STORY OF TAMPA’S MOBILITY PLAN

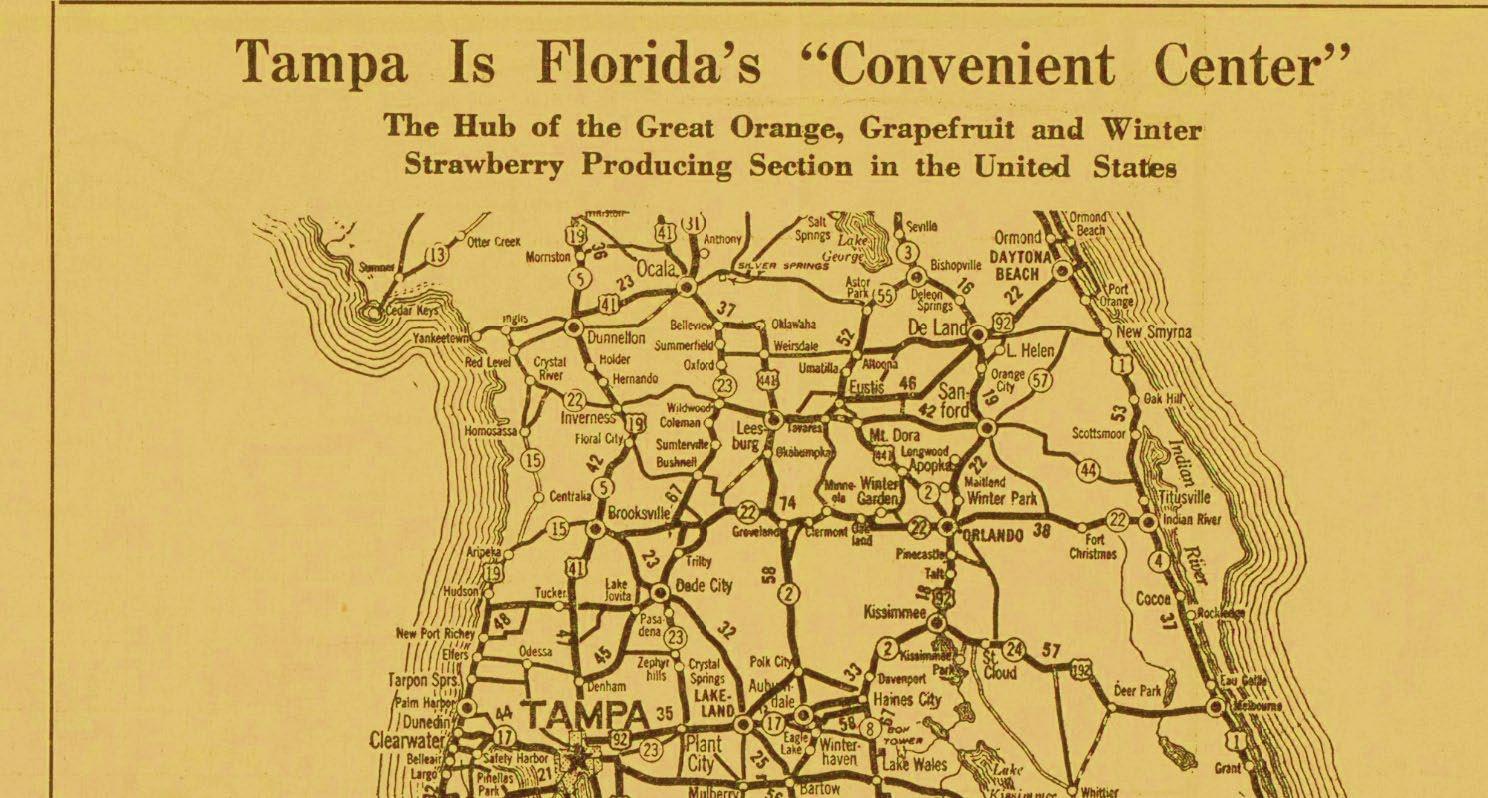
Tampa1936 Chamber of Commerce Map

Investigating the Past to Inform the Future
Investigating the Past to Inform the Future The City has historically been a hub for… …Citrus and produce logistics …an anchor port with links to Henry Plant’s Railroad and access to the Gulf of Mexico …phosphate mining …successful professional sports franchises


19821927
Investigating the Past to Inform the Future


Investigating the Past to Inform the Future

What did we learn? …Tampa has changed and will continue to change ….the future of the City’s mobility will be shaped by its Investigatingpast the Past to Inform the Future 100bridge,Sameyearsapart Same trolley line, 5 years apart!


Adopt Vision Zero as a Citywide policy Codify a Citywide Mobility Plan (Tampa MOVES) The New Administration… ActionVisionViewtheZeroPlanHere


Developing Guiding Principles

Connect people to jobs and economic opportunities.
MOBILITY FOR ALL
Remove barriers and improve transportation for people who need it most
OPPORTUNITY
M.O.V.E.S.PrinciplesGuiding
Be visionary and dream big! Create a healthy, sustainable, and resilient future.
PUBLIC SAFETY
Everyone should have access to quality transportation choices.
What is Tampa MOVES?
VISION
EQUITY
Safety is our first priority. One death or injury on our streets is one too many.
What is Tampa MOVES? Effectively engages the community to create a clear vision for mobility in the City Outlines objectivestransportation and initiatives for the next 30 years Set standards and priorities for all modes of travel tailored to the City’s unique street and area types


15 Acknowledge the evolution of our transportation system Improve safety for all users On average, 44 people die on streets in the City every year Another 289+ are seriously injured Increase mobility options Tampa is the 20th most congested City in the U.S. Transportation accounts for 18% of household expenses, higher than the national average 77.6% travel alone in their own car, spending an average of 28 minutes driving to work Improve communication with the community on when and why certain projects move forward Proactively identify projects that help the City meet its mobility goals Why form a Mobility Plan?

PUBLIC

OUTREACH & PRIORITIZING COMMUNITY IN UNCERTAIN TIMES
The Onslaught “Unprecedentedof Times” 20202019 DevelopmentPlanBegins OutreachPublic 2021 2022


Virtual “Listen First” Meetings Listen to community ideas prior makingdevelopingtoplans,decisions, and building projects Use input to develop a plan for Tampa’s future that brings to life the vision of all of neighborhoodsTampa’s 10th Listen First Meeting provided in Spanish

10 virtual Listen First meetings (2021) What We Heard Safe walkablestreets,areas, and transit options are what envisionparticipantsfortheCity Residents increasedgrowthconcernedareaboutandtraffic


What We Heard


Who did we miss by going virtual? Residents with limited internet and phone access Residents who speak languages other than English or Spanish Residents experiencing virtual meeting fatigue
Including Communities through Data
Including Engaging

The Planning Process
PrioritizationLocationProjectPrioritizationType
X
Pavement condition X 2: Good 4: Satisfactory 6: Fair 8: Poor/Very poor 10: Serious/Failed
parks X X X
2: Within ¼-mile of high frequency route 4: 1 2 high frequency routes 8: 3 8 high frequency routes 10: > 8 high frequency routes
TOD
Health Risk Cases per 1,000 Persons X X
3: 1 4,000 People 7: 4,000 8,000 People 10: 8,000+ People
Measures MobilityforAll Opportunity Vision Equity Safety
X X X
High Injury Network X 3: Tier 1 7: Tier 2 10: Tier 3
X X
CRA X X 2.5: 1 measure 5: 2 measures 7.5: 3 measures 10: 4 measures X X
X X
X X
Location Scoring
X
libraries X X X
Proximity
Threshold scores (out of 10)
3: 0 0.8 per 1,000 pop 7: 0.8 1 per 1,000 pop 10: >1 per 1,000 pop
Number of Communities of Concern Benefitted X 3: 1-2 7: 3 4 10: > 4
Underutilized parcels
Transit Frequency/PriorityCorridors X
Number of ConnectedNeighborhoods X 3: 1 7: 2 3 10: >3
Number of Jobs with ½ Mile X X 3: 1 8,000 Jobs 7: 8,000 16,000 Jobs 10: 16,000+ Jobs
Proximity to
Proximity to schools 2.5: 1 2 5: 3 5 7.5: 6 7 10: >=8 to
Number of People with ½ Mile X X
Approved land use change
Equity Resources in Planning
Hillsborough TPO Communities of Concern

Populations greater than one standard deviation above countywide average of two or more of the following:
Youth (18 years or younger)
Low household income
Majority non white
Elderly (65 years or older) Limited English Proficiency Disability Car less
Who is Most Impacted
52% of deadly and life-altering injury crashes occurred within communities of concern…


X X X X 2.5:
MobilityforAll Opportunity Vision Equity Safety
X X
7.5:
Project uses proven speed management techniques to help achieve a desire target speed. X X 1 2 speed management treatments 3+ speed management treatments
X
X X X X X 2.5:
Project adds new or wider sidewalk. X X Widen or repair sidewalk Fill sidewalk gap
Project increases the frequency of safe crossings X X X Crossing maintenance Crossing upgrade (e.g. add RRFB, refuge) New protected crossing
2.5:
10:
Project reduces vehicle delay without additional through lane capacity. Capacity improvements that add pavement (new turn lanes) Capacity improvements that don't add pavement (signal retiming)
Project includes additive landscape, shade, streetscape beautification, or public art 1 2 treatments 2+ treatments
5:
10:
10:
Project increases transit service reliability Transit infrastructure maintenance (e.g., stop maintenance) Service improvement (e.g., frequency increase, rerouting, etc.) New transit infrastructure (e.g., BAT lanes, TSP, queue jump lanes)
X 5:
X 5:
Measures
5:
X X 5:
Project reduces bicyclist level of traffic stress Bicycle facilities maintenance Bicycle intersection/spot improvements New LTS 2 facility New LTS 1 facility
10:
5:
Threshold scores (out of 10)
X
Project reduces/mitigates stormwater impacts of surface transportation. Existing infrastructure maintenance Reduce impervious surface and/or increase landscaping
5:
10:
10:
10:
5:
Project Scoring
X X X
10:
The Result PriorityHigherScorePriorityLowerScore

Reactionary vs. Proactive Planning
DRAFT PrioritizationSidewalkTool DRAFT FromSidewalkPrioritizationSidewalkToolRequestsPublic


The Result

The Story of Tampa’s Mobility Future
Our Next Steps Project Formulation through… Identifying mode-level gaps in Tampa’s network Unifying land use and transportation planning through contextbased solutions Using prioritization methodology to inform implementation


Want to Know More? Project webpage www.tpamoves.org

THANK YOU!
