
presented to CornResiliencyHole Targeting Enhancements Florida Planning Conference September 8, 2022

2 TodayOverview – Trends and FDOTPracticesResiliency and Resilience Action HeartlandPlanRegional Resiliency Q&ACoalitionand Discussion

3 National Disasters 2021 BillionRecordDollar Disasters 1980–2021 annual average is 7.7 events 2017-2021 annual average is 17.8 events
Source: NOAA, Climate.gov http://www.ncdc.noaa.gov/billions

4 Disasters Affecting Florida 1980 – 2022* Billion Dollar Disasters 1980–2022 annual average is 1.7 events 2017-2022 annual average is 3.5 events Source: NOAA, Climate.gov http://www.ncdc.noaa.gov/billions Disaster Type Events Total Costs Percent of Total Costs Drought 7 $1-$2B 1% Flooding 2 $1-$2B 1% Freeze 5 $10-$20B 5% Severe Storm 21 $2-$5B 2% Tropical Cyclone 29 $200-$230B 91% Wildfire 4 $250M-$500M 0% Winter Storm 5 $2-$5B 1% All 73 $200-$260B 100% * As of July 11, 2022
Resilience5 Practice Trends for Transportation Policy / Emphasis Area Corridor/Project Evaluations Strategy VulnerabilityToolboxesAssessmentsRiskAnalysesImprovementPlansResearch
Resilience6 Practice Trends for Transportation » Beyond Infrastructure • Community • Equity » Mitigation and Adaptation » Performance Metrics » Process Integration » Asset Management » Prioritization and Funding
7 Contact Info Karen Kiselewski, AICP kkiselewski@camsys.comCambridgePrincipalSystematics561-901-2106

Jennifer Z. Carver, AICP

presented to presented by
September 8, 2022
ACTIONRESILIENCEPLAN Florida ConferencePlanning
Statewide Community Planning
OfficeCoordinatorofPolicy Planning

RESILIENCY POLICY Ability to adapt to changing conditions and prepare for, withstand, and recover from disruption Identify risks, particularly related to: Storms Flooding Sea level rise Assess potential impacts Employ strategies to avoid, mitigate, or eliminate impacts PREPAREADAPT WITHSTANDRECOVER OFPRINCIPLESRESILIENCY


COLLABORATION INTEGRATION OF TOOLS PROCESSESWITH 10
FDOT ACTIONS
PRACTICES TOOLS RESEARCH
INHERENT RESILIENCY Traffic signals Pavement markings Roundabouts High mast lighting Materials 11

INHERENT RESILIENCY designStormwater/drainageprocedures Nature - based solutions Context completesensitive,streets Local coordinationpartner 12


Drainage Manual Includes a section ConsiderationsResiliencyon multipleIdentify ways we resilientinherentlyarein our designsdrainage PD&E Manual guidanceProvide on requirementstatutory to perform Sea Level ZoneCoastalStudyProjectionImpact(SLIP)ifwithinBuilding MANUAL UPDATES 13


Promoting Resilient Operations for Transformative, Efficient, and Cost - Saving Transportation (PROTECT) Program Approximately $70 million a year Nuisance flooding and other priorities Discretionary grants (NOFO upcoming) ADDITIONAL BACKGROUND - FEDERAL 14
BACKGROUNDADDITIONALSTATE Peril of Flood Sea Level Impact Projection (SLIP) Studies Resilient Florida Florida’s Chief Resilience Officer Florida Flood Hub Resilience Action Plan (RAP) 15

RESILIENCE ACTION PLAN (RAP) GOALS Recommend strategies to enhance infrastructure and operational resilience Recommend design changes for existing and new facilities Enhance partnerships to address multijurisdictional resilience needs 16
RESILIENCE ACTION PLAN (RAP) ELEMENTS Historic/Current Issues Nuisance flooding FDOT Policies and Procedures Resiliency capability maturity framework assessment Vulnerability assessment of SHS Sketch Planning Tool SIS Resiliency Study Alternatives to retrofit existing infrastructures and systems Best/Current practices USACE South Atlantic Coastal Study Database of vulnerable assets ARCGIS portal 17
18 RESILIENCY CAPABILITY MATURITY ASSESSMENT Document Implement&ActionsIdentify DesiredIdentifyPERFORMEDCurrentAssessMANAGED INTEGRATEDOPTIMIZED PEOPLEDIMENSIONSPROCESS TOOLS


19 RESILIENCY CAPABILITY MATURITY ASSESSMENT Awareness (101) training Best practices & area - specific training Collaboration & data sharing/ enhancement Coordinate to integrate resiliency in programming & production Cross - disciplinary working group to establish roles & responsibilities
20
What are some resilience activities happening in your area? does transportation fit into them?
How
Collaboration with Partners and SpringStakeholdersPublic Comment period FDOT Resilience https://www.fdot.gov/planning/policy/resilience/default.shtmWebsite 21 NEXT STEPS


GRANTSESSIONSINFORMATION Register Here!


It’s Hurricane.....Season....... Know Your Zone, Know Your Home! For more information, please contact: 850-414-4820 23 Jennifer Carver, FDOT Office of Policy Planning Jennifer.carver@dot.state.fl.us


RegionalHeartlandResiliencyCoalition


MPA,Codo-Salisbury,AICP Deputy Director Central Florida Regional Planning Council
Central Florida Regional Planning Council

Jennifer


Source: Shannon McPherson, CFRPC
Source: Fox 13 News – Paul Dellegatto
12’ of Flooding – September 2022 Wilson Avenue - Bartow, Florida


Source: 1000 Friends of Florida Where Will Our Future Take Us? landConservedlandDeveloped 20602005


Heartland Region Population Growth 2010 2021 % (2010Change-2021) DeSoto 34,862 34,031 -2.38% Glades 12,884 12,130 -5.85% Hardee 27,731 25,269 -8.88% Hendry 39,140 40,540 3.58% Highlands 98,786 102,065 3.32% Okeechobee 39,996 39,148 -2.12% Polk 602,095 748,365 24.29% Heartland Region 855,494 1,001,548 17.07%
Click to edit Master title style Our Heartland Core Values have guided all our work supporting consensus building, development of plans and programs, support of existing and new initiatives, and continuing conversations.


Interconnected & Interdependent with Shared Vulnerabilities 7 counties 28 cities 2 water management districts Peace River Basin Kissimmee River Basin Lake Okeechobee Headwaters of the Everglades


EnvironmentAgriculturePopulationEconomyEducation&Natural Systems CommunityTransportationEnergySustainability

Click to edit Master title styleResiliency Focused Collaboration Heartland Resiliency Coalition …the Impacts to: • Infrastructure • Agriculture • Essential Buildings • Housing • Community Assets • Military Installations Natural Disaster Threats ExtremeWindFloodingdamageweather
Climate Impacts & Vulnerabilities
● Inland Flooding ● Inland Migration ● Habitat Changes and Loss ● Plants and Crops ● Critical Infrastructure & Facilities ● Water Quality ● Economies 34


Flooding in Central Florida County floodplainiPropertiesn100-year % of all properties infloodplain100-year floodOverallrisk DeSoto 2,817 14% Moderate Glades 2,291 20% Moderate Hardee 1,188 8% Minor Hendry 13,763 39% Major Highlands 10,271 9% Moderate Okeechobee 6,107 19% Moderate Polk 38,695 11% Minor *Data from FloodFactor As the only regional planning council with no coastline, the flood challenges in Central Florida are unique and different from coastal communities *Data from University of Florida Economic Impact Analysis Program: Economic Losses of Hurricane Irma on Agriculture in Florida Counties Source: American Flood Coalition


Environmental Avoidance and Mitigation

Potential toduePopulationHumanShiftsSeaLevelRise

Uniting Central and Southwest Florida to Protect Water and Wildlife


CLIMATE CHANGE IN INLAND COMMUNITIES Extreme temperatures Wildfires Plant changes • Increased frequency and severity of storms Increased flooding and wind damage Increased evapotranspiration rates Lower groundwater levels Habitat migration Uniting Central and Southwest Florida to Protect Water and Wildlife NOAA


• Evapotranspiration expected to increase 7%, decreasing wetland levels and hydroperiods

Uniting Central and Southwest Florida to Protect Water and Wildlife
• Rainfall changes uncertain with precipitation amounts fluctuate 10% above and below normal averages
• If there is a decrease in effective precipitation, it could result in a decrease of ground water levels – affecting both natural systems, public groundwater supplies and wildfires


INLAND IMPACTS OF CLIMATE CHANGE
• Sea level rise is not the climate stressor inland but increased temperatures and evapotranspiration is anticipated to have significant hydrological impacts inland
Different levels of risk of transitioning from one type to another:


Uniting Central and Southwest Florida to Protect Water and Wildlife
Low Risk: approximate same wetness for current habitat type
PLANT & CROP IMPACTS FROM CLIMATE CHANGE
Medium Risk: between the mean and a standard deviation below the mean wetness to support the current habitat type
High Risk: below minimum threshold to support current habitat
View HRN II report at https://www.chnep.org/publications

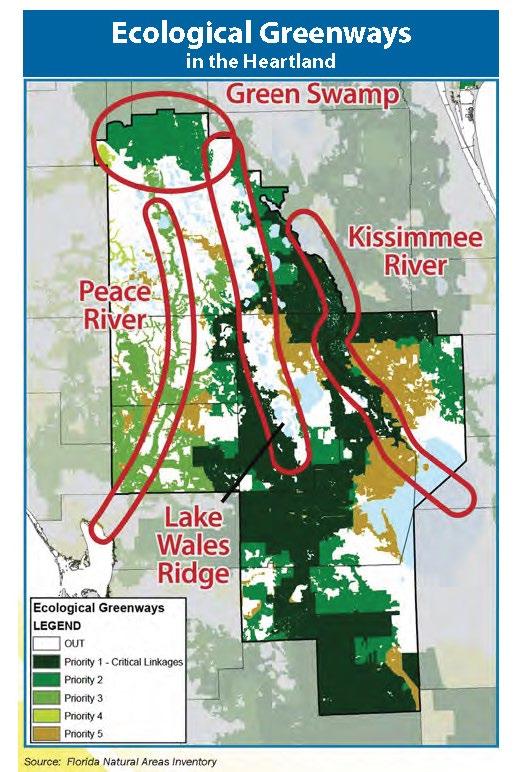
Florida Wildlife Corridor • Florida Wildlife Corridor Act - July 1, 2021 • Everglades to Georgia, west to Alabama • Connecting, protecting Florida’s wildlife • Create incentives for sustaining, conserving green infrastructure. • 18 million acres in Florida, 46% identified as Opportunity Areas (areas of Corridor not yet conserved) floridawildlifecorridor.org

Click to edit Master title styleHeartland Region 1.8 million acres of Opportunity Areas in the Heartland


Coalition Survey Results What benefits could a resiliency coalition have for our region? 78% Preparedness for natural disasters 74% Avoidance of property damage 100% Reliability of infrastructure 85% Preservation of community assets 22% Other • Data all jurisdictions can accept/support and include as part of land use planning • Increased education efforts. • Environmental improvements
Example of Resiliency Project Funding
City of Lakeland $43 million for increased flood storage capacity, improved stormwater infrastructure at Bonnet Springs Park

Regional Planning Councils

Example of Resiliency Project Funding
Coalition Members each join the Heartland Regional Resiliency Coalition as expression of intent and commitment to work together on a regional level to identify opportunities and solutions for ensuring regional resiliency to threats while leveraging resources . Memorandum of Understanding Intent and Key Points Regional Cooperation Regional Resiliency Action Plan Role of Planning in Resiliency Funding Strategies Community Involvement
Path Forward ● Heartland Regional Resiliency Coalition − Science-based data − Regional Coordination ● Regional Resiliency Action Plan ● County-wide Vulnerability Assessments ● Education of: − Local Governments − Agricultural Interests − Communities, Developers 47

c Heartland Regional Resiliency Coalition Established 2022 Members: Local Governments and Governmental Agencies Partnerships and Stakeholder Roles in Future flregionalcouncils.orgheartland2060.orgCfrpc.org
Q&A
49 Discussion
