
Social Vulnerability Mapping for Natural Hazards
2022 Florida Planning Conference 9/9/2022

Dr. Chris Emrich, Ph.D. GISP • Received Ph.D. in 2005 (UofSC) • Currently Endowed Associate Professor of Environmental Science and Public Administration • Urban and Regional Planning • Emergency Management and Homeland Security • Founding Member of UCF Coastal • Creator of www.vulnerabilitymap.org • Formerly • FEMA Long Term Recovery GIS Unit Leader • Research Interests: • Social vulnerability measurement and application • Assessing social equity in disasters • Developing innovative EM solutions


Impetus for this Work


RiskVulnerability


Short History of my Career (so far) 1998 2000 2005 20062007 2008 2010 2012 2015 Through this process, I have been fortunate enough to: - Lead and partner on > 40 extramurally funded projects (> $8 million), - Author 50+ peer reviewed pubs, grey literature pieces, book chapters - Continue to teach the next generation both in/out of the classroom


Understanding where populations reside who have a lower ability to prepare for, respond to, and recover from disaster events – known as social vulnerability – can help decision makers distribute scarce resources before, during, or after disasters.

Social Vulnerability
Cutter
is based on a deep understanding (conceptually and applied) of impact and lack of preparedness
SoVI250200150100500


Adger; Hewitt; King and Rashid;MacGregor;Smithet al.; 2000
Adger; Morrow;Fothergill,Coates;etal.;Norriset al., et al., 2003
Bolin and Klenow, 1988 Hewitt,Blaikie1992,1993Cutter , 1996 Bolin 1997Pelling1998PellingMustafa;Wisner,;Mitchell;Stanford;and,
Social byeventSoVIsciencevulnerabilityhasbeenevolvingfordecades.determinants/variablesarebasedonalonghistoryofpost-fieldworkonimpactonvariouspopulationgroupssocialscientists
Genderzones
What do we know about social vulnerability?
Special needs populations
difficult to identify (infirm, transient) let alone measure; invariably left out of recovery efforts; often invisible in Agecommunities(elderlyand children)
affect mobility out of harm’s way; need special care; more susceptible to harm
Race and ethnicity (non-white; non-Anglo)
Socioeconomic status (rich; poor)
impose language and cultural barriers; affect access to post-disaster recovery funding; tend to occupy high hazard
gender(women)-specificemployment, lower wages, care-giving role
ability to absorb losses and recover (insurance, social safety nets), but more material goods to lose
Housing type and tenure (mobile homes, renters)
Heinz Center, 2002. Human Links to Coastal Disasters. Washington D.C.: The H. John Heinz III Center for Science, Economics and the Environment.
Percent with Less than 12th Grade Education
Percent Speaking English as a Second Language with Limited English Proficiency
Median Age
Percent of population without health insurance
Percent Employment in Service Industry
Percent Civilian Unemployment
SocioeconomicPopulationHousingStructurestructureRace/EthnicityStatusSpecialNeeds
Percent Population under 5 years or 65 and over
Percent Female Headed Households
Percent Female Participation in Labor Force
Percent of Housing Units with No Car
Employment
Median Gross Rent
Percent Employment in Extractive Industries
Percent of Children Living in 2-parent families
Per Capita Income
Percent Households Earning over $200,000 annually
People per Unit
Percent Asian Percent Black Percent Hispanic Percent Native American Percent Poverty
Percent of Household Spending more than 30% of Income on Housing Costs
Percent Households Receiving Social Security Benefits
Social Vulnerability Construction

Median Housing Value

Percent Female
Percent Unoccupied Housing Units
Percent Renters
Percent Mobile Homes
PILLAR DESCRIPTION
Nursing Home Residents Per Capita
Mobile Homes
PILLAR DESCRIPTION
Percent
Employment in Extractive Industries
Percent
Percent
Renters
Turning data into metrics – New/Modified SoVI variables
Civilian Unemployment
Population under 5 years or 65 and over Percent of Children Living in 2-parent families Median Age Percent Female Percent Female Headed Households People per Unit Percent Asian Percent Black Percent Hispanic Percent Native American Percent Poverty Percent Households Earning over $200,000 annually Per Capita Income Percent with Less than 12th Grade Education Median Housing Value Median Gross Rent Percent of Household Spending more than 30% of Income on Housing Costs Percent Households Receiving Social Security Benefits Percent Speaking English as a Second Language with Limited English Proficiency Nursing Home Residents Per Capita Percent of population without health insurance Percent of Housing Units with No Car Employment SocioeconomicPopulationHousingStructurestructureRace/EthnicityStatusSpecialNeeds Some of these changes are scale changes Others are aggregation changes Several are brand new(er) variables. - Mortgage (Housing Cost) Burden - Lack of Health Insurance - Lack of Access to Auto - English Language Proficiency Several are being tested for inclusion - Heir’s Property Indicator - Single Parent Houses (as a replacement for Female Headed Households) - Disability - Broadband Access
Percent
Percent
Percent
Unoccupied Housing Units
Employment in Service Industry Percent Female Participation in Labor Force
Percent

into vulnerabilityspecificdrivers whereusers can explore each ofthe 29 variables in SoVI to see where vulnerabilityincrease/decreasethey
factors
1:
a deep
2: SoVI captures the
Social Vulnerability – County Level Glades High SoVI Fac. 3 Hispanic, Extractive Industry Fac. 6 Ethnicity (Native American) Santa Rosa Medium-low SoVI Fac. 2 Age (Elderly) Fac. 4 Race (Black), No Auto Miami-Dade Medium SoVI Fac. 3 Fac.American)Fac.ExtractiveHispanic,Industry6Ethnicity(Native1Wealth Broward Medium-low SoVI Fac. 5 Service Industry Fac. 1 Wealth DeSoto High SoVI Fac. 3 IndustryExtractiveHispanic, Hillsborough Medium-low SoVI Fac. 5 Service Industry Fac. 2 Age (Elderly) Franklin High SoVI Fac. 4 Race (Black), No Fac.Auto 6 (Ethnicity) Native American St. Johns Low SoVI Fac. 1 Lack of Wealth Fac. 4 Race (Black) No Auto Putnam Medium-high SoVI Fac. 1 Lack of Wealth Fac. 4 Race (Black) No Auto Seminole Low SoVI Fac. 5 Service Industry Fac. 2 Age (Elderly) Fac. 1 Wealth Social threeunderstandSoVIinmanifestsvulnerabilityitselfdifferentlyeveryplace.enablesuserstovulnerabilityatdifferentlevels

• Level component groupings of variables constituting where SoVI general
• Level Provides dive
amain drivers –
generally has between 5-8
• Level the SoVI shows
3:


score
users the composite score/class (high – low) forthe area of interest
RobustnessSoVI’s Over Time
PNAS 105 (7): 2301 2306.
Changes in VulnerabilitySocial1960-2010
Cutter, S.L. and C. Finch, 2008. Temporal and spatial changes in social vulnerability to natural hazards.

% Variance explained = 75.2% 8 N=1404factors Components: Race/ethnicity & class Age & ethnicity (Hispanic kids) ElderlyUrban/rural SoVI’s Scalability


Just because a county is characterized by one level of vulnerability does not mean that all parts of the said county exhibit the same vulnerabilityofcomprehensiveenablesZoomingcharacteristics.inordownscalingamoreunderstandingthedrivingforcesofVulnerabilitySocial CountTract UnitsHousing Population2010 High 14 49,476 65,980 Medium High 62 140,578 261,646 Medium 152 339,128 747,580 Medium Low 103 216,956 512,144 Low 30 64,250 160,716 Social Vulnerability – Tract Level SoVI is available and has been used to study developmentinteractionshuman/environmenttheatmanydifferentgeographicscales,including:WearecloselyconnectedtotheUSCensusareouragileenablesustoaddgeographiesastheybecomeavailable 1. County 2. Census Tract 3. Census Block Group 4. ZCTA 5. City 6. DistrictCongressional

RISKdisasters.= Threat * Vulnerability *

This representation of social vulnerability was derived from www.vulnerabilitymap.org
Understanding where populations reside who have a lower ability to prepare for, respond to, and recover from disaster events – known as social vulnerability – can help decision makers distribute scarce resources before, during, or after Severity of Consequences
Social Vulnerability

How can SoVI support planning decision making?


SoVI in Planning and Preparedness

6,433 Academic Citations 1,895 Academic Citations 216 Academic Citations 1,067 Academic Citations

-
Caution Not all Models are Created Equally
Deployment of NGO response assets

Different
Targeting of special populationsneeds lenses provide a difference sense of need.
http://www.memphischamber.com

Case Study:
(NewMetropolitanMemphisAreaMadridFault)


8 Factors, 74.2% variance urban/ruralage,Socioeconomicexplainedstatus,renters,

(%g)

In
Social Vulnerability Disaster Mitigation

SoVI for Mitigation
can SoVI aid in better CDBG-MIT decision making
How
RISK = Threat *
Vulnerability * Severity of Consequences
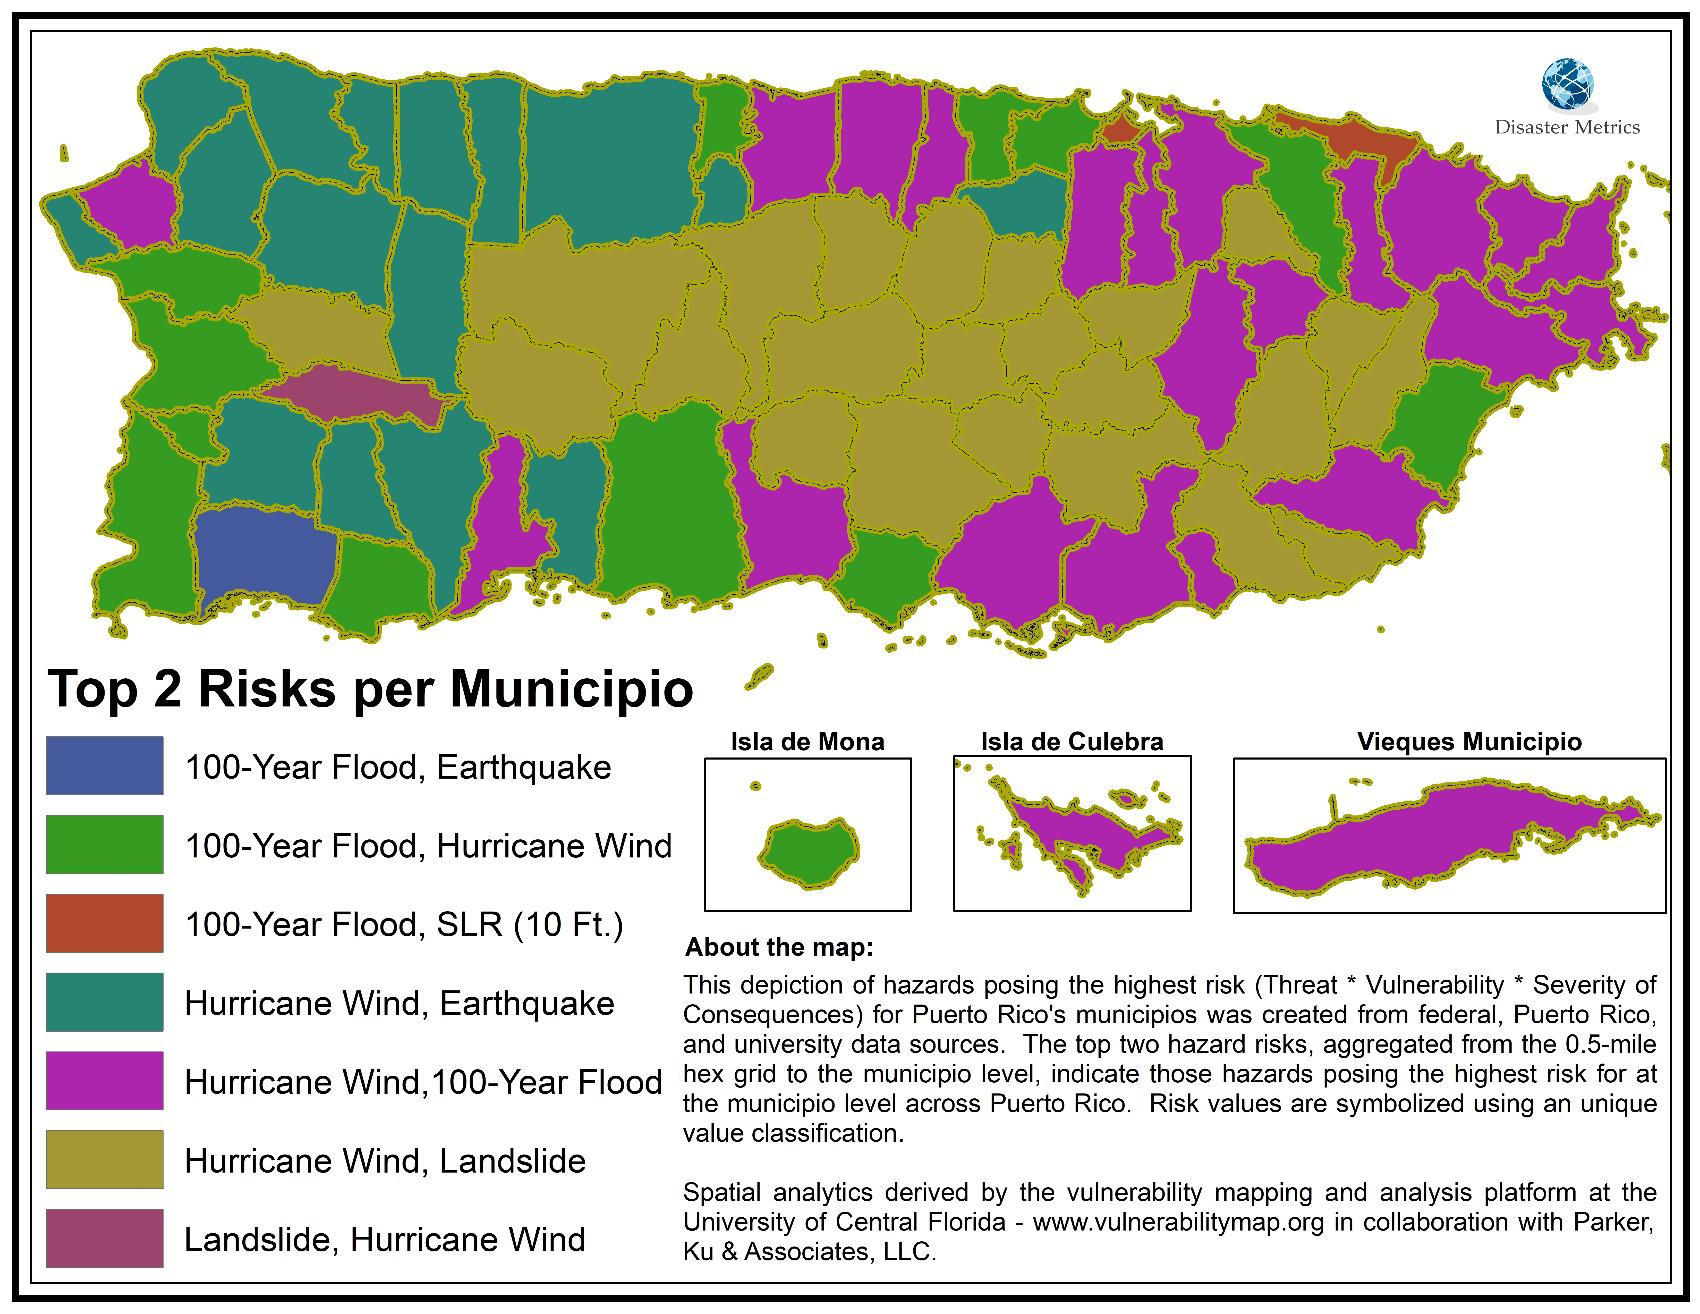
Understanding the spatial and temporal aspects of hazards across Puerto Rico

USGS study of rainfall induced landslides on Puerto Rico produced a new high-resolution model of rainfall-induced landslide susceptibility for the main island.

NOAA radius to maximum wind data enabled creation of wind fields for hurricanes within 500 miles of Puerto Rico. The number of “hurricanes” intersecting each hex grid was summed to provide a hurricane wind count.
Preliminary 100-year flood zones, provided by the Puerto Rico Planning Board were spatially intersected with Puerto Rico’s 0.5mile hexagonal grid.


Vulnerability * Severity of Consequences
Understanding the spatial pattern of people and things susceptible to harm from disasters
RISK = Threat *
Social Vulnerability
Understanding where populations reside who have a lower ability to prepare for, respond to, and recover from disaster events – known as social vulnerability – can help decision makers distribute scarce resources before, during, or after disasters. This representation of social vulnerability was derived www.vulnerabilitymap.orgfrom
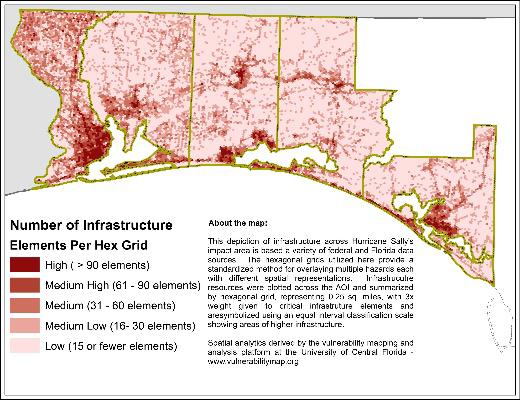
Vulnerability (Social + Population + Infrastructure)


RISK = Threat *
Vulnerability * Severity of Consequences
Building an understanding of impacts from a variety of perspectives
RISK = Threat * Vulnerability * Severity of Consequences ���������������������������������������������������� = ������������������������ �������������������������������������������� ⅀ ���������������������������������������� ���������������������������� ���������������������������������������������������� �������������������� , ������������������������ ���������������������������������������������������� �������������������� , �������������������������������� ���������������������������� ��������������������


Risk across Puerto Rico

Social Vulnerability
Wrap Up and Take-Aways
What

we know about SoVI SoVI is • Utilized at many levels of intervention from local to national • Scalable • Replicable • Still growing with science, better data, innovation


Why you should consider adding SoVI to your toolkit SoVI® provides a(n) - A-political - Updated - Place based - Theoretically derived - Empirically formulated - ScalablewayTransferabletoquickly identify and assess lack of adequate capacity to prepare for, respond to, and rebound from disaster events SOVI (www.vulnerabilitymap.org) provides this information in an easily understood format.

Dr. Chris Emrich Boardman Endowed Professor of Environmental Science and Public Administration School of Public Administration National Center for Integrated Coastal Research Sustainable Coastal Systems Cluster University of Central Christopher.emrich@ucf.eduFlorida

